I enjoy designing PowerPoint presentations. Despite their bad reputation, I believe that the problem is not with the software itself, but rather with how is often used. To create an effective presentation is important to develop a coherent structure and memorable visuals to support the story. Over the years, I’ve created many presentations. The examples I’m sharing here have been adapted so they can be understood without me talking.
Start here
How to make more effective graphs
The training-session slides: what an effective data visualization is, choosing the right graph and improving its style.
Data viz & presentation
Don’t dread the poster
Why scientific posters get a bad name, and how to design better ones.
Data viz & presentation
How a seed became a tree
The story of how the Baltic MSP community built a system, based on a marine spatial data infrastructure, to access planning data.
HELCOM data & GIS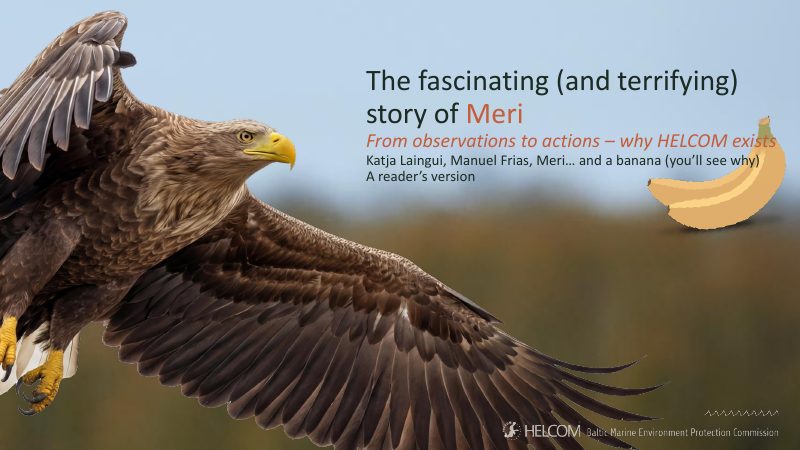
The fascinating (and terrifying) story of Meri
A reader’s version of the talk I gave with Katja Laingui at Otaniemi upper secondary school on 27 October 2026: the story of Meri, a white-tailed eagle, and what her family tells us about the health of the Baltic Sea and why HELCOM exists.
Baltic Sea & outreach
2026 (1)
2025 (1)
2021 (1)
2019 (4)
How a seed became a tree
The story of how the Baltic MSP community built a system, based on a marine spatial data infrastructure, to access planning data.
HELCOM data & GIS
Ideas to design better slides
A training-session recap on what makes a presentation effective: story versus design, and how to improve your slides.
Data viz & presentation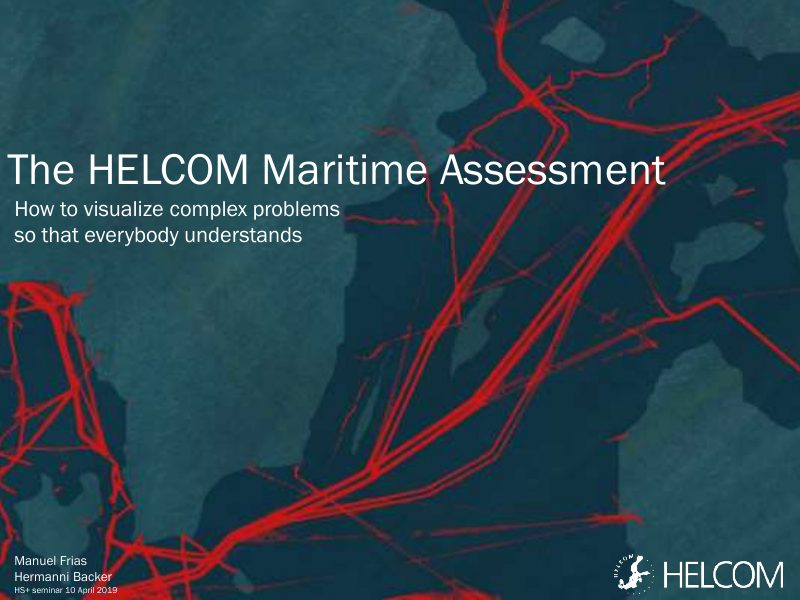
The HELCOM Maritime Assessment: how to visualize complex problems so that everybody understands
A geographer and a biologist show how they tried to make complex Baltic Sea issues understandable through visualization.
Data viz & presentation
The struggle to get MSP data
How HELCOM built a spatial data infrastructure so planners can find, view and download Maritime Spatial Planning data.
HELCOM data & GIS
2018 (4)
Data visualization training session (summary)
A written summary of a training session: what makes a graph effective, which graph fits which data, and how to improve its style.
Data viz & presentation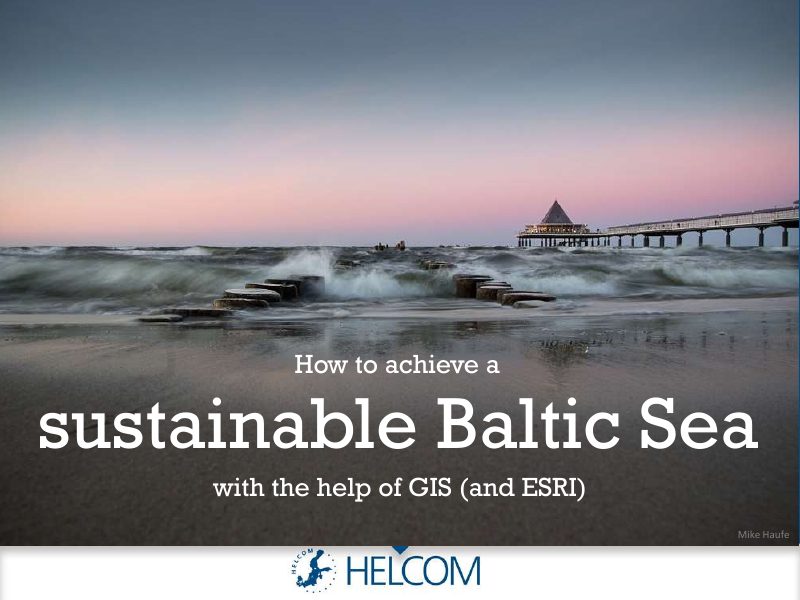
How to achieve a sustainable Baltic Sea with the help of GIS (and Esri)
A light-hearted double act on how GIS helps HELCOM look after the Baltic Sea.
HELCOM data & GISHow to make more effective graphs
The training-session slides: what an effective data visualization is, choosing the right graph and improving its style.
Data viz & presentation
Presentation training session (summary)
A written summary of a training session on preparing presentations and designing better slides.
Data viz & presentation
2017 (2)
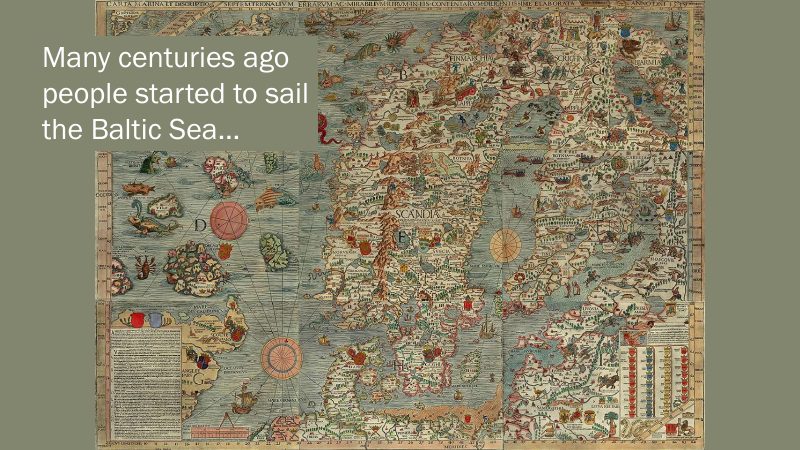
Baltic LINes, 2nd MSP Forum
A story about ships’ freedom of navigation in the Baltic Sea and the pressure from other uses such as wind farms and cables.
MSP in the Baltic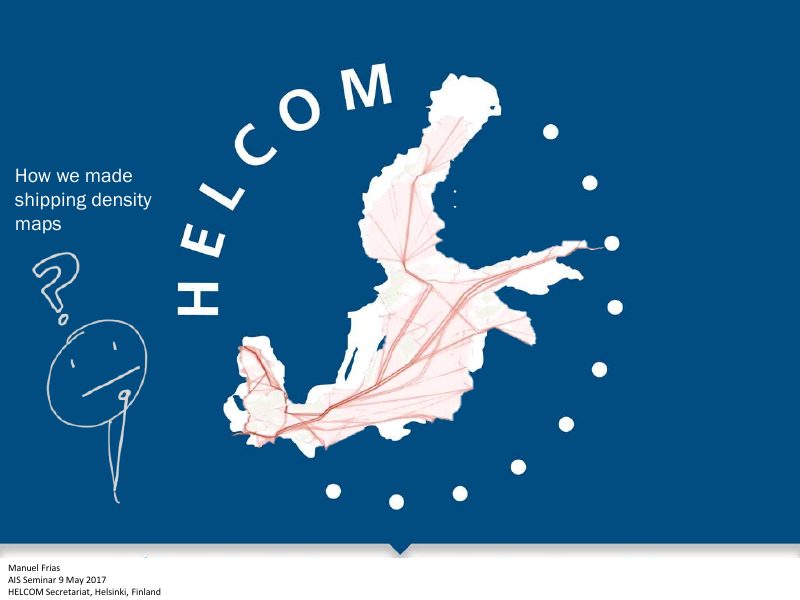
How we made shipping density maps
How HELCOM turned ship-tracking (AIS) signals into shipping density maps, and the methods behind them.
AIS & maritime data
2016 (1)
2015 (5)
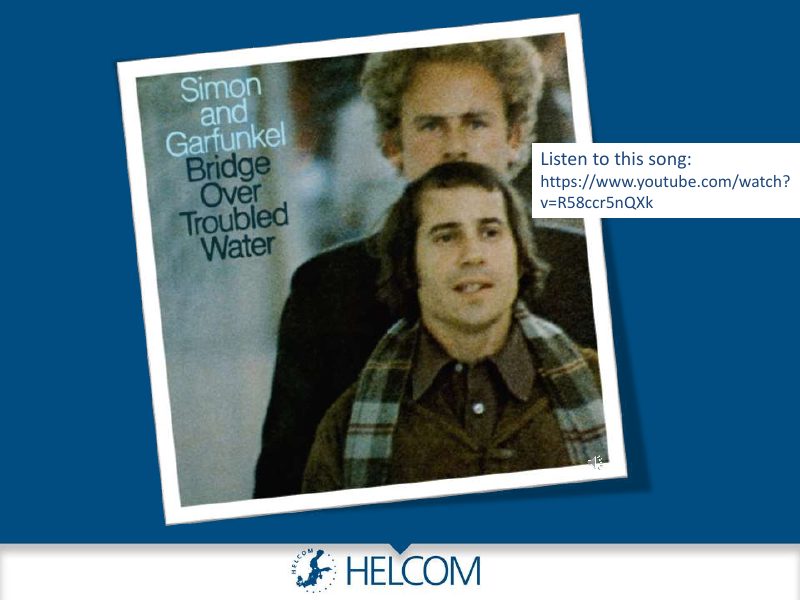
Bridge over troubled water
A playful introduction to HELCOM and the Baltic Sea for a Master on MSP class, built around a song.
MSP in the Baltic
Changing the data visualization culture in HELCOM
How Plan Bothnia opened my eyes to data visualization, and the challenge of changing visualization culture at HELCOM.
Data viz & presentation
Learning to handle Automatic Identification System data
Why and how the HELCOM Secretariat uses AIS ship-tracking data, and why its full potential is not yet used.
AIS & maritime data
MSP in the Baltic Sea: a love story
A love story: how HELCOM and VASAB came to work together on coherent MSP across the Baltic.
MSP in the Baltic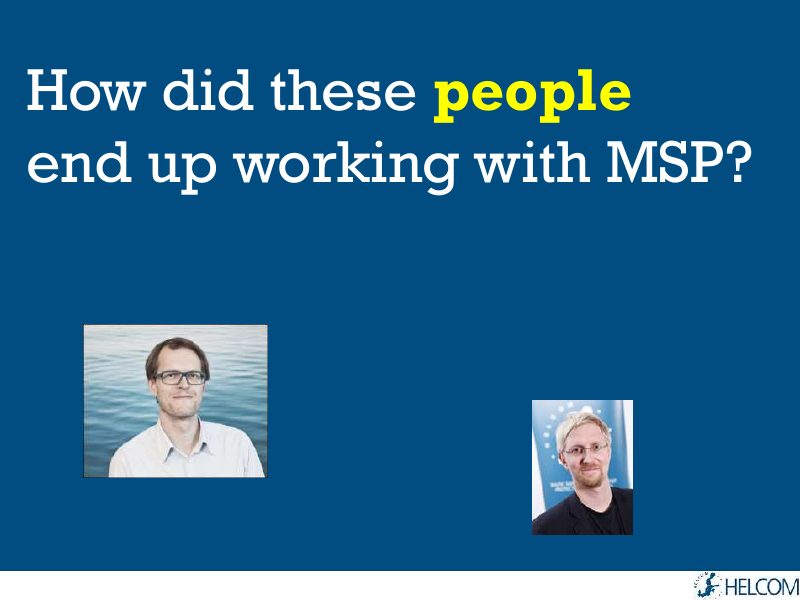
Working with MSP: is there hope? (Seville 2015)
How people from different backgrounds ended up working with MSP, and their advice to students.
MSP in the Baltic
2014 (5)
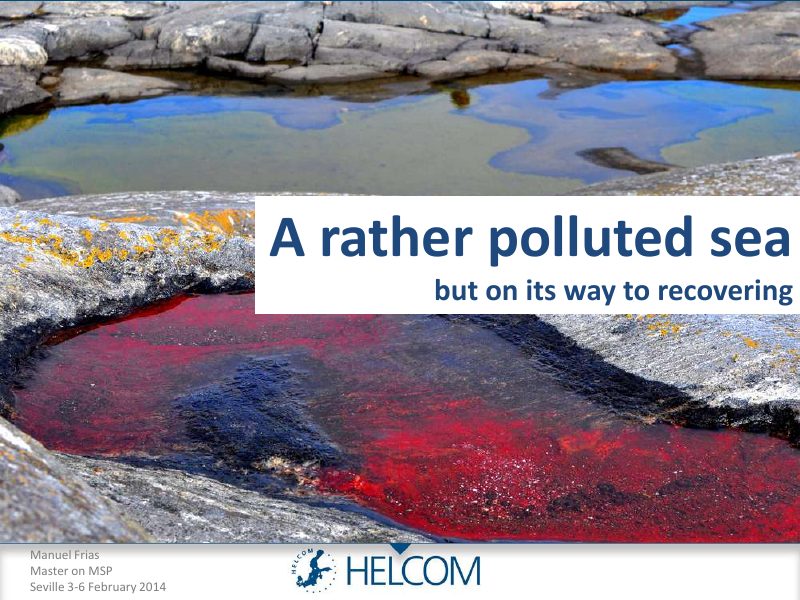
A rather polluted sea, but on its way to recovering
A tour of the Baltic Sea for MSP students: how big it is, its catchment area, and why it is polluted but recovering.
MSP in the Baltic
MSP in the Baltic Sea: coherent across borders, dream or reality
Why Maritime Spatial Planning matters in a busy Baltic Sea, and whether it can be coherent across borders.
MSP in the Baltic
My life in some slides
Where I come from and why I ended up in Finland, told to MSP students.
Career & personal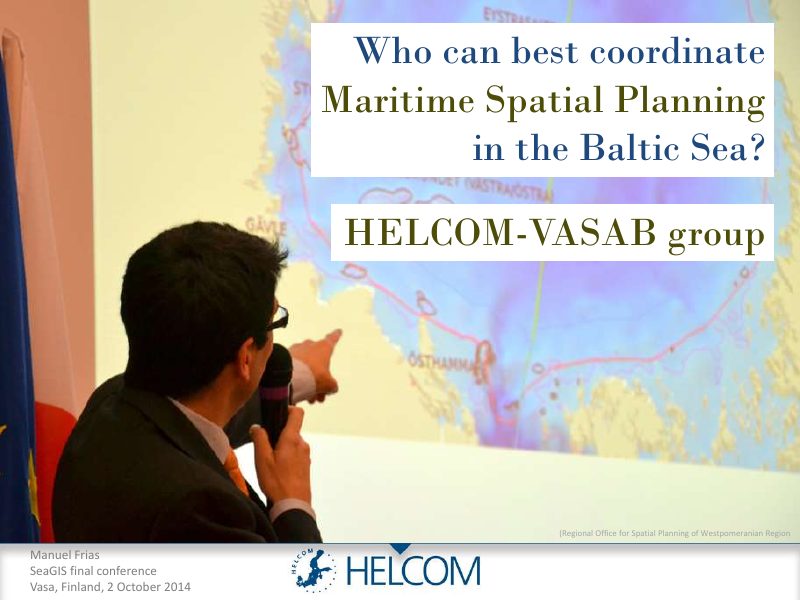
Who can best coordinate Maritime Spatial Planning in the Baltic Sea?
HELCOM and VASAB as an unlikely pair: who is best placed to coordinate MSP in the Baltic Sea?
MSP in the Baltic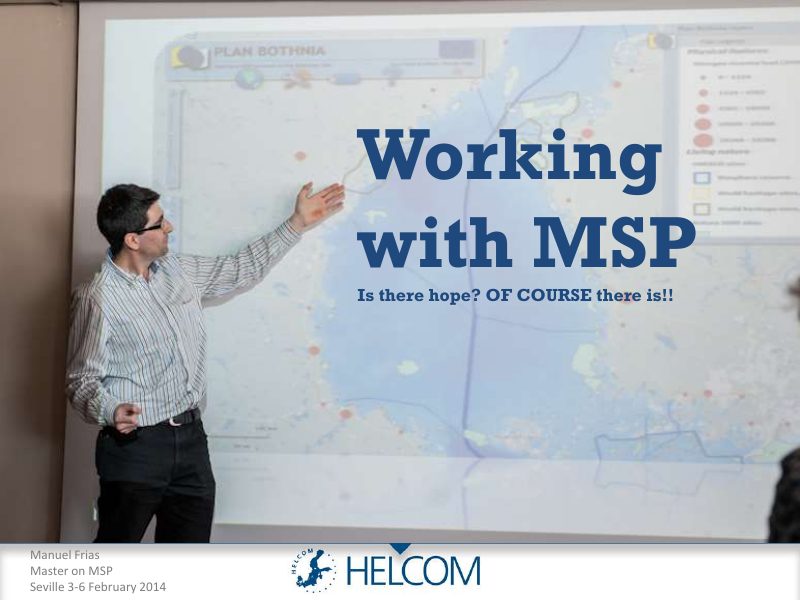
Working with MSP: is there hope? (Seville 2014)
Reasons for optimism about working with MSP in the Baltic Sea, from job prospects to the regional MSP roadmap.
MSP in the Baltic
2013 (4)
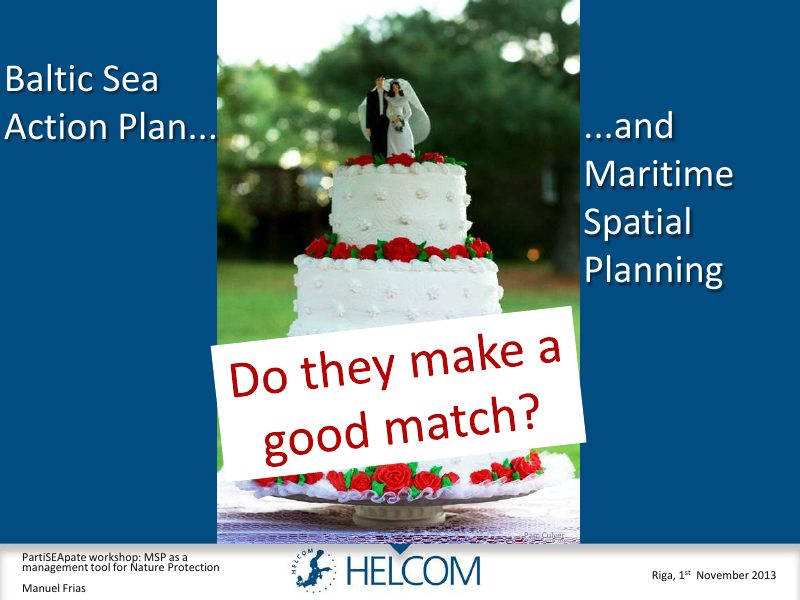
Baltic Sea Action Plan and Maritime Spatial Planning
Do the Baltic Sea Action Plan and Maritime Spatial Planning make a good match? A look at the plan’s history and goals.
MSP in the Baltic
HELCOM Data: present and future
How HELCOM shares data, from early atlases to today’s map services, and where it is heading.
HELCOM data & GIS
HELCOM MORE: past, present and future
Where the monitoring revision stood: who has reported what so far, and the HELCOM map service.
HELCOM data & GIS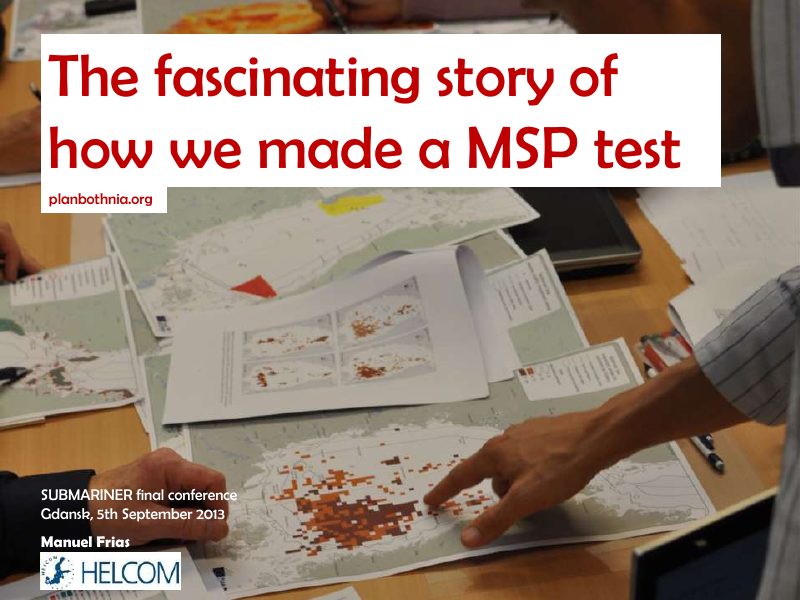
The fascinating story of how we made an MSP test
How Plan Bothnia tested a transboundary MSP process in two phases, from data collection to a spatial plan.
MSP in the Baltic
2012 (4)
A transboundary pilot plan for the Bothnian Sea
The story of a transboundary pilot plan, presented at the Plan Bothnia final conference.
MSP in the Baltic
Plan Bothnia: creating, collecting and sharing data
How Plan Bothnia created, collected and shared the data needed for a transboundary plan.
MSP in the Baltic
Project MORE
How HELCOM’s strategy to monitor and assess the health of the Baltic Sea was being revised.
HELCOM data & GIS
Reflecting about data
What to do when data does not exist or cannot be harmonized, and which Plan Bothnia ideas can be exported.
MSP in the Baltic
2011 (5)
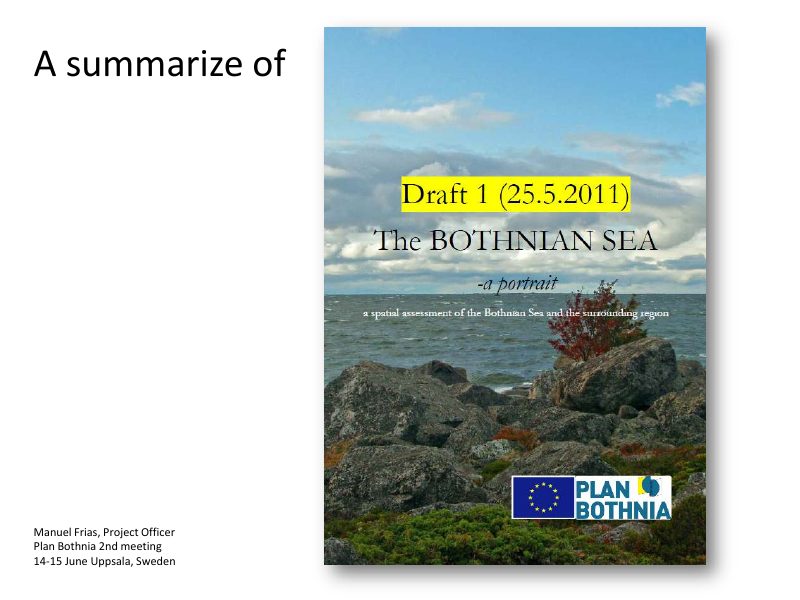
A summary of The Bothnian Sea: a portrait
A summary of the draft spatial assessment of the Bothnian Sea, with the 128 datasets collected and the maps in each chapter.
MSP in the Baltic
GIS in the Plan Bothnia project
A short presentation on the use of GIS in Plan Bothnia, given at a planning seminar.
MSP in the Baltic
How I managed (and suffered) to find a job in Finland
A personal account of finding a job in Finland as a foreigner, told at a panel discussion at Aalto University.
Career & personal
Plan Bothnia web services: openness and transparency
How Plan Bothnia put openness and transparency into practice with open, accessible data and web services.
MSP in the Baltic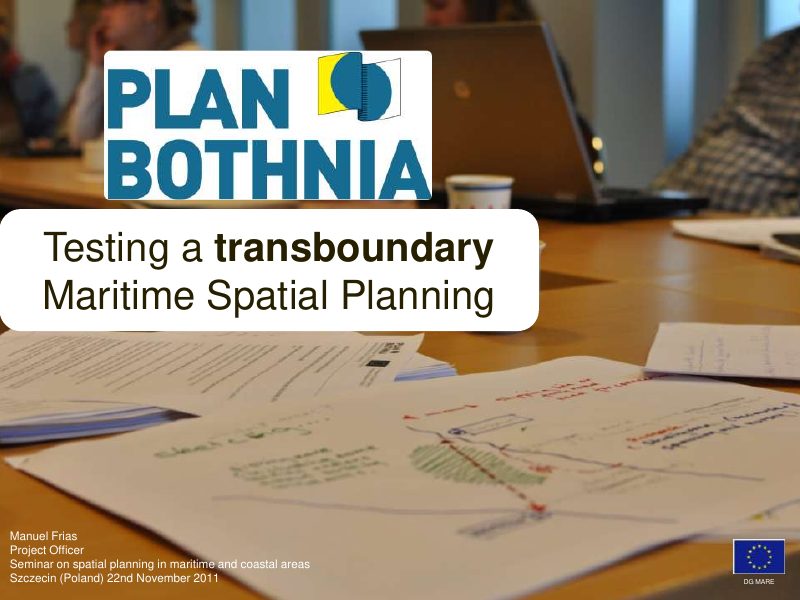
Testing a transboundary Maritime Spatial Planning
A pilot of transboundary planning in the 60,000 km² Bothnian Sea, presented at a seminar in Szczecin.
MSP in the Baltic