How we made shipping density maps

2017 · 41 slides · AIS & maritime data

How HELCOM turned ship-tracking (AIS) signals into shipping density maps, and the methods behind them.

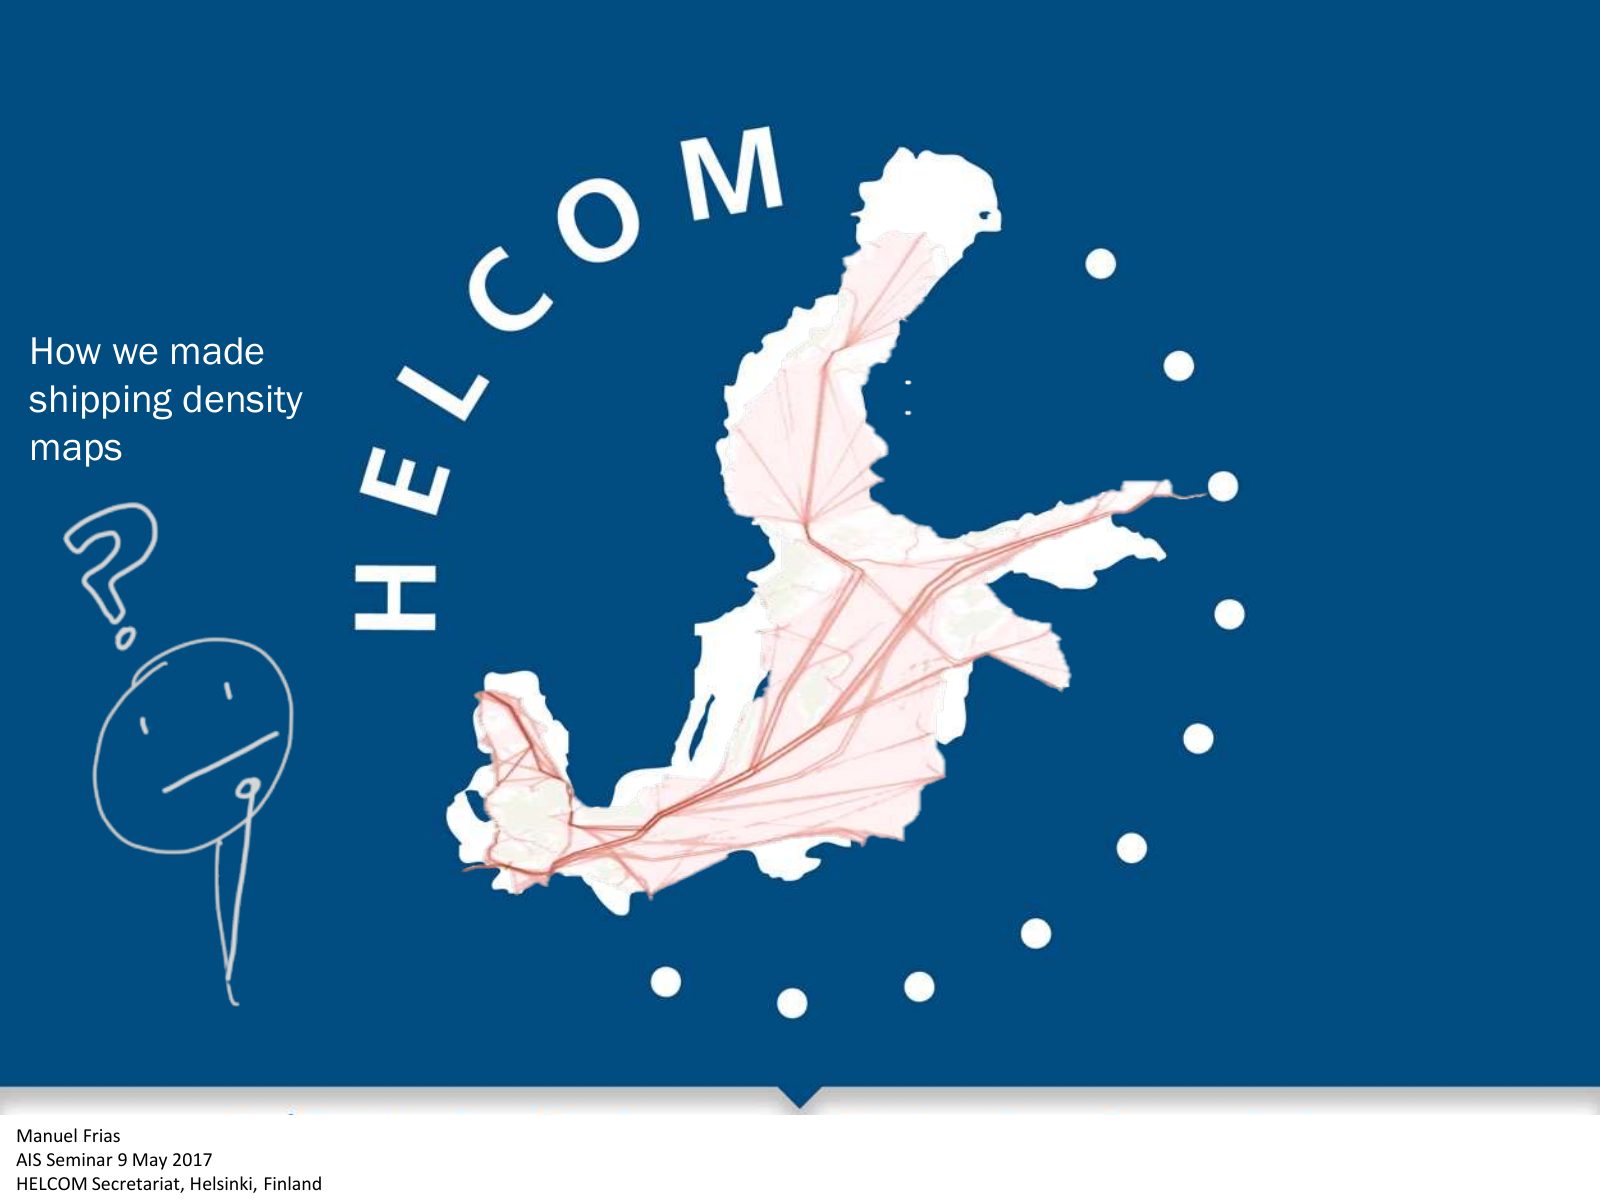
Slide 1 of 41: picture slide without text
Slide 2 of 41: How we made shipping density maps Manuel Frias AIS Seminar 9 May 2017 HELCOM Secretariat, Helsinki, Finland
Slide 3 of 41: Let’s play! First, let’s have a look at the maps we produced https://goo.gl/qlst9R
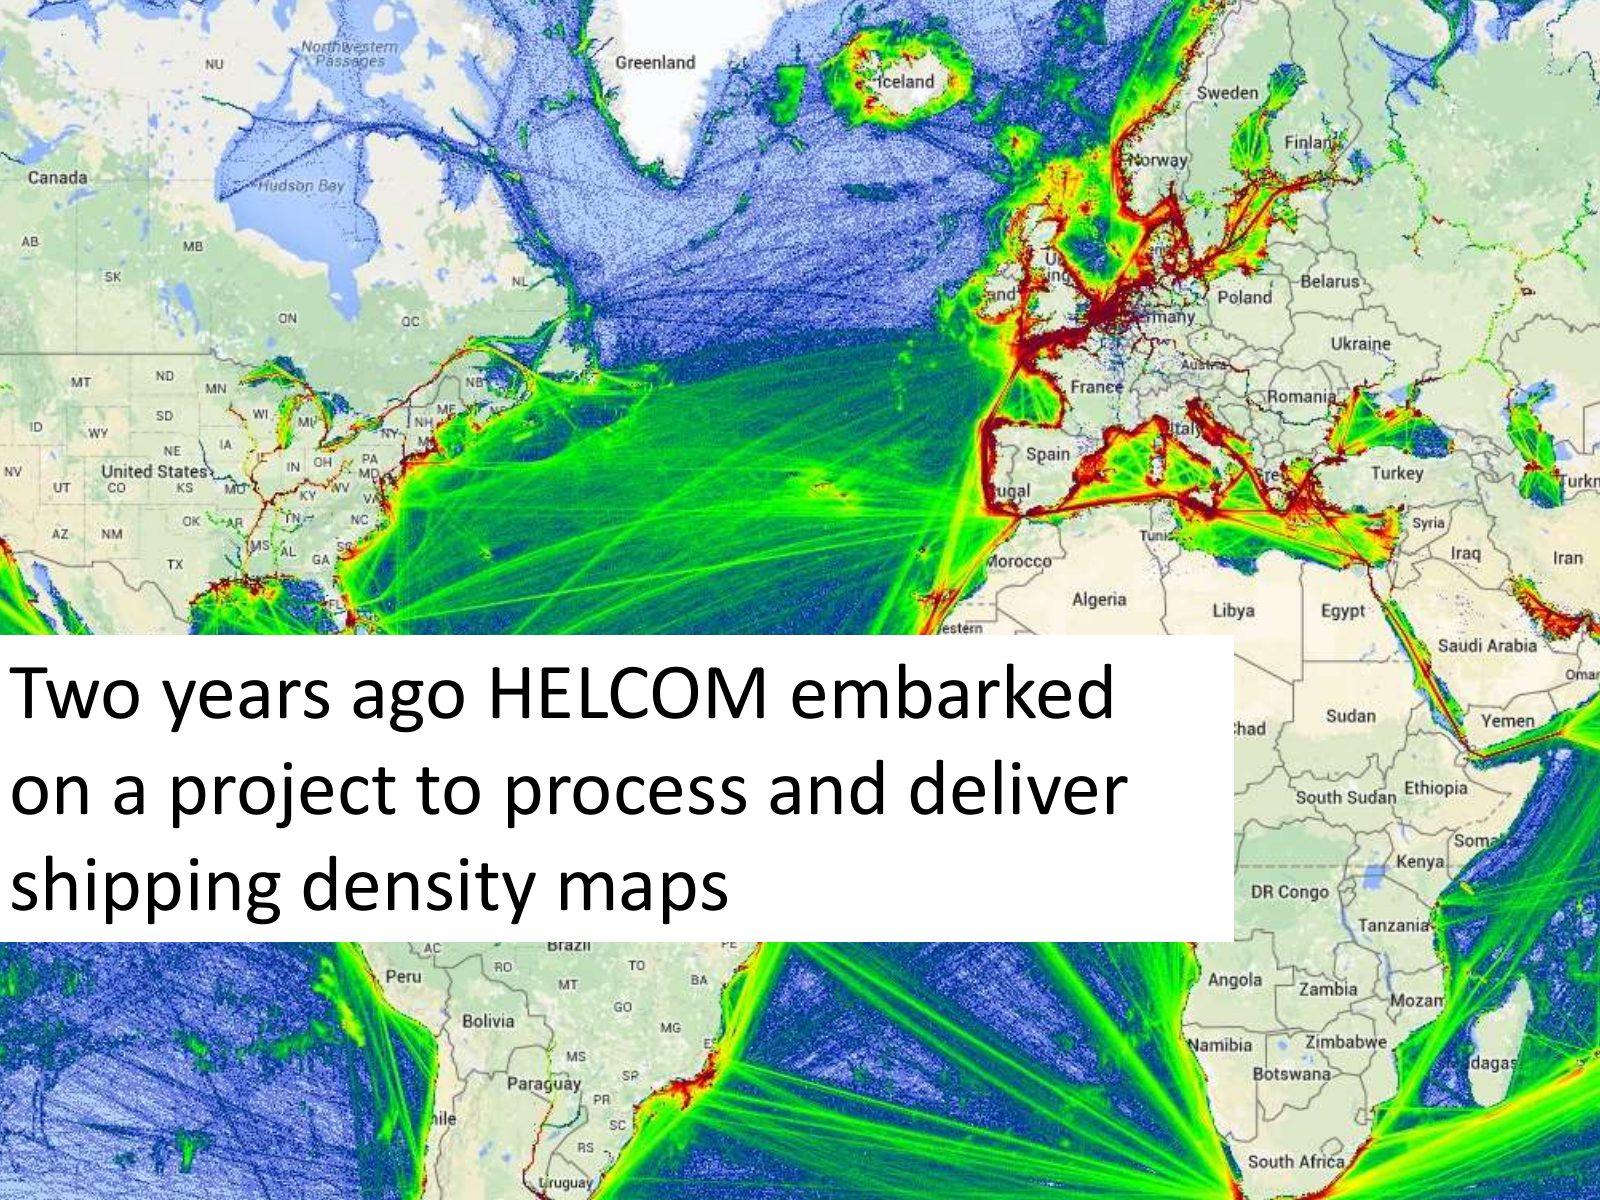
Slide 4 of 41: Two years ago HELCOM embarked on a project to process and deliver shipping density maps
Slide 5 of 41: We started reserching and came to two conclusions
Slide 6 of 41: 1 There are different methods
Slide 7 of 41: L1 Grid cell radius L2 cell radius line
Slide 8 of 41: 2 The result of many methods is based on complicated formulas—very difficult to understand!
Slide 9 of 41: So we embraced the KISS principle
Slide 10 of 41: K IS S eep t imple tupid principle
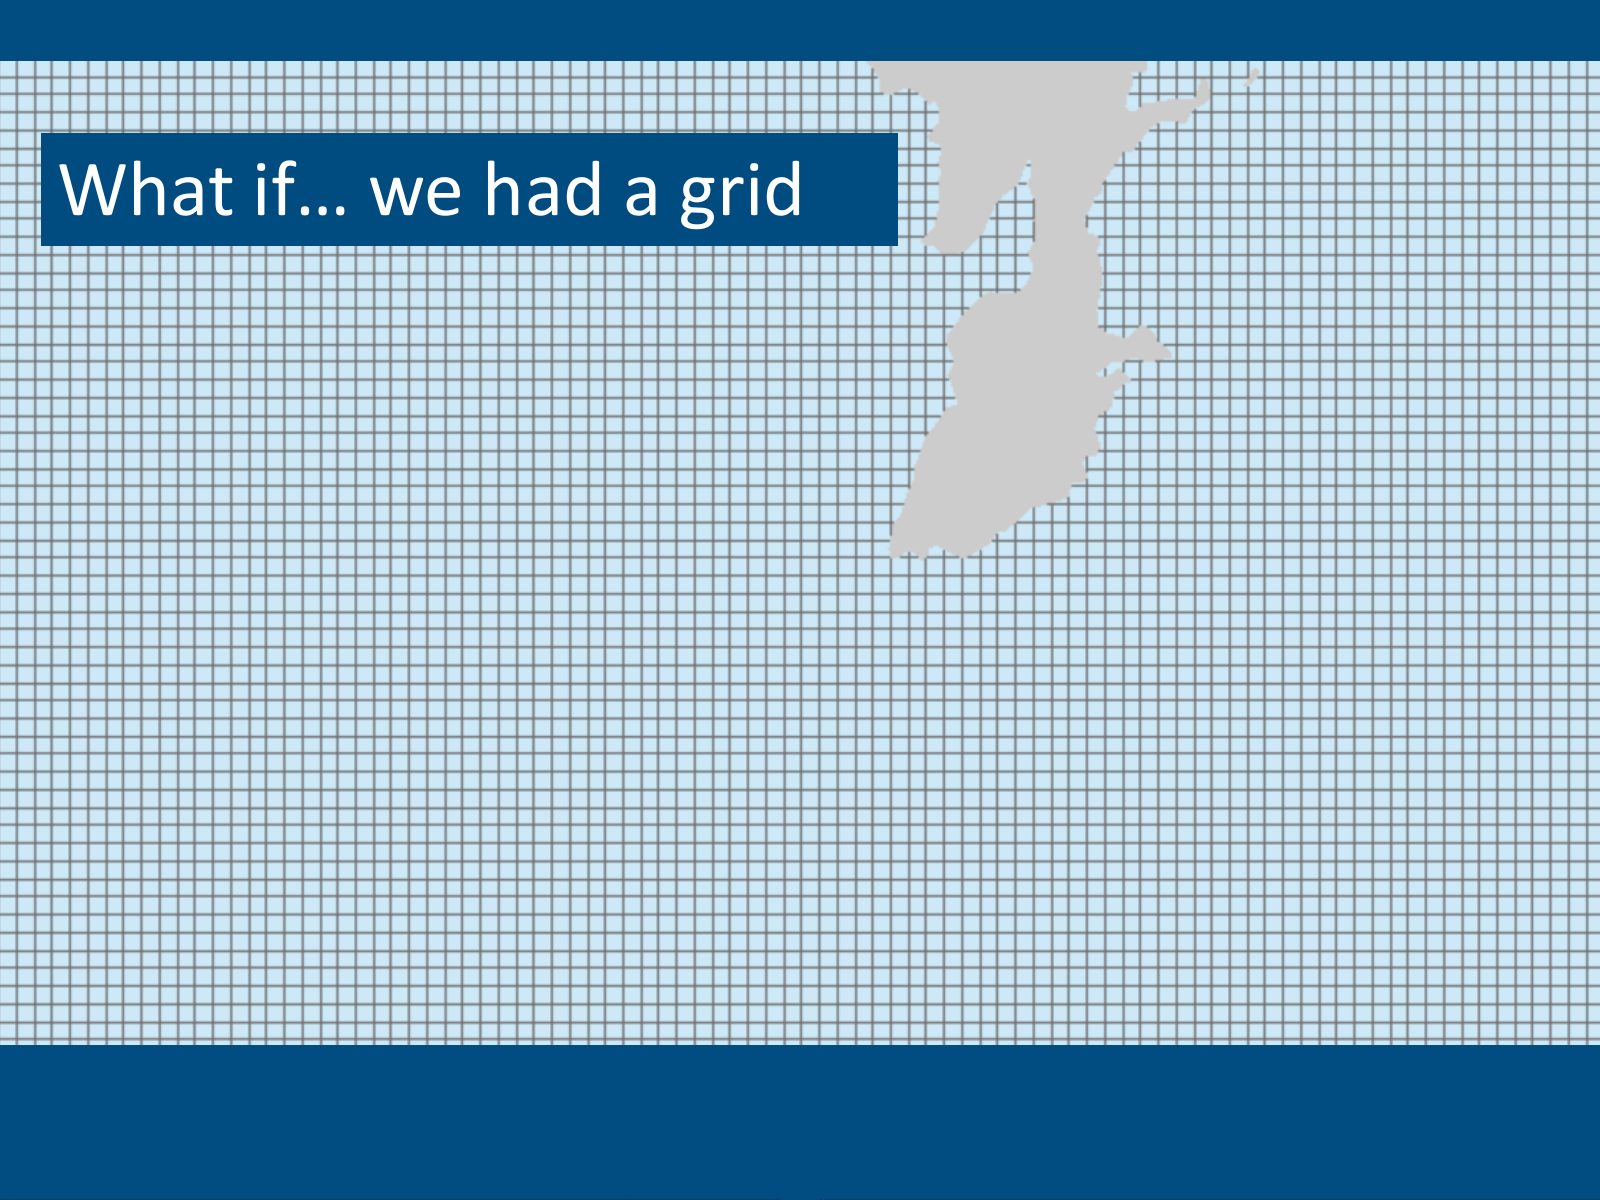
Slide 11 of 41: What if… we had a grid
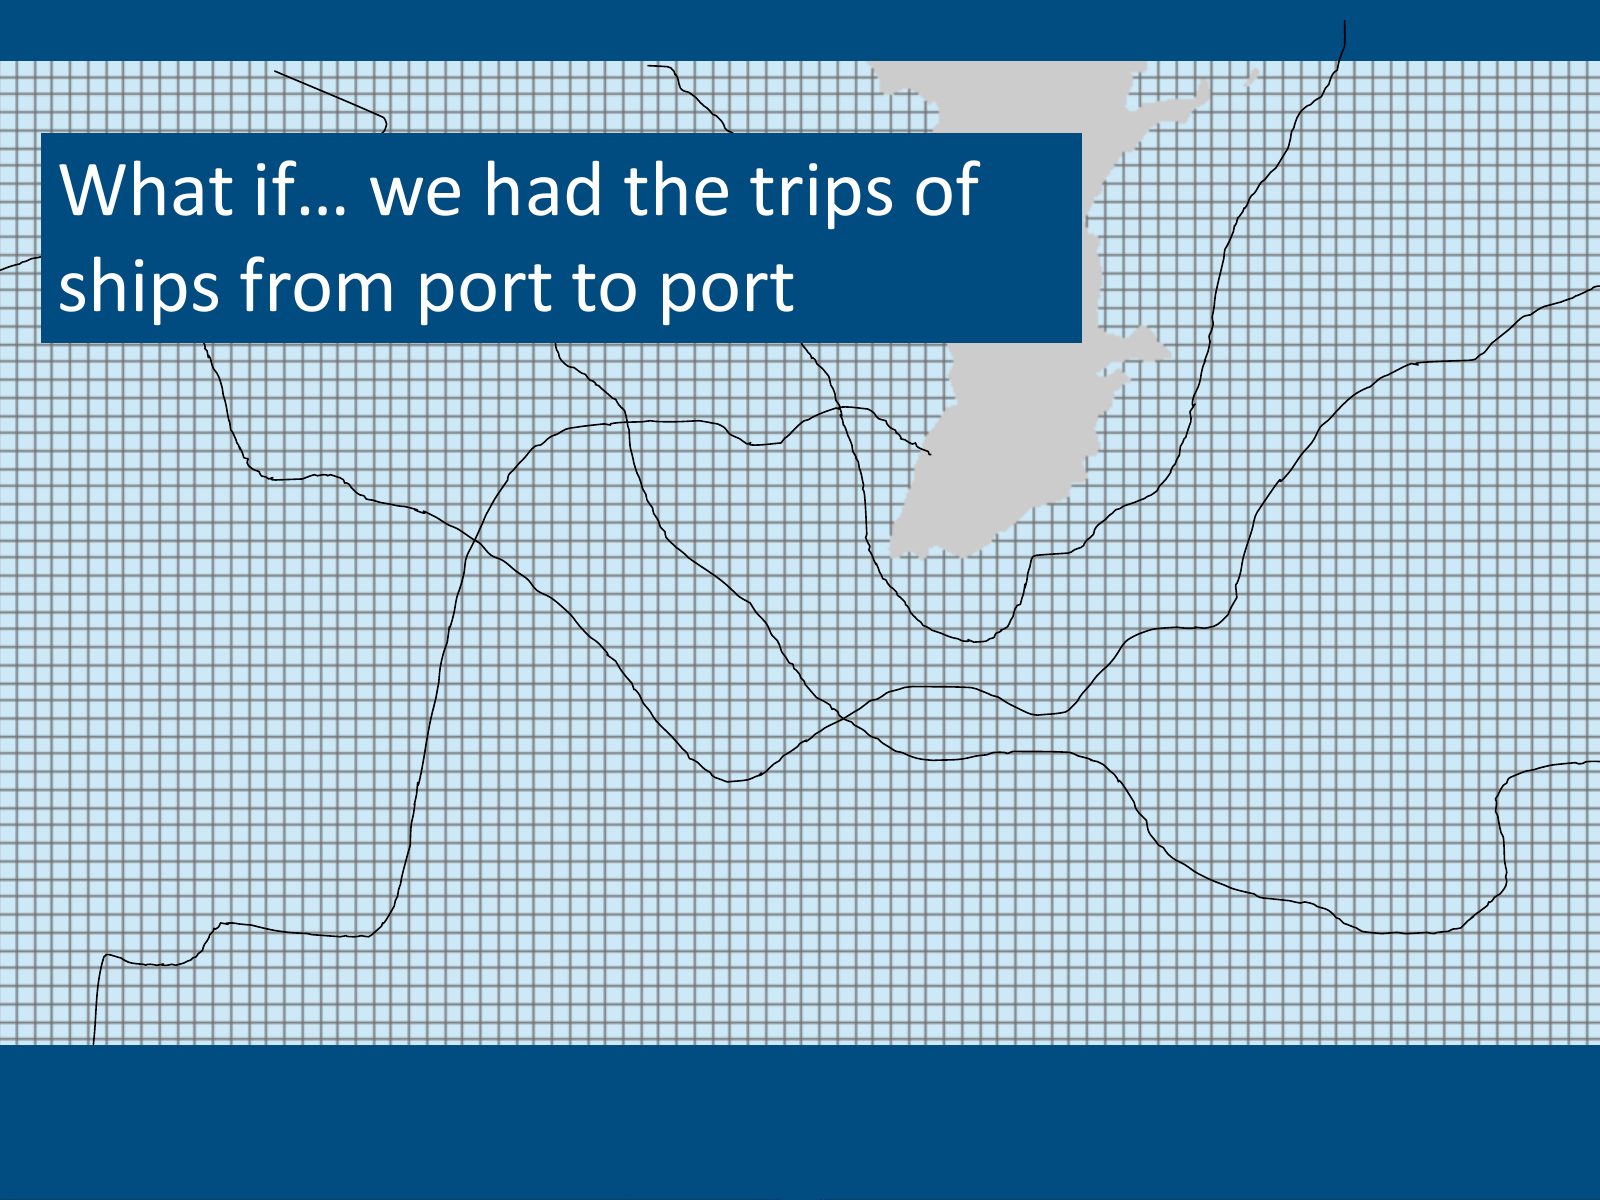
Slide 12 of 41: What if… we had the trips of ships from port to port
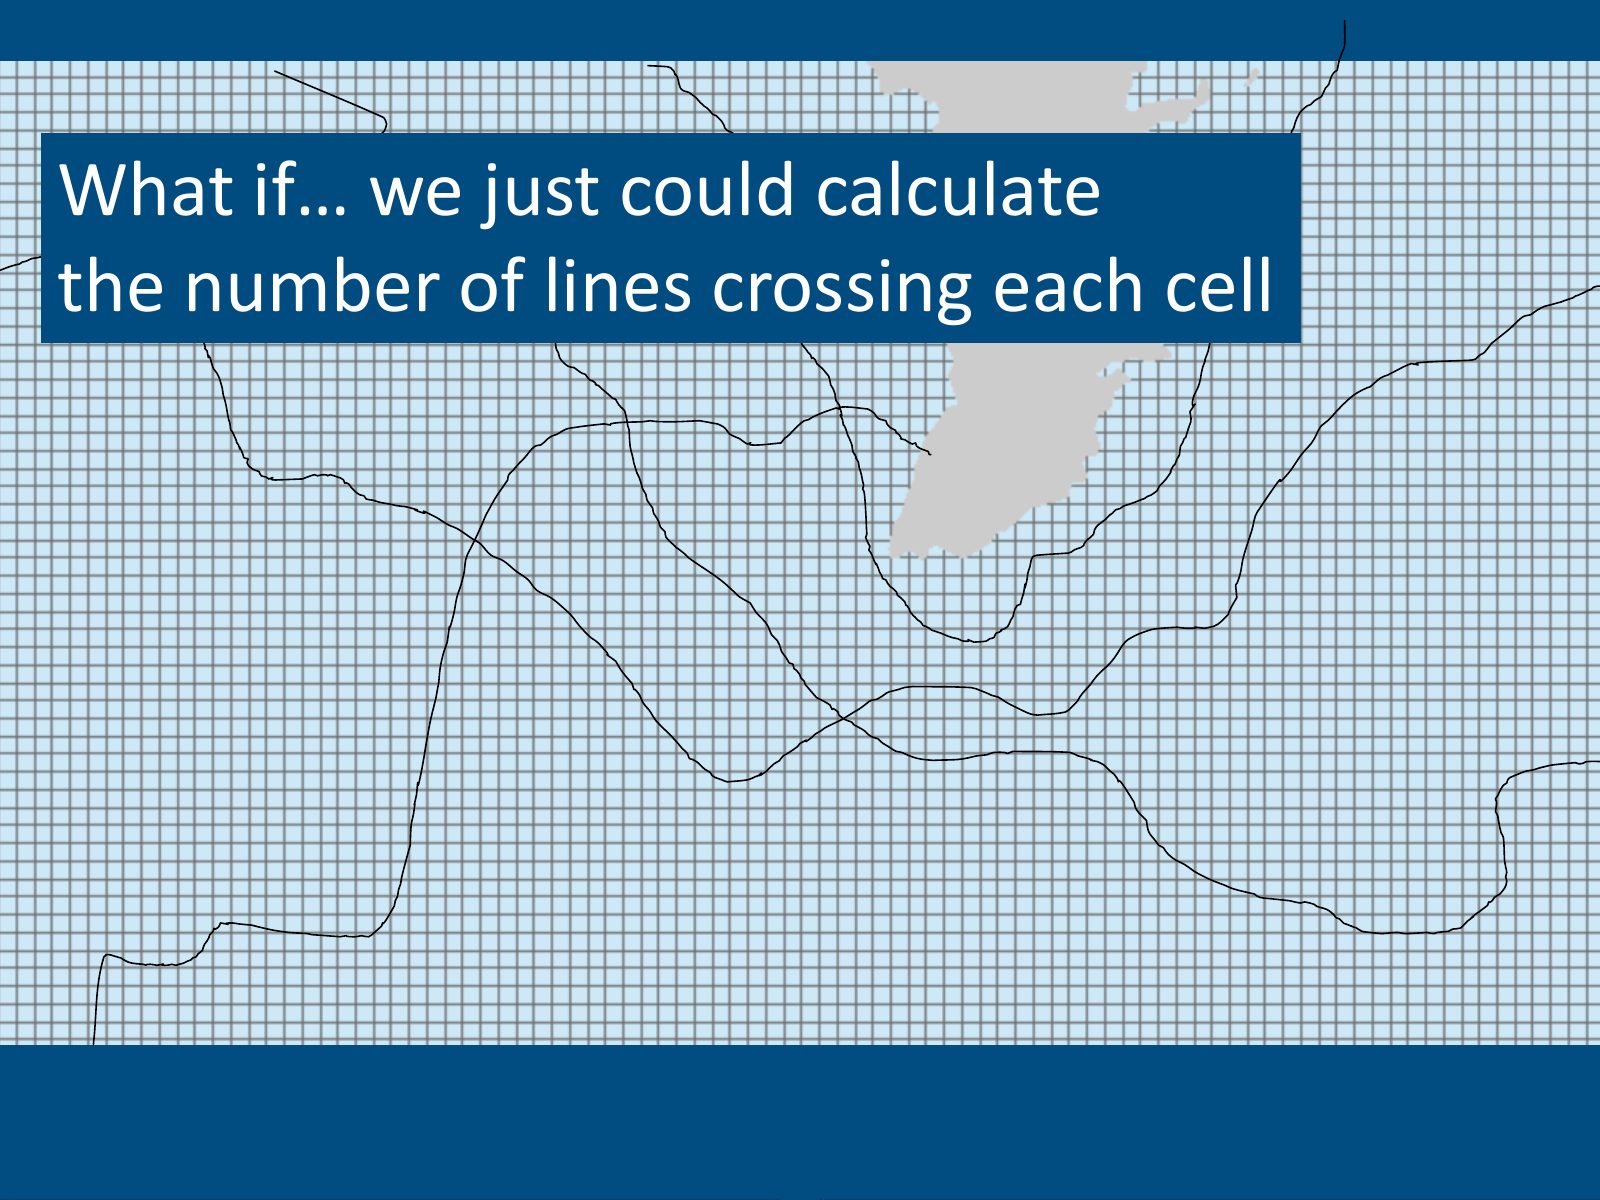
Slide 13 of 41: What if… we just could calculate the number of lines crossing each cell
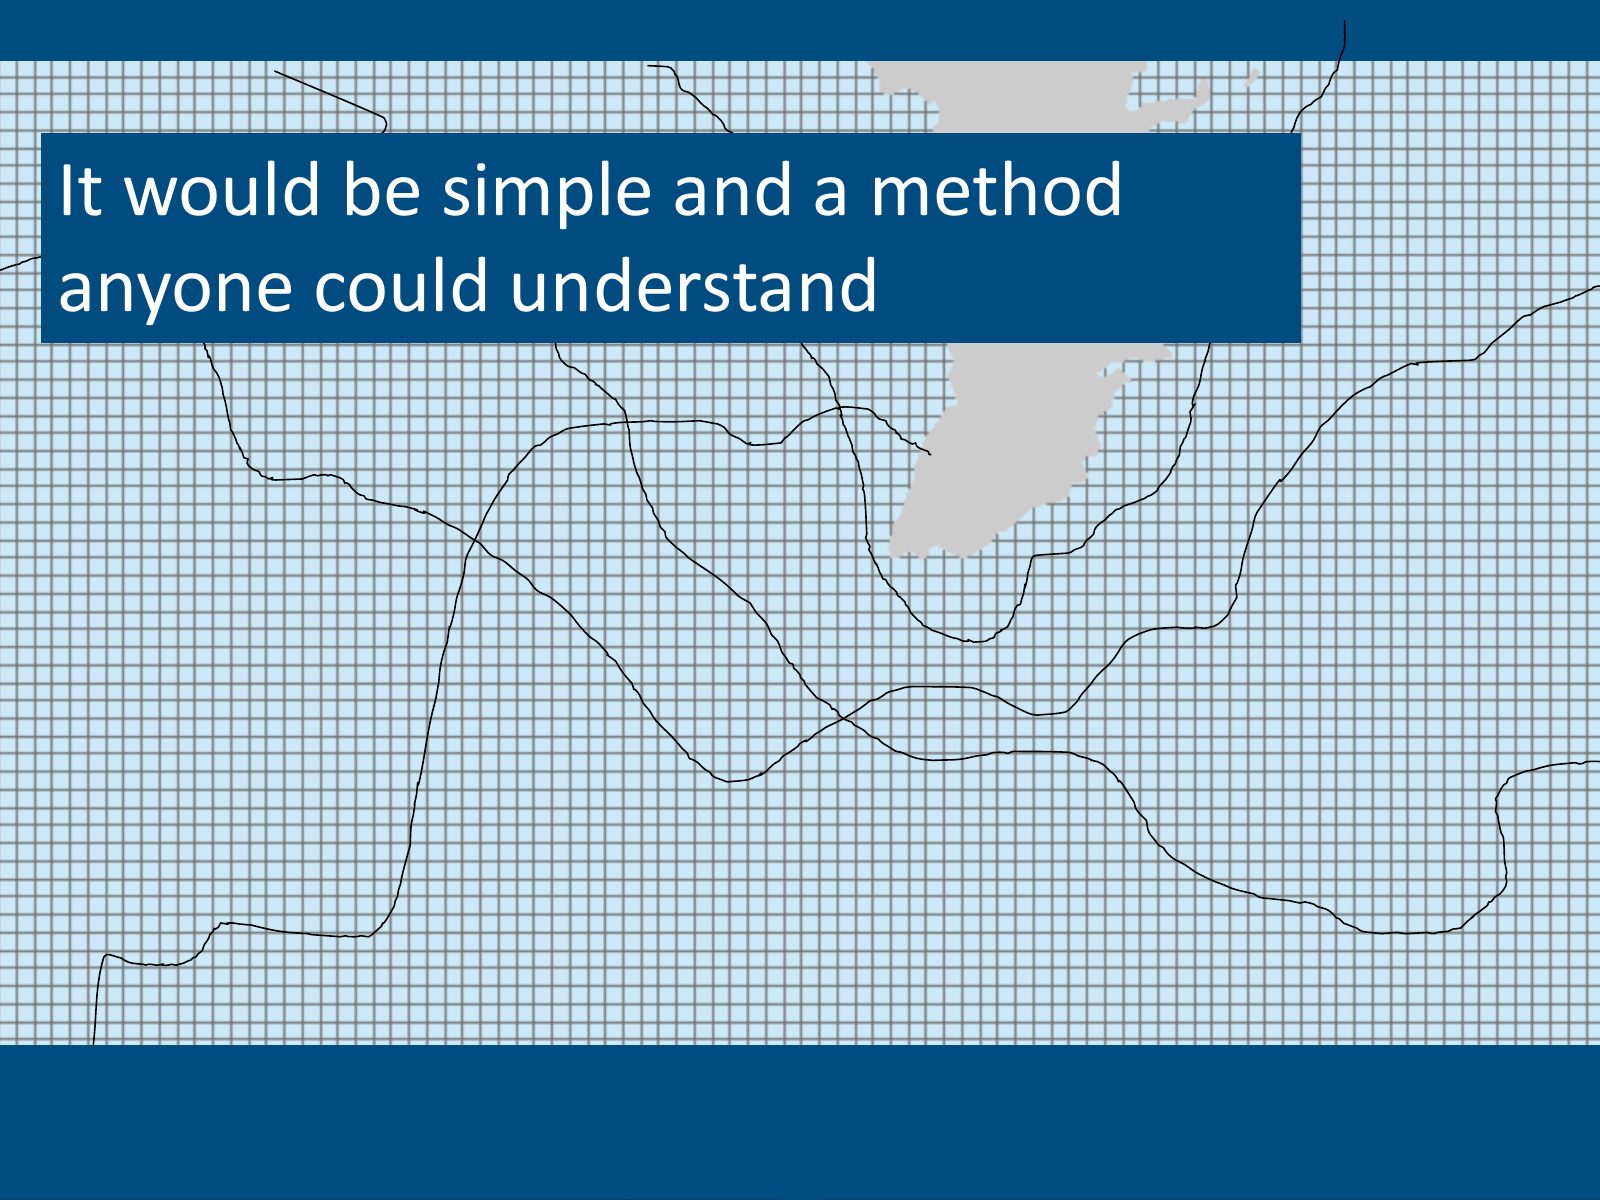
Slide 14 of 41: It would be simple and a method anyone could understand
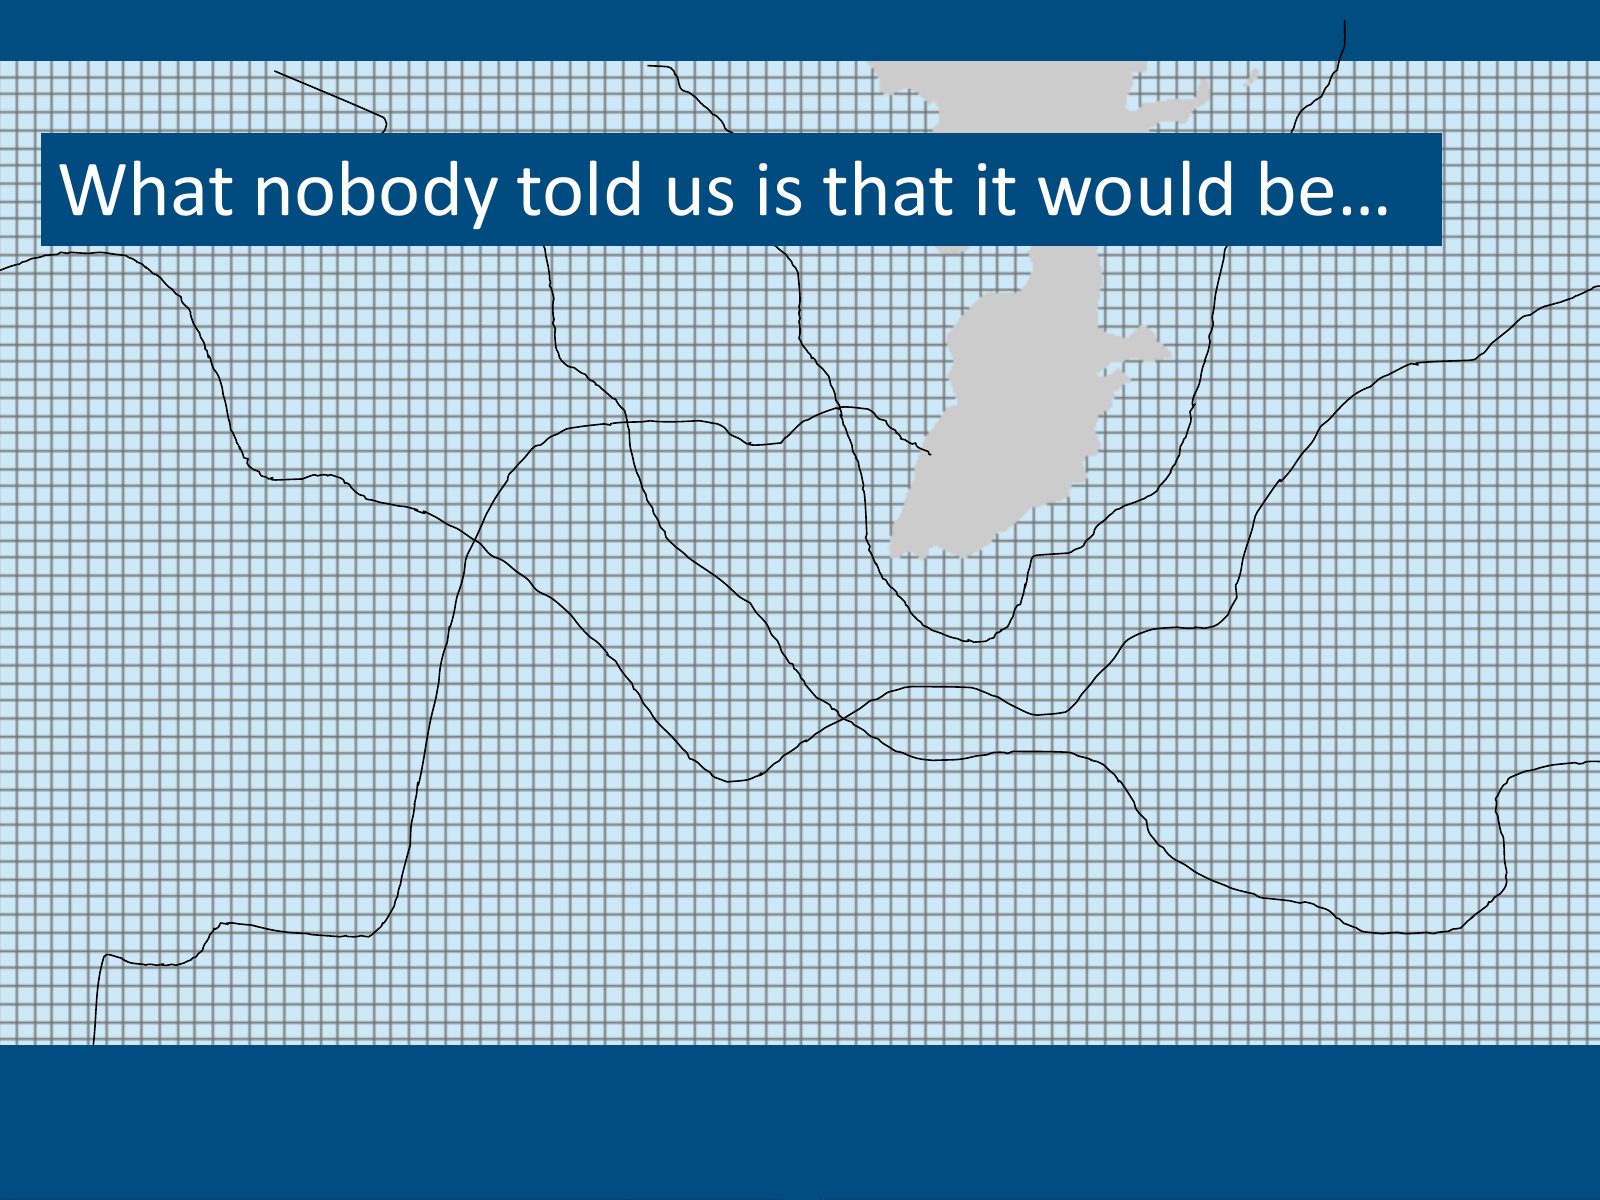
Slide 15 of 41: What nobody told us is that it would be…
Slide 16 of 41: …so difficult!!
Slide 17 of 41: After many, many, many trials we got it.

Slide 18 of 41: And we found out we needed three things
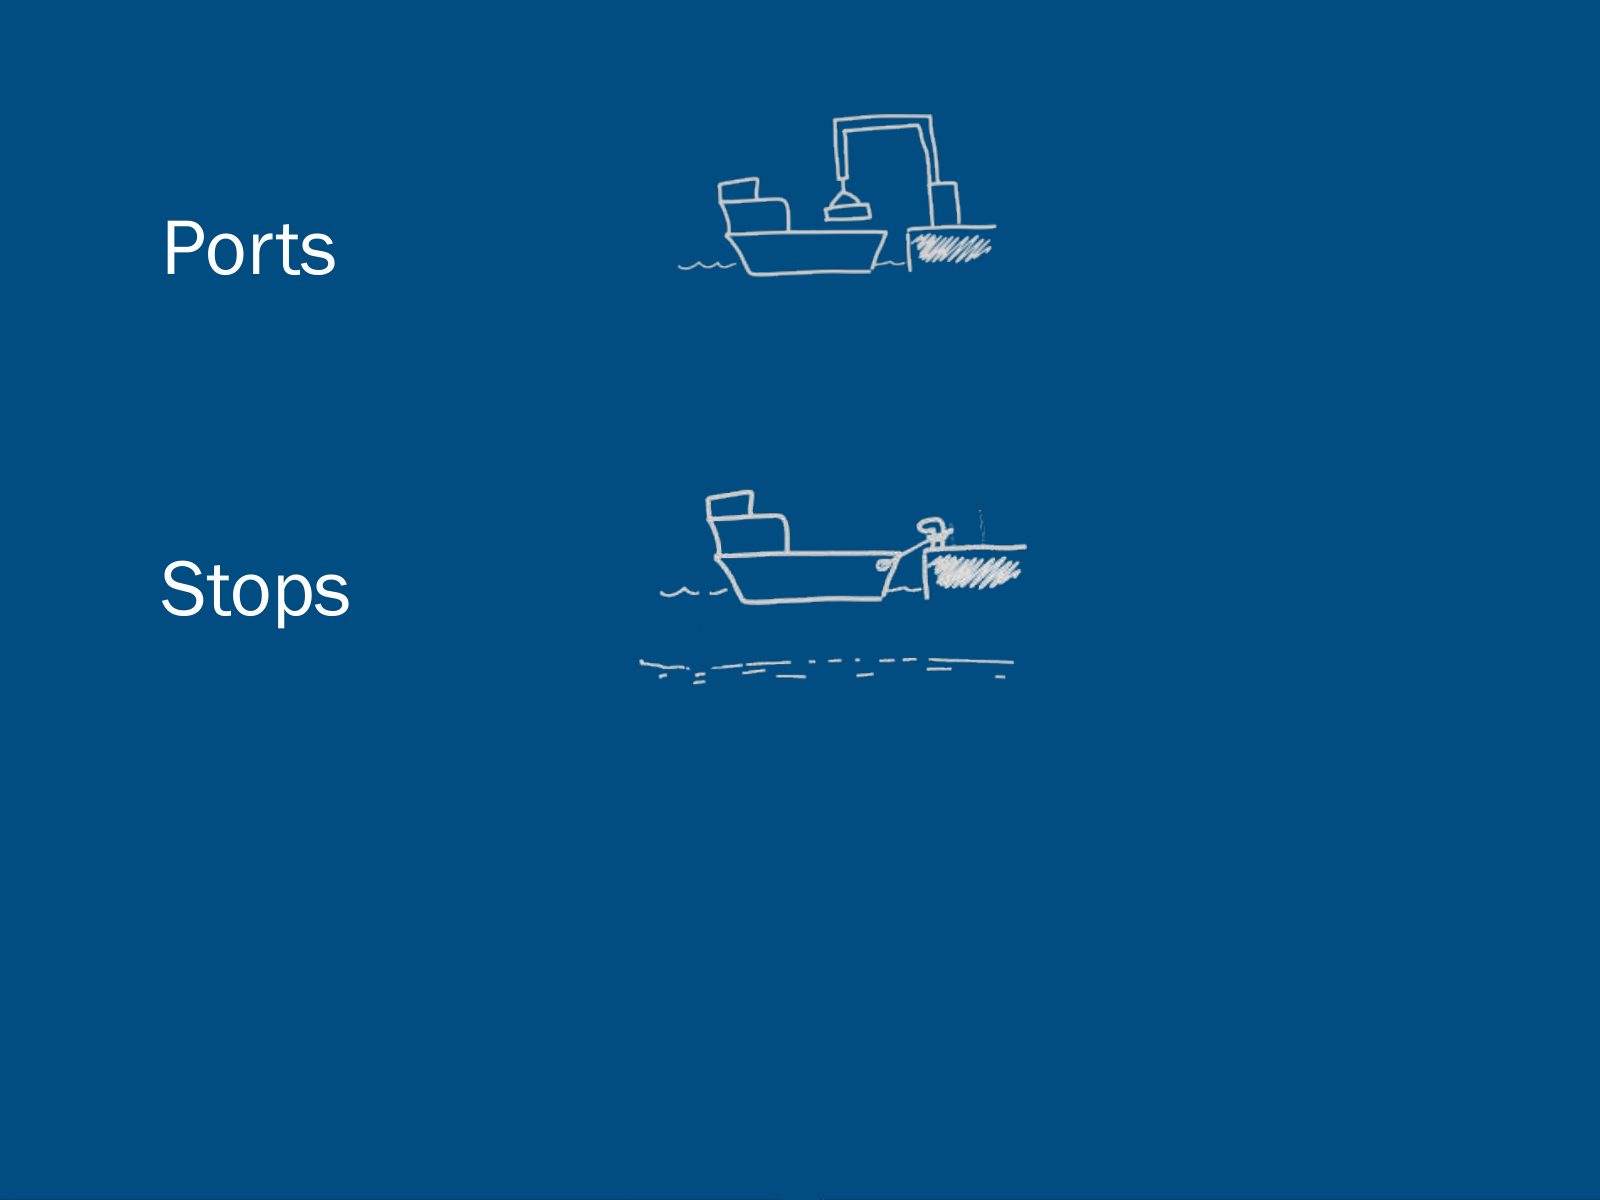
Slide 19 of 41: Ports
Slide 20 of 41: Ports Stops
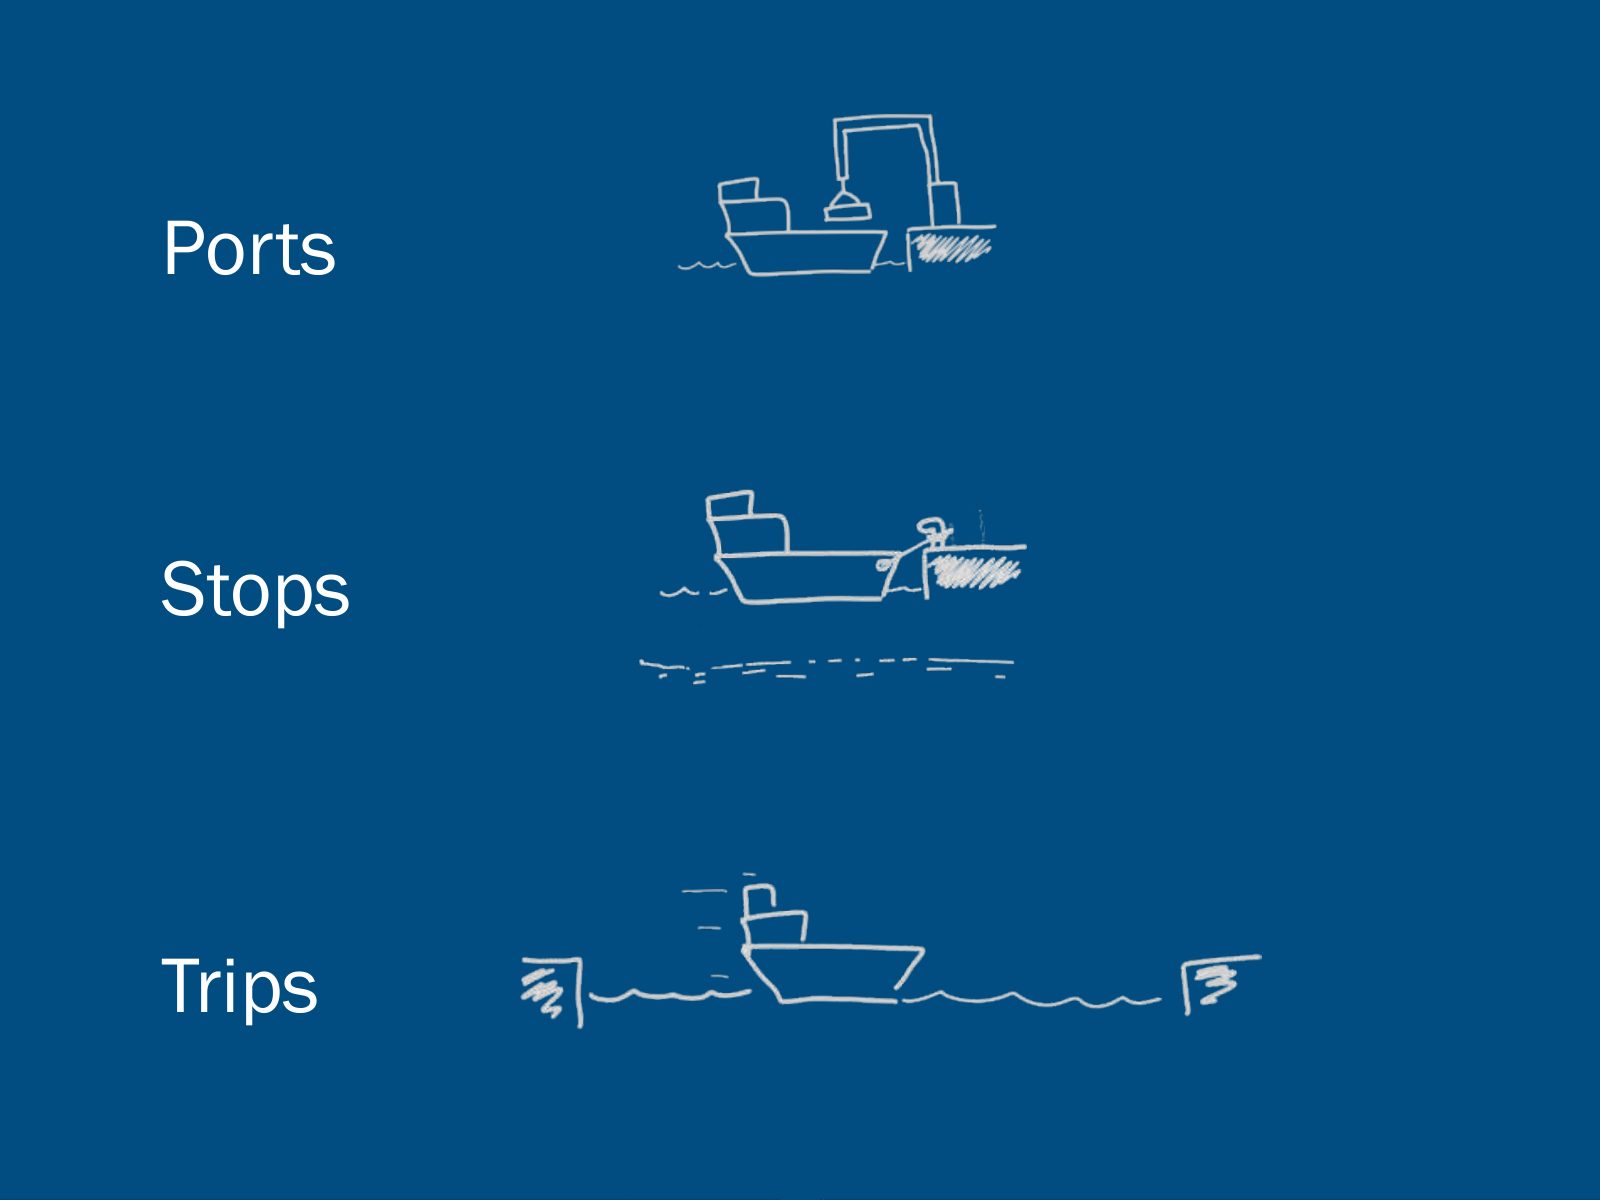
Slide 21 of 41: Ports Stops Trips
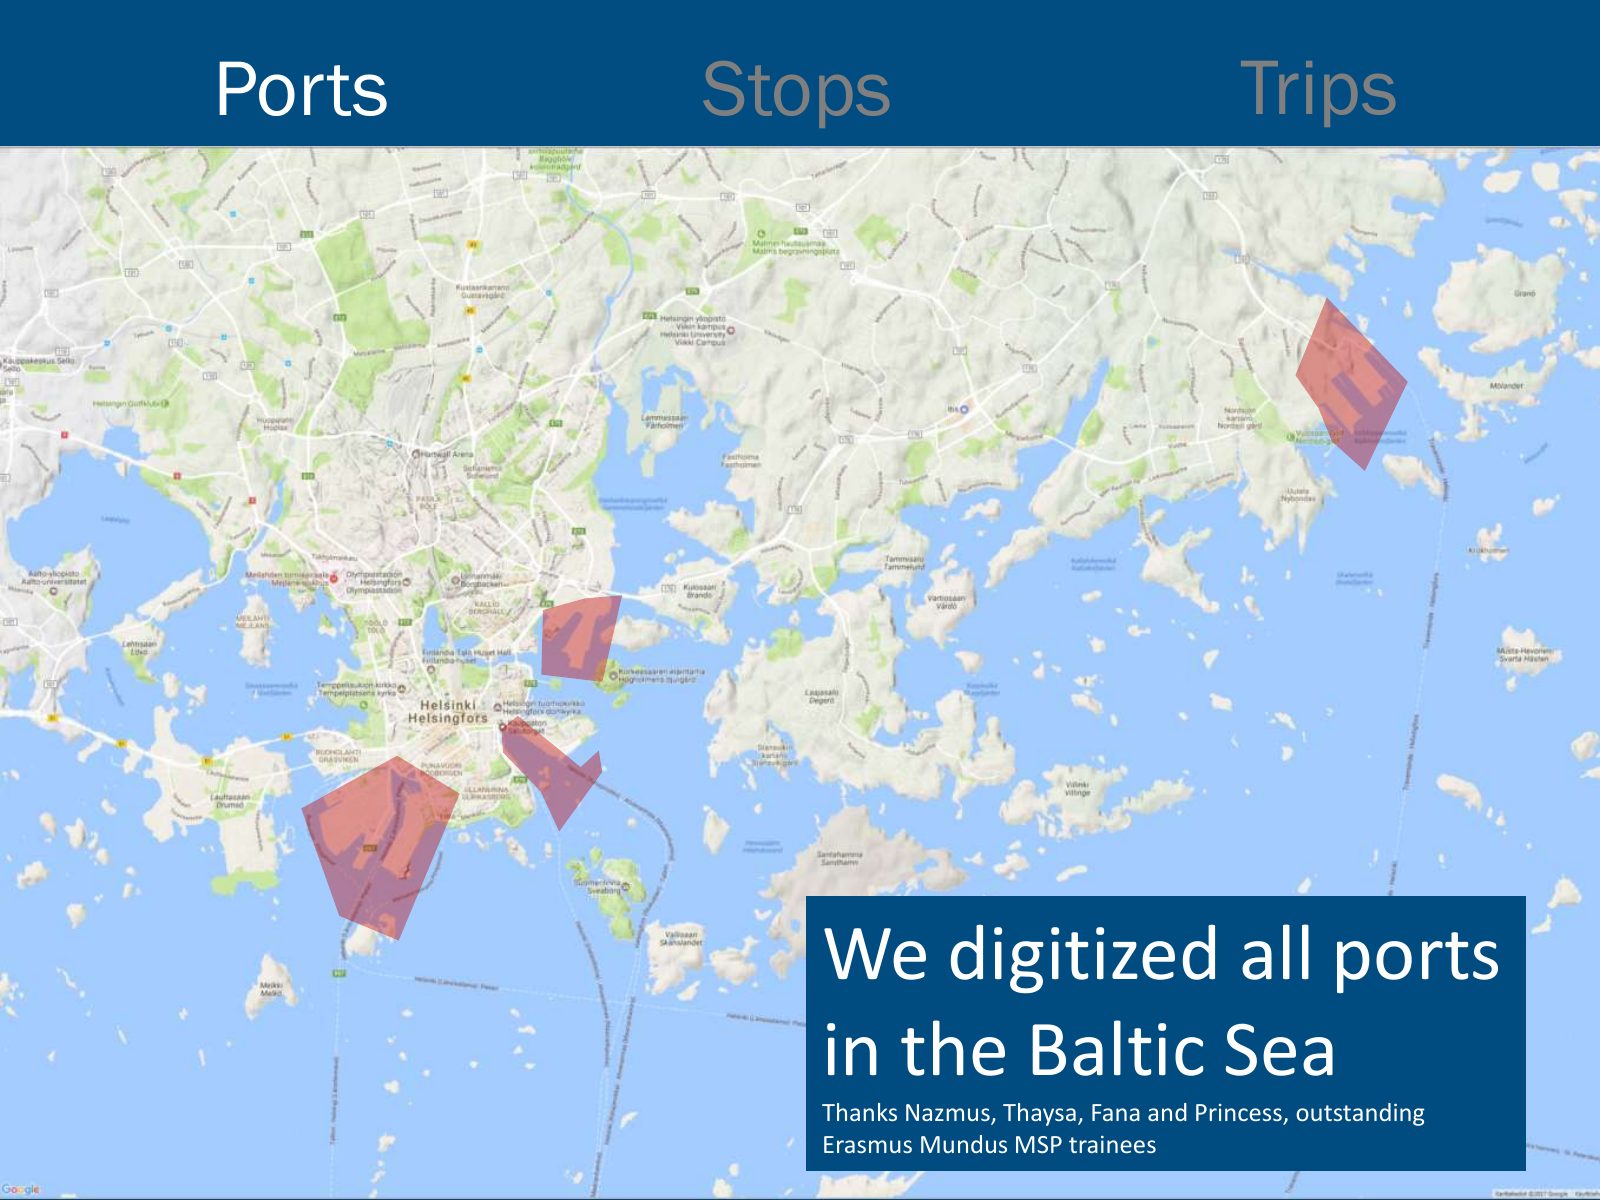
Slide 22 of 41: Ports Stops Trips We digitized all ports in the Baltic Sea Thanks Nazmus, Thaysa, Fana and Princess, outstanding Erasmus Mundus MSP trainees
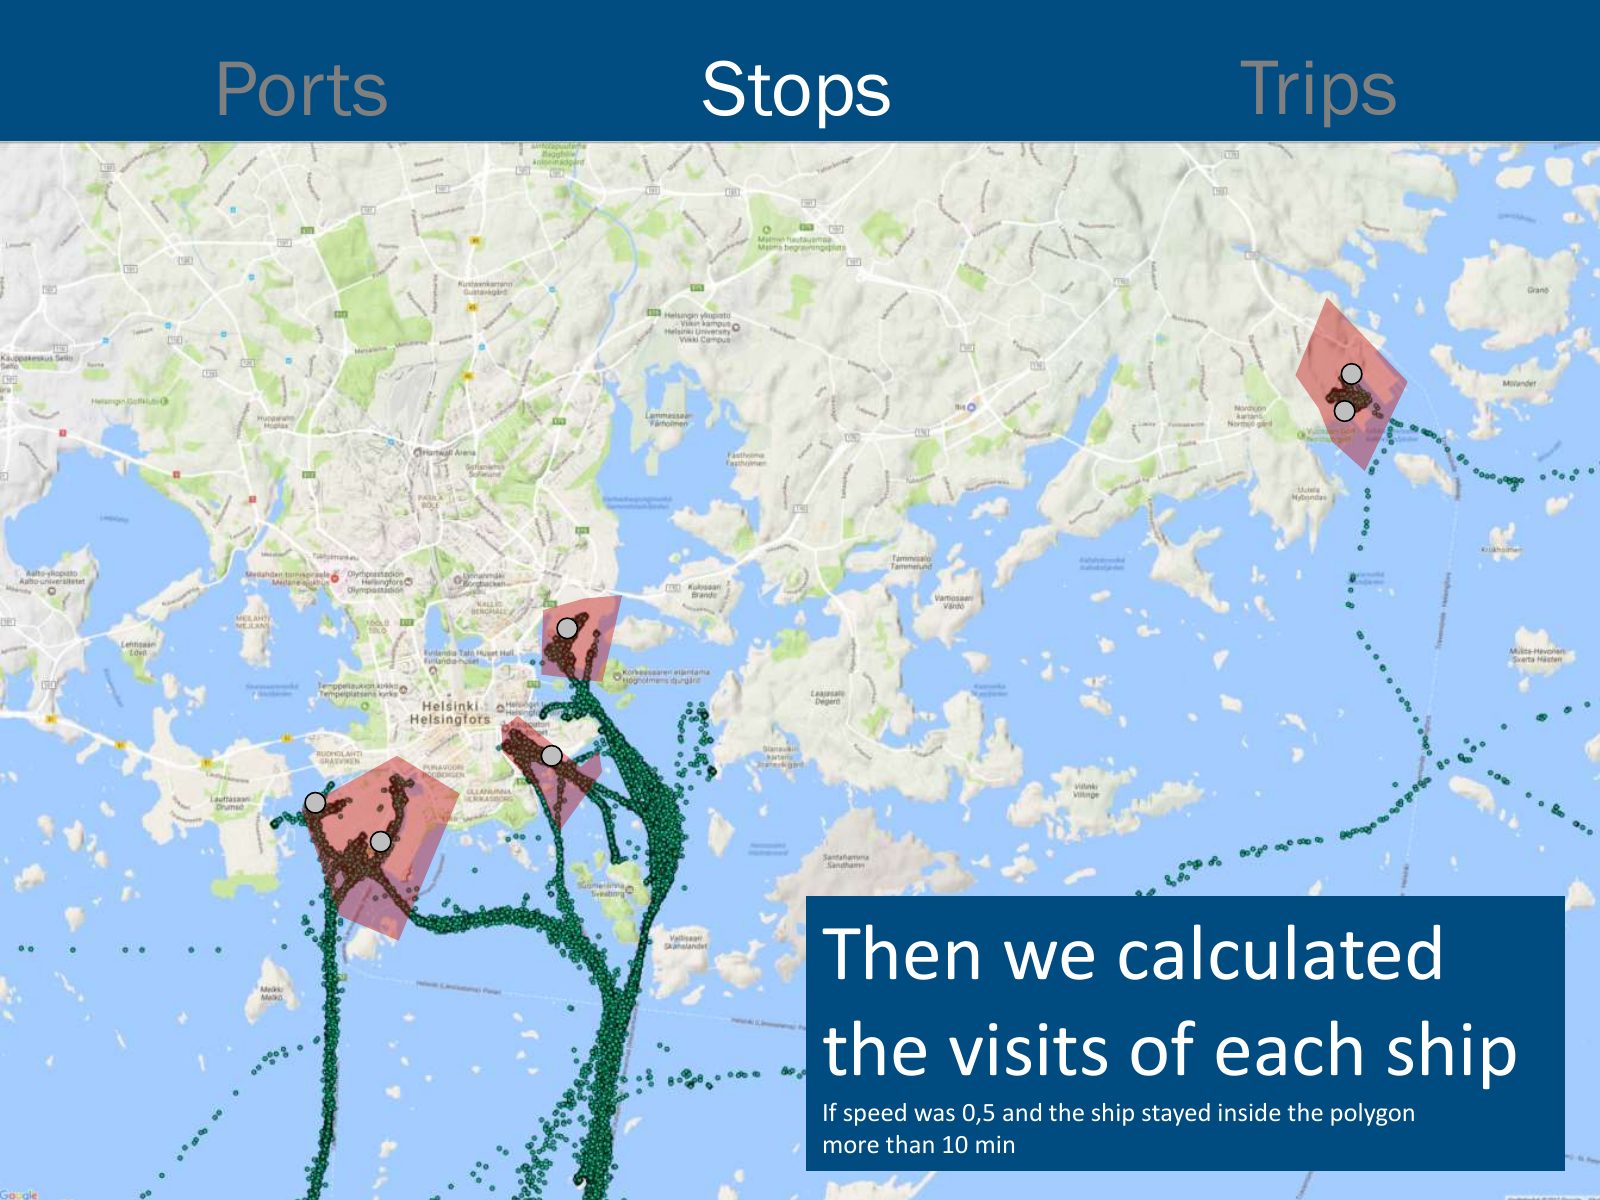
Slide 23 of 41: Ports Stops Trips Then we calculated the visits of each ship If speed was 0,5 and the ship stayed inside the polygon more than 10 min
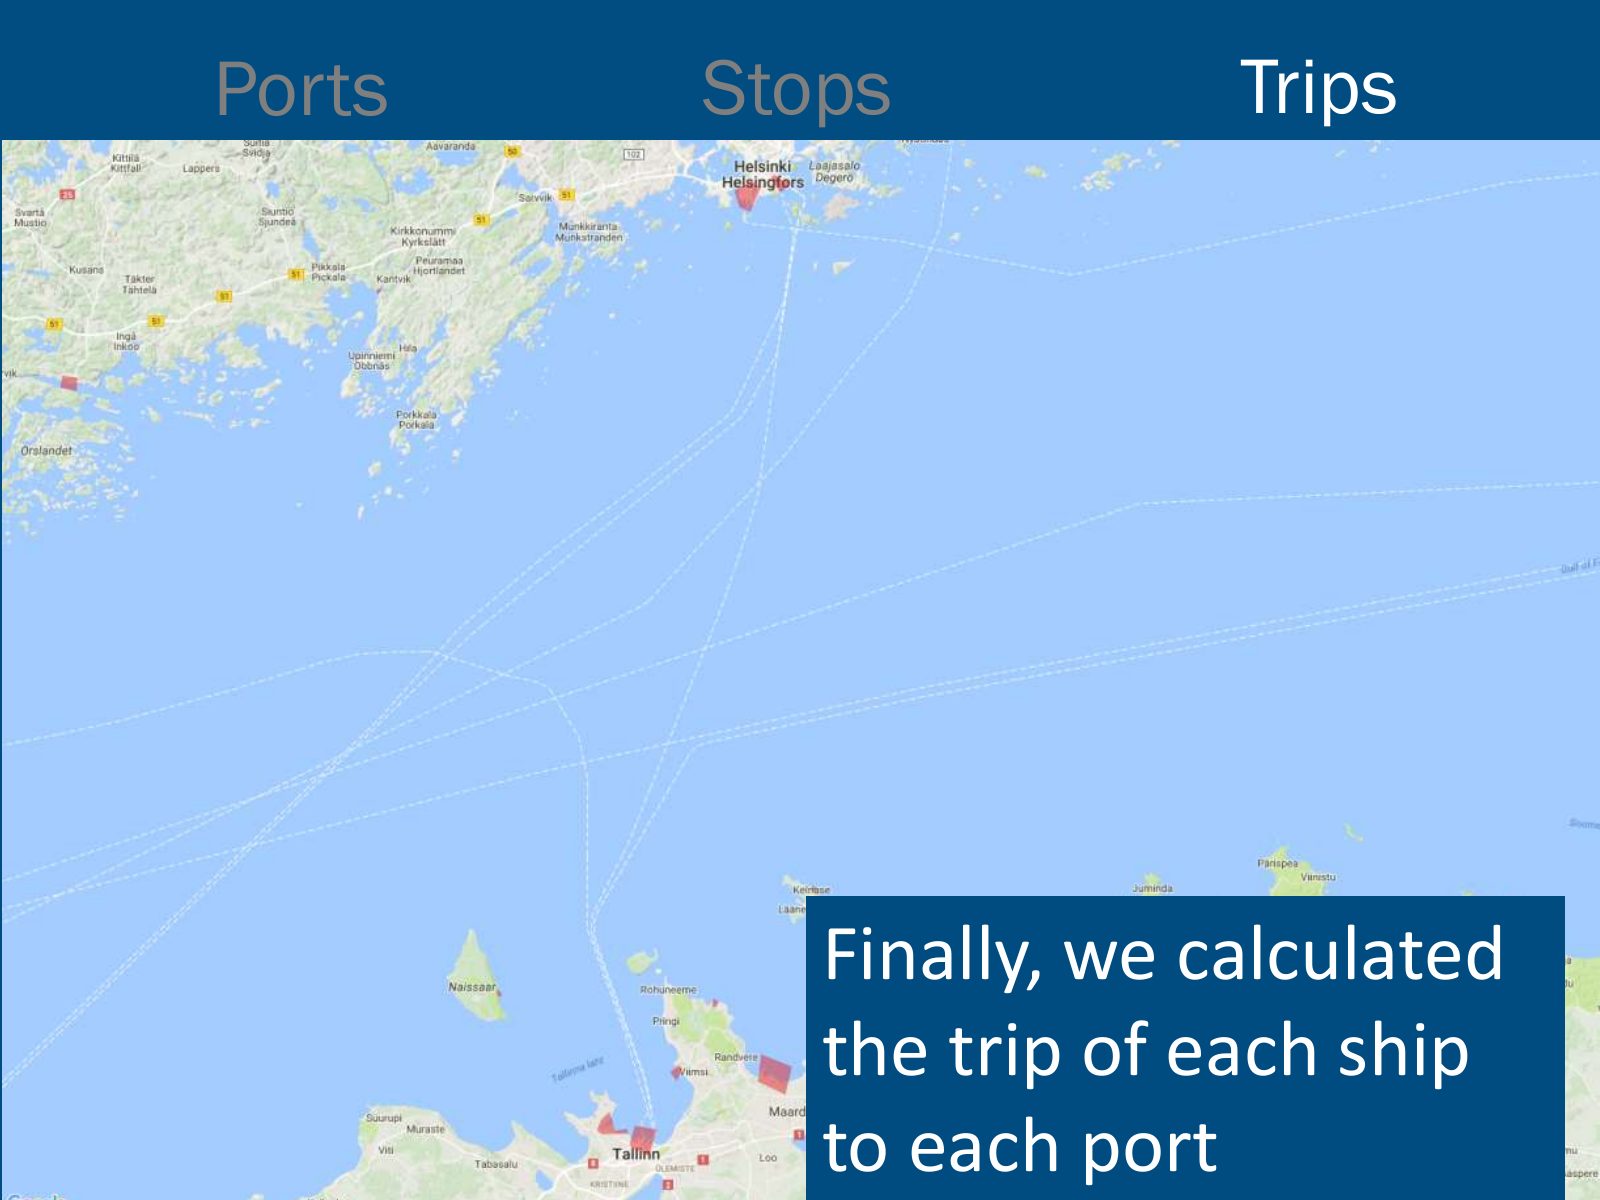
Slide 24 of 41: Ports Stops Trips Finally, we calculated the trip of each ship to each port
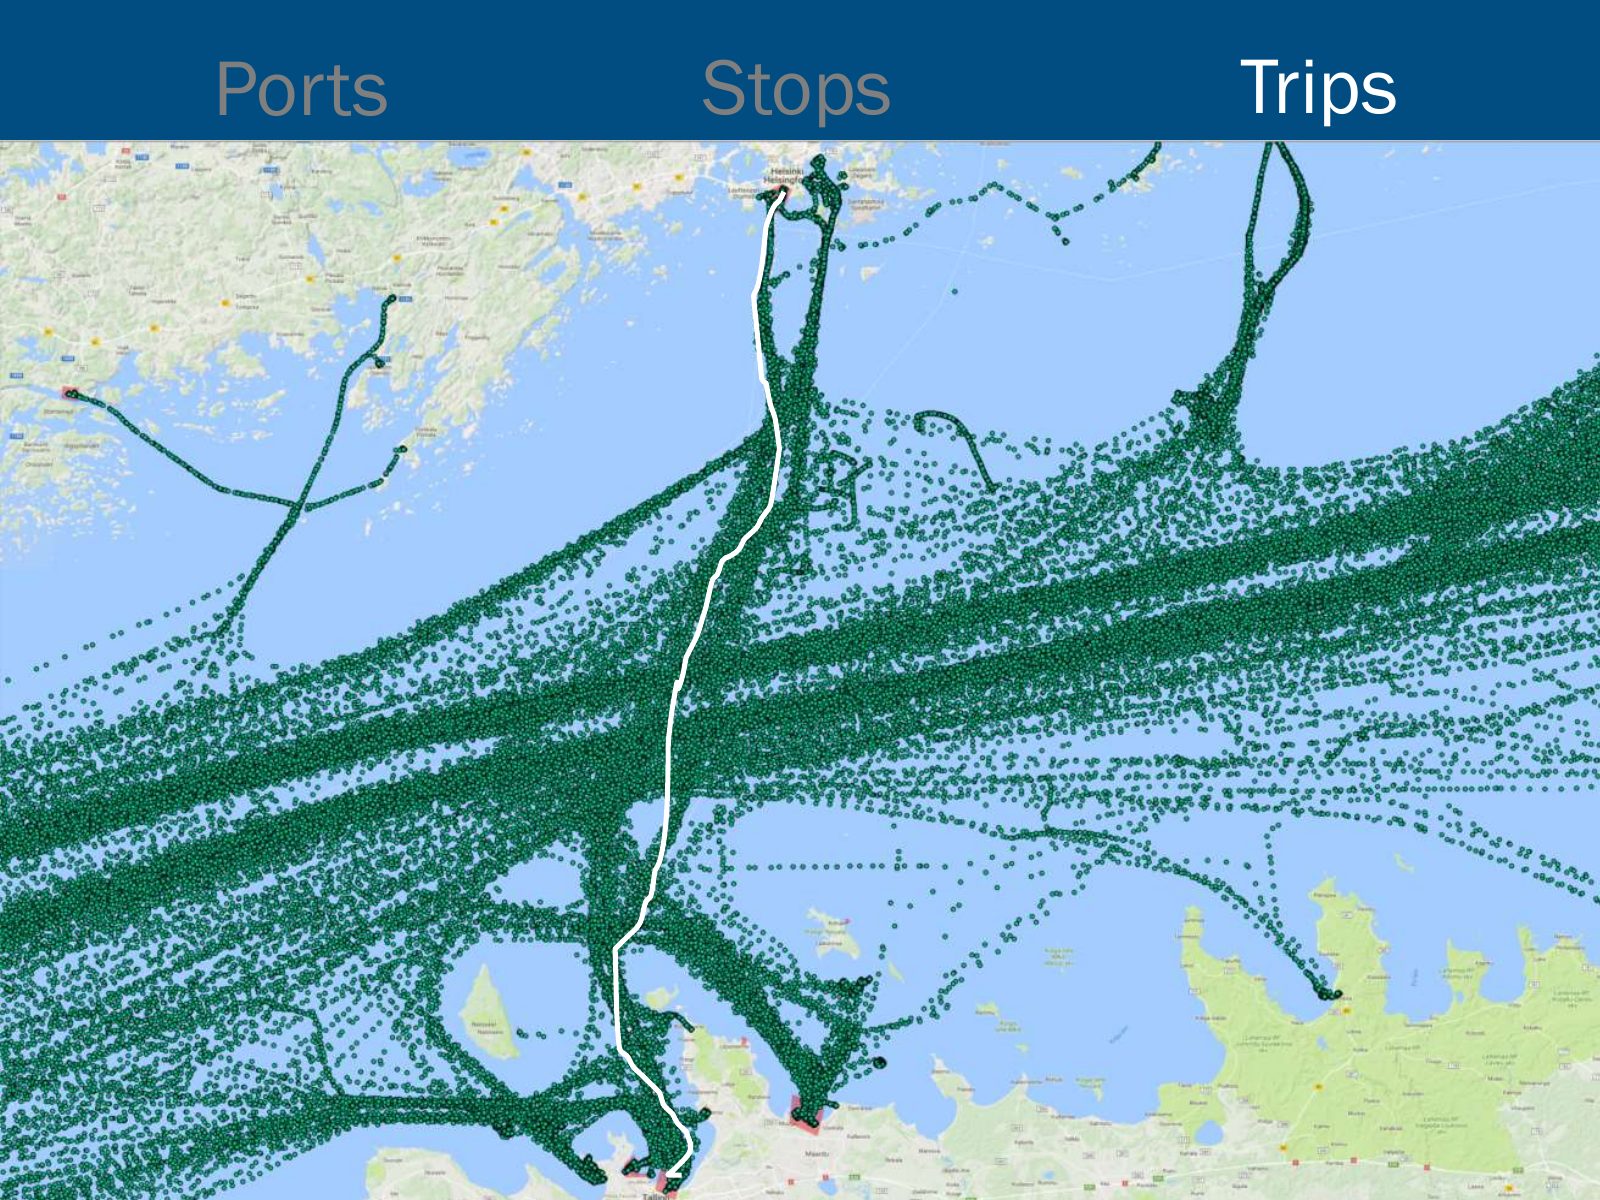
Slide 25 of 41: Ports Stops Trips
Slide 26 of 41: But that’s not all! The final step involves one more thing…
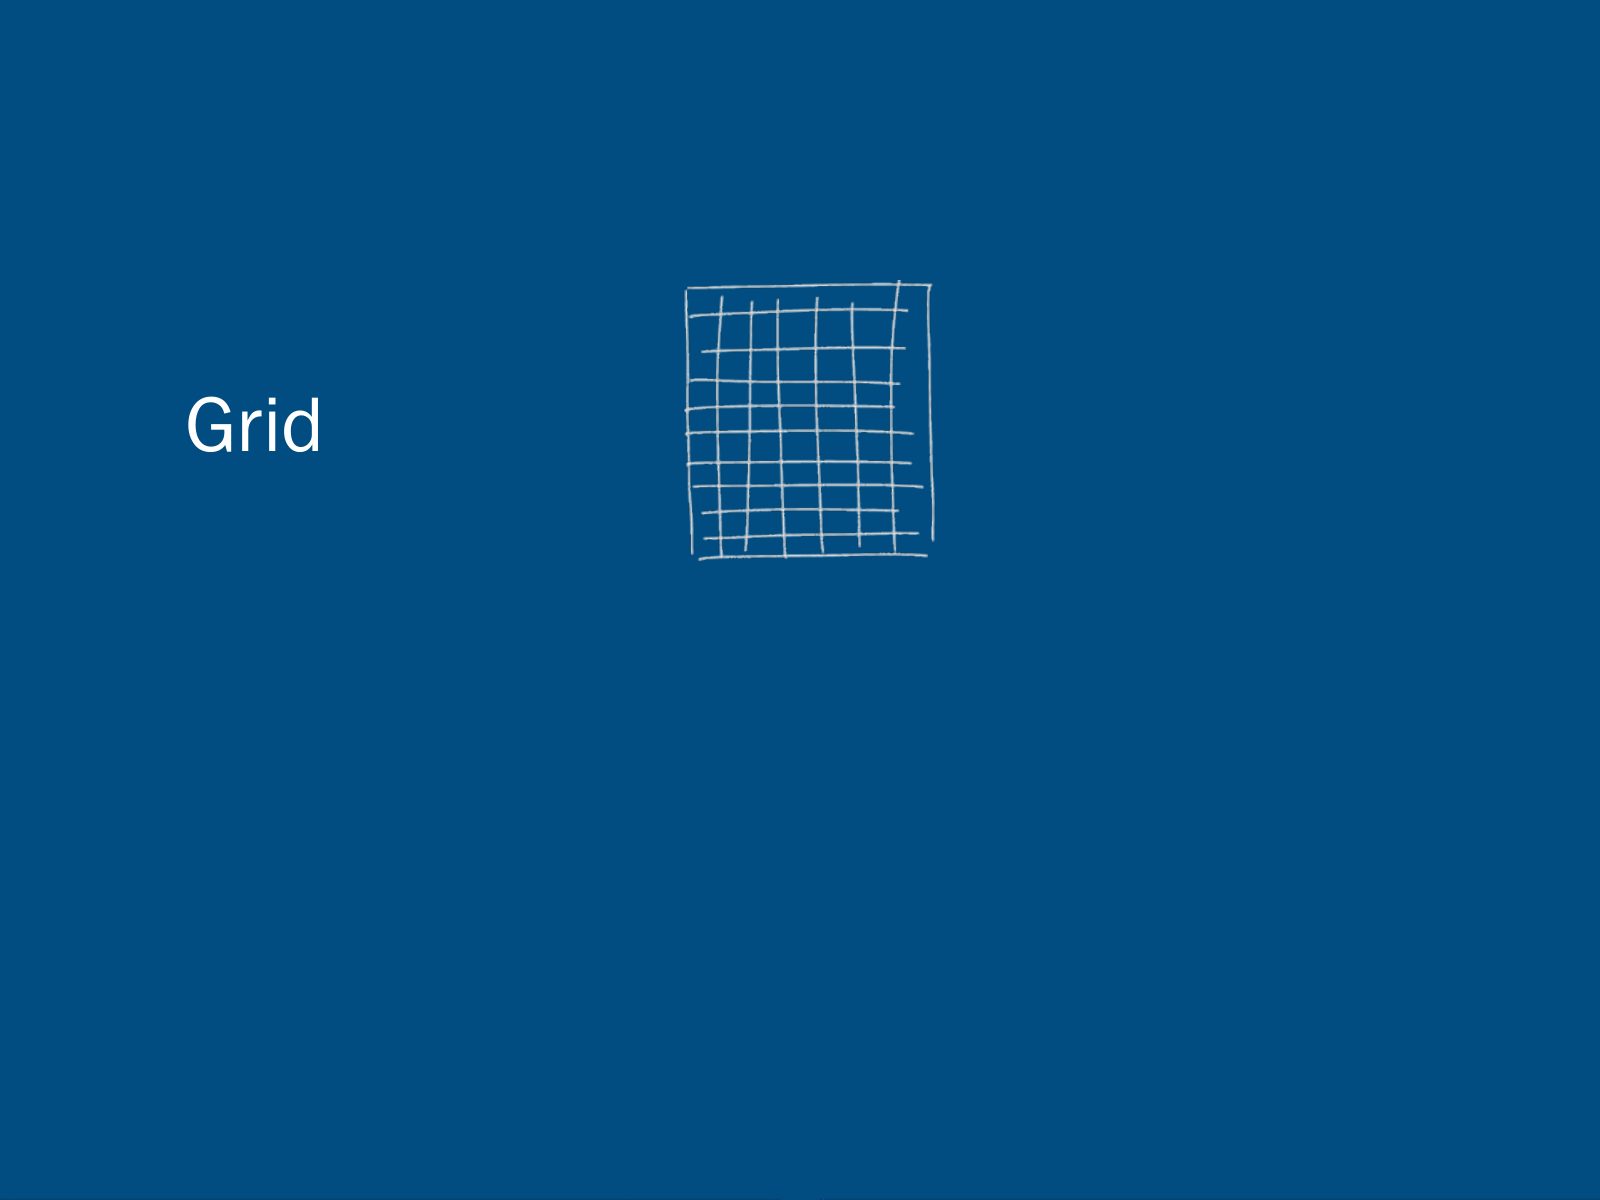
Slide 27 of 41: Grid
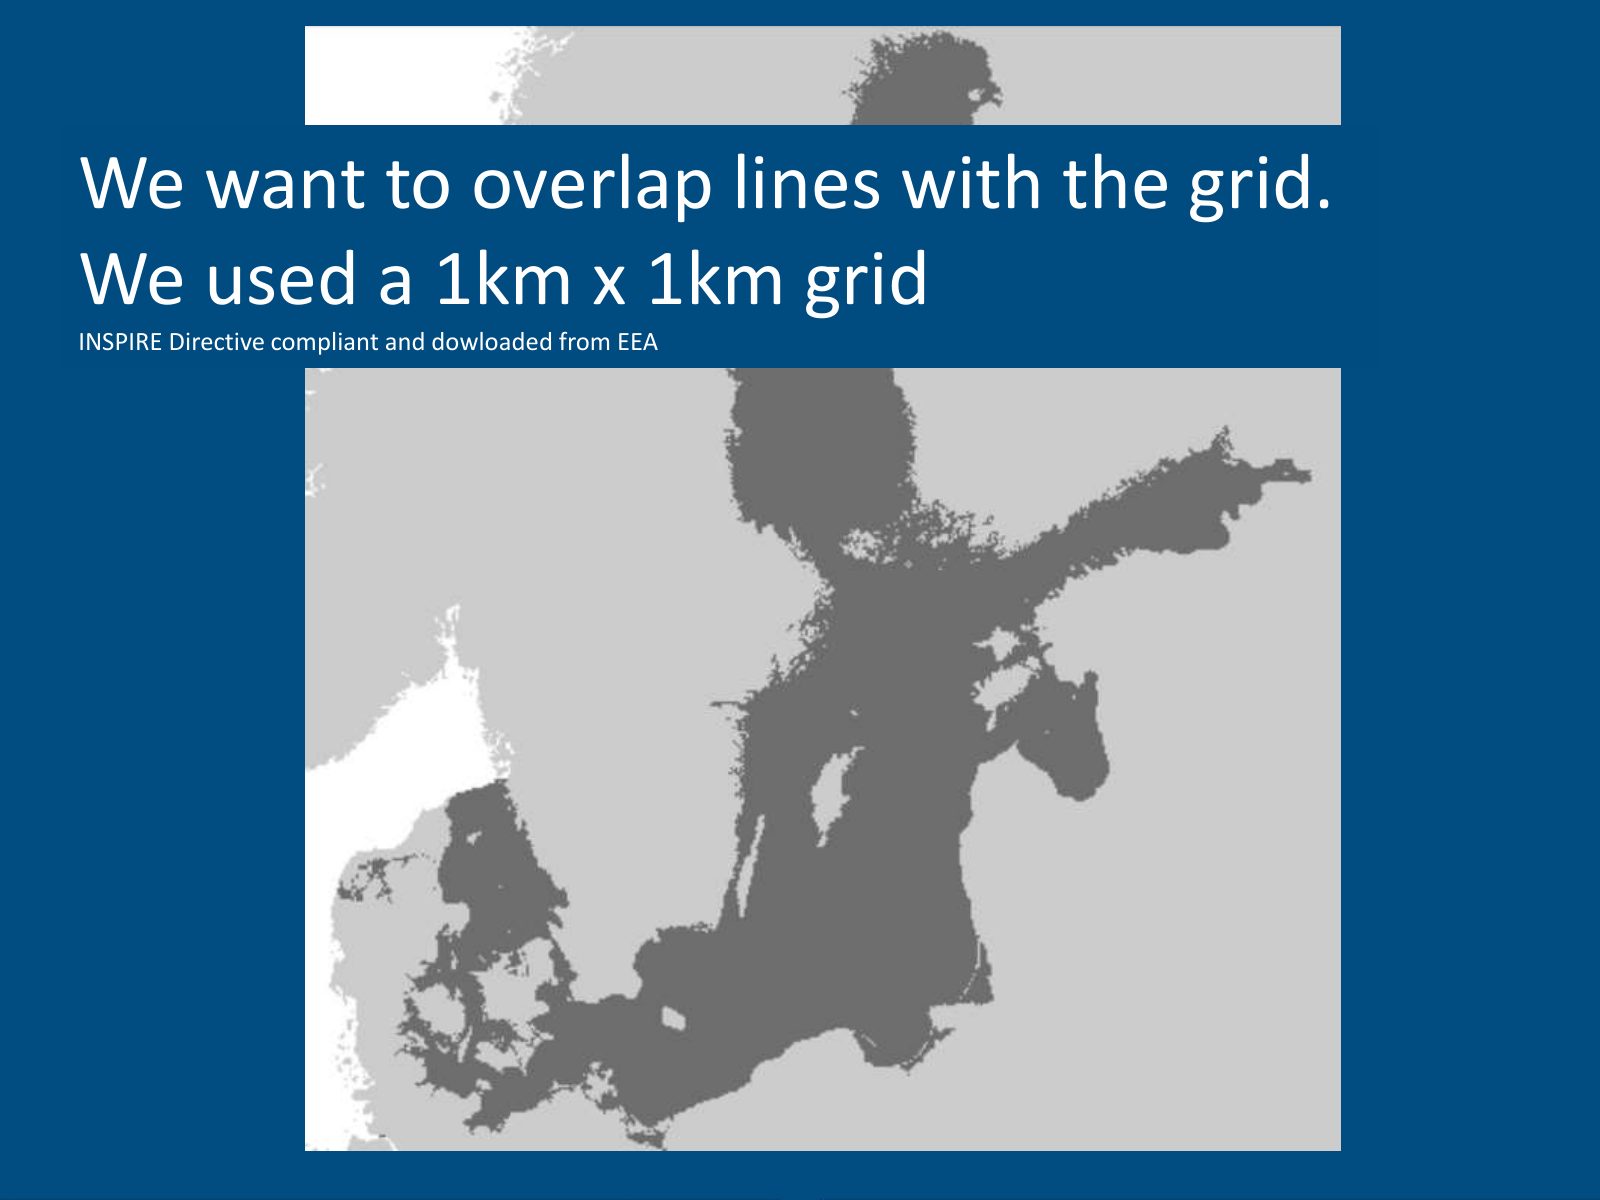
Slide 28 of 41: We want to overlap lines with the grid. We used a 1km x 1km grid INSPIRE Directive compliant and dowloaded from EEA
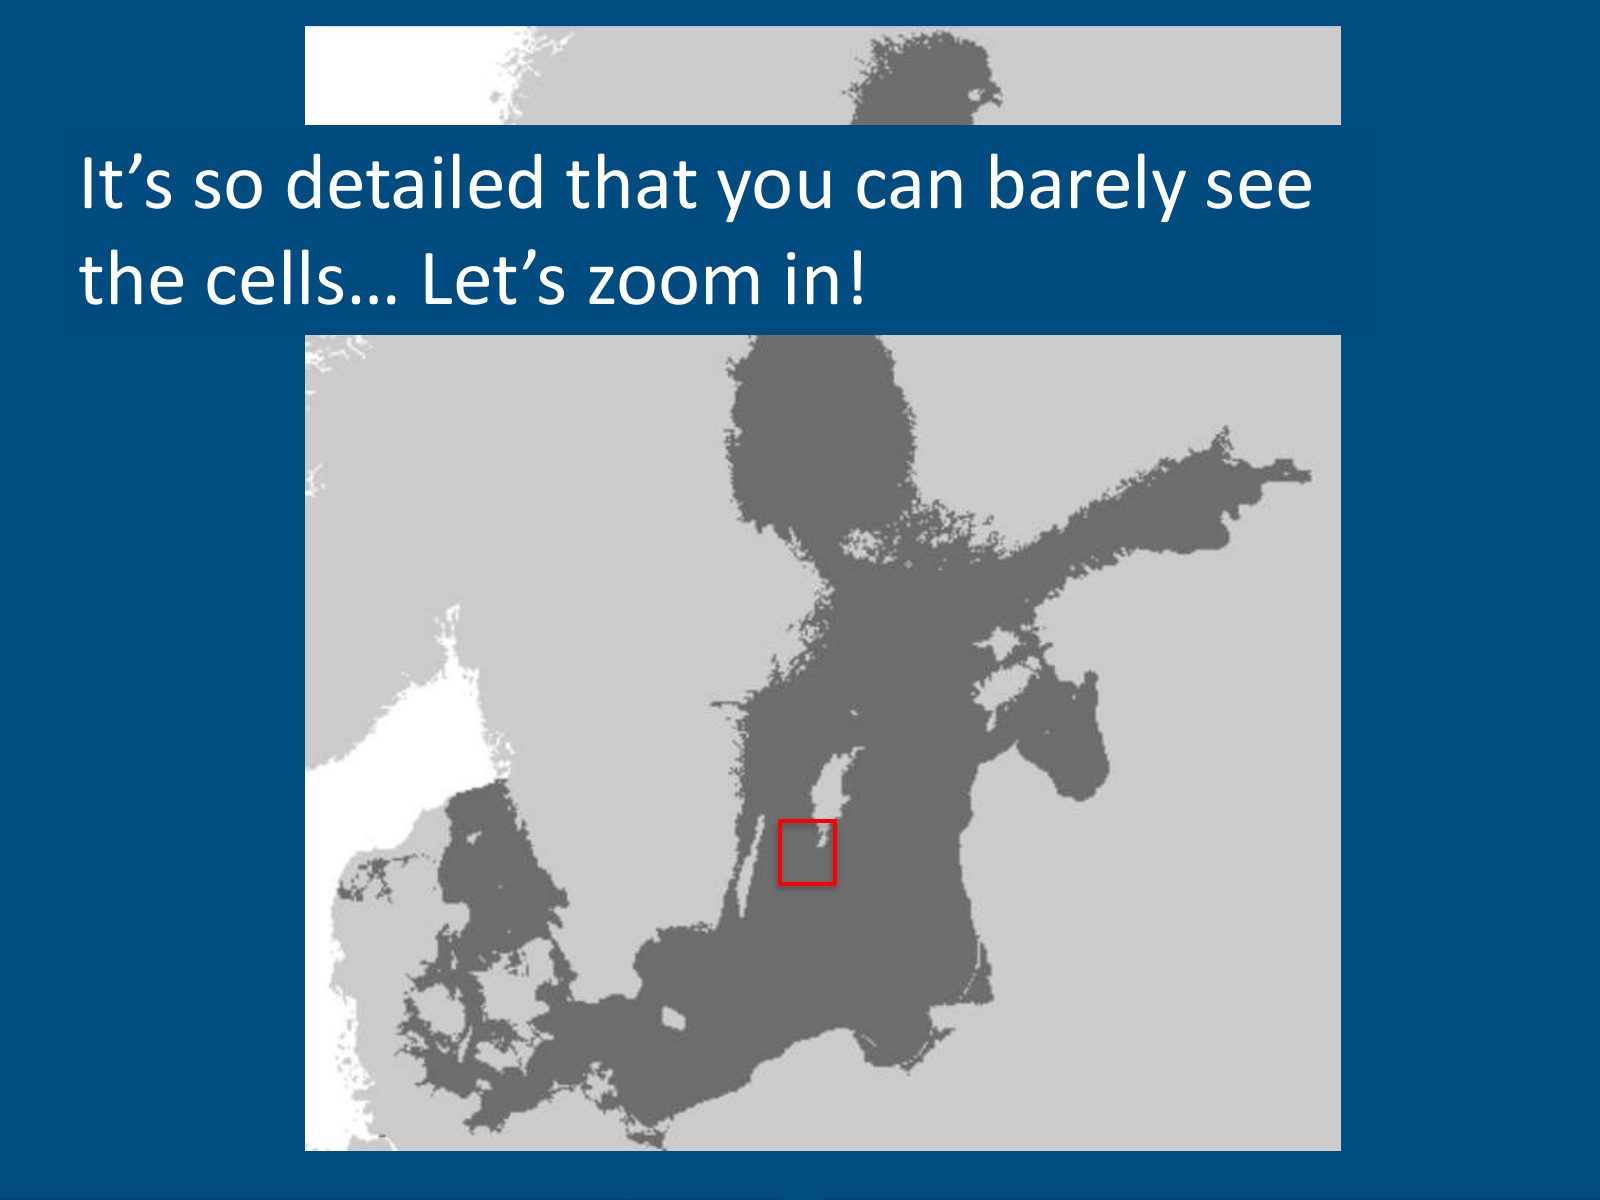
Slide 29 of 41: It’s so detailed that you can barely see the cells… Let’s zoom in!
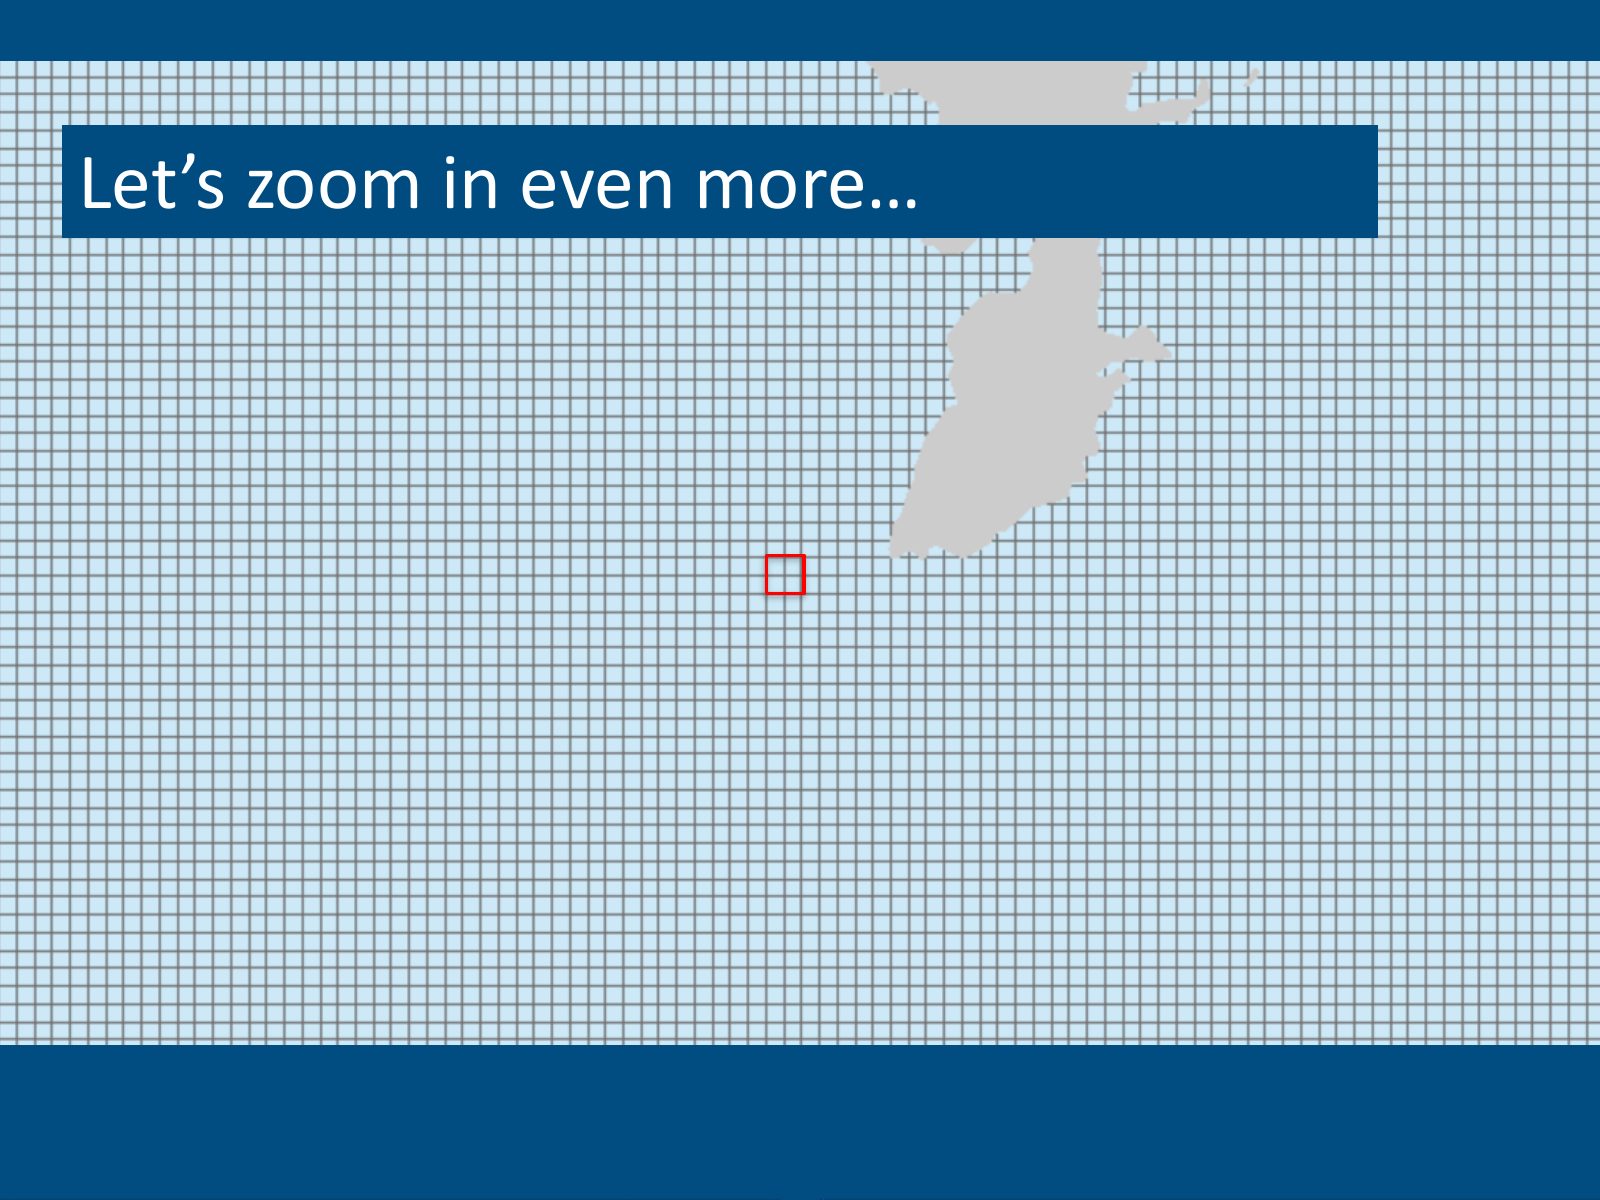
Slide 30 of 41: Let’s zoom in even more…
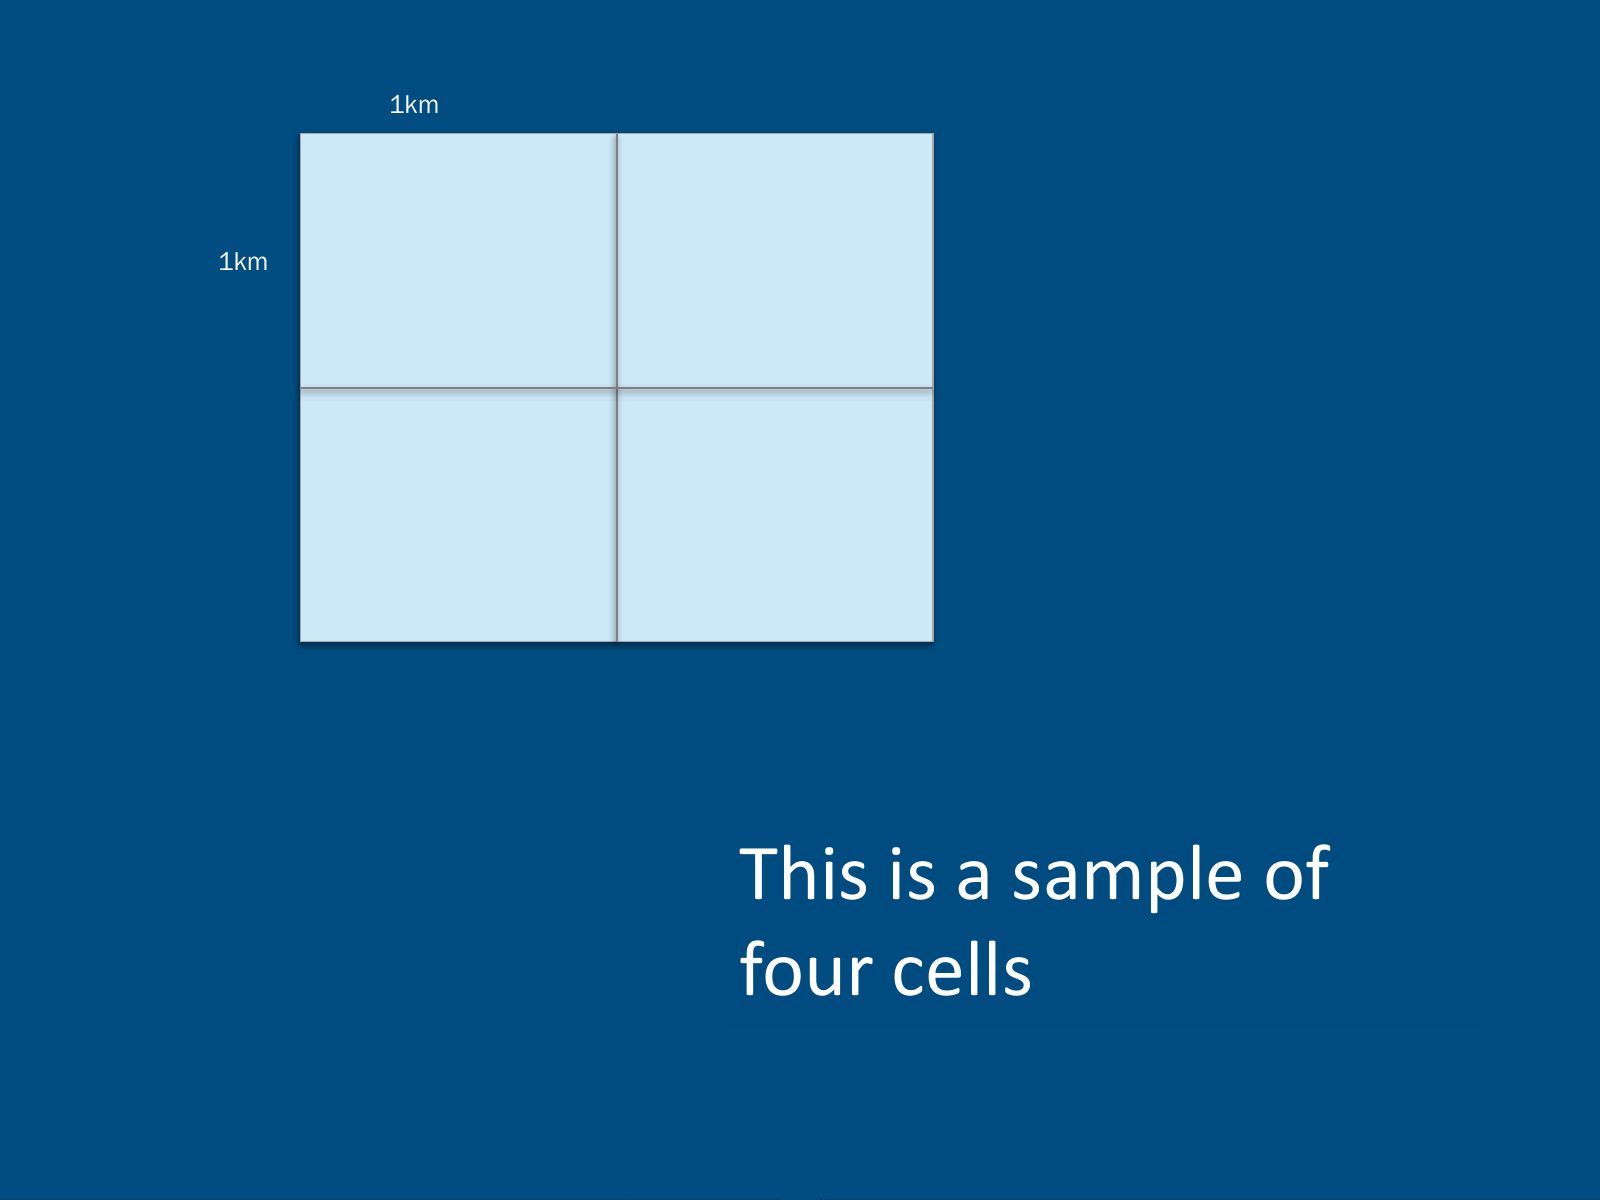
Slide 31 of 41: 1km 1km This is a sample of four cells
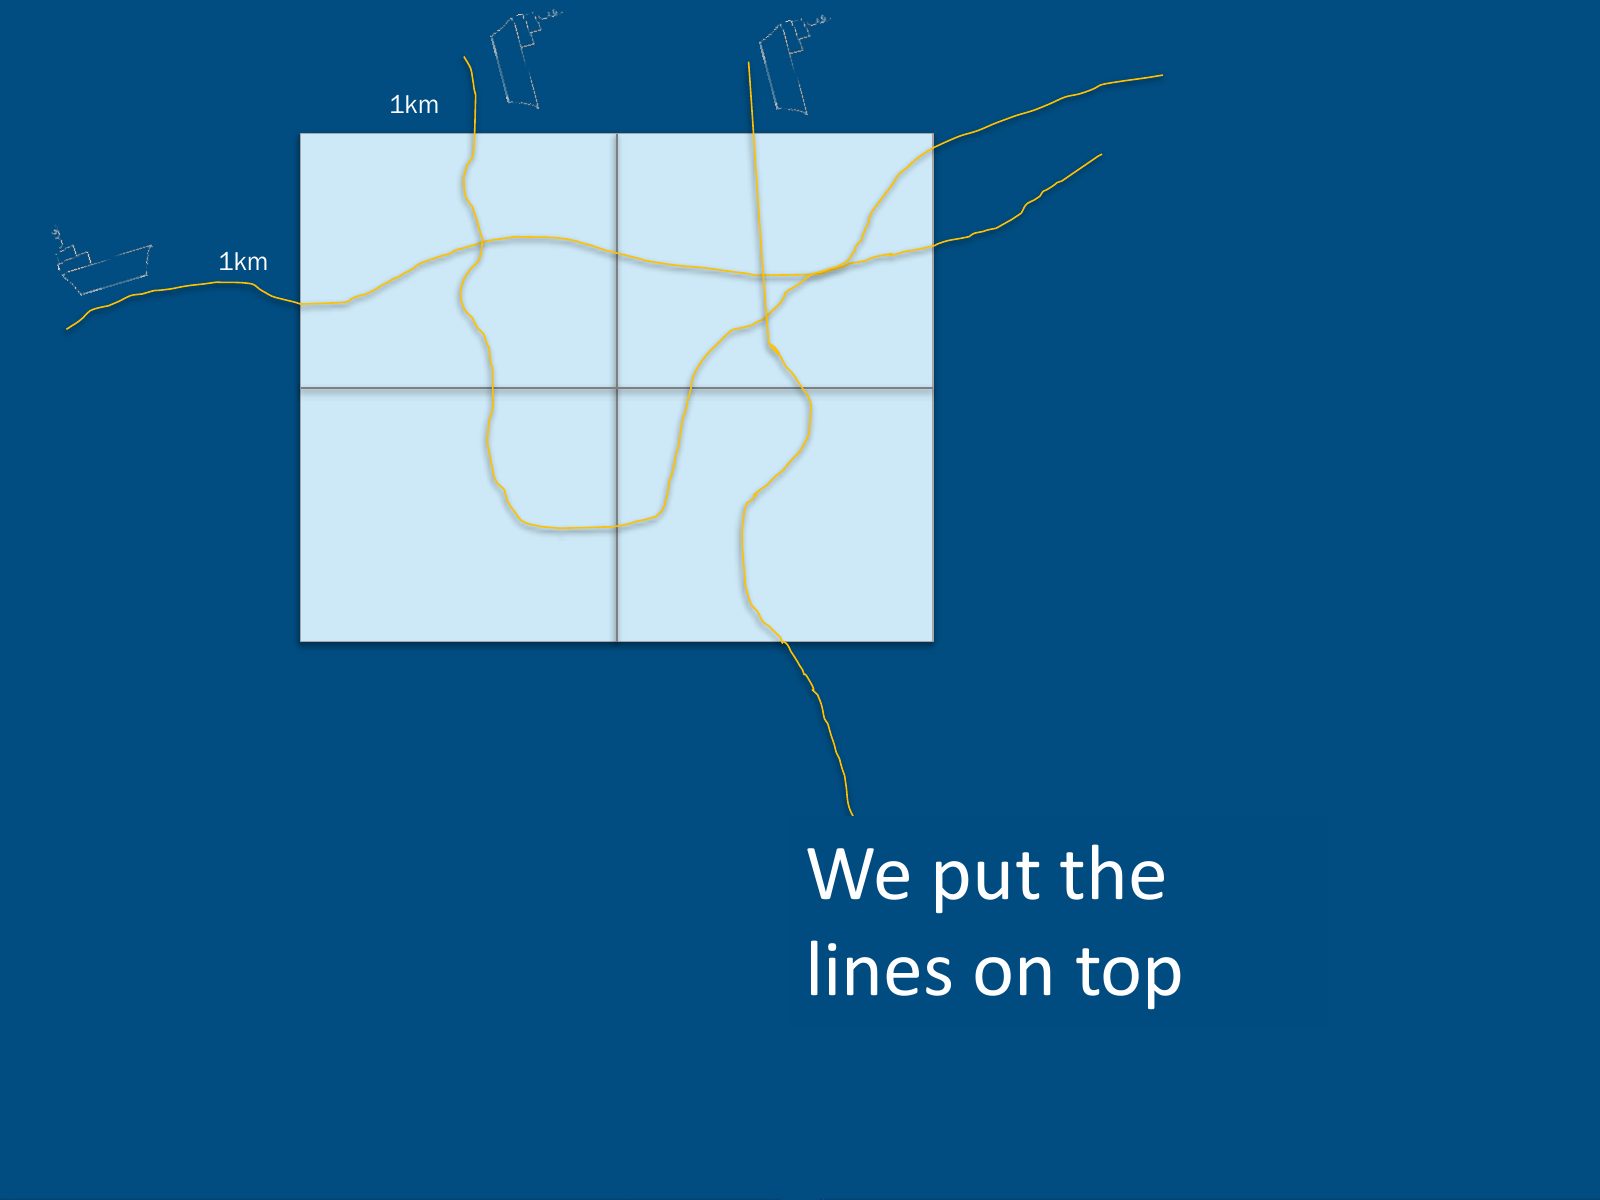
Slide 32 of 41: 1km 1km We put the lines on top
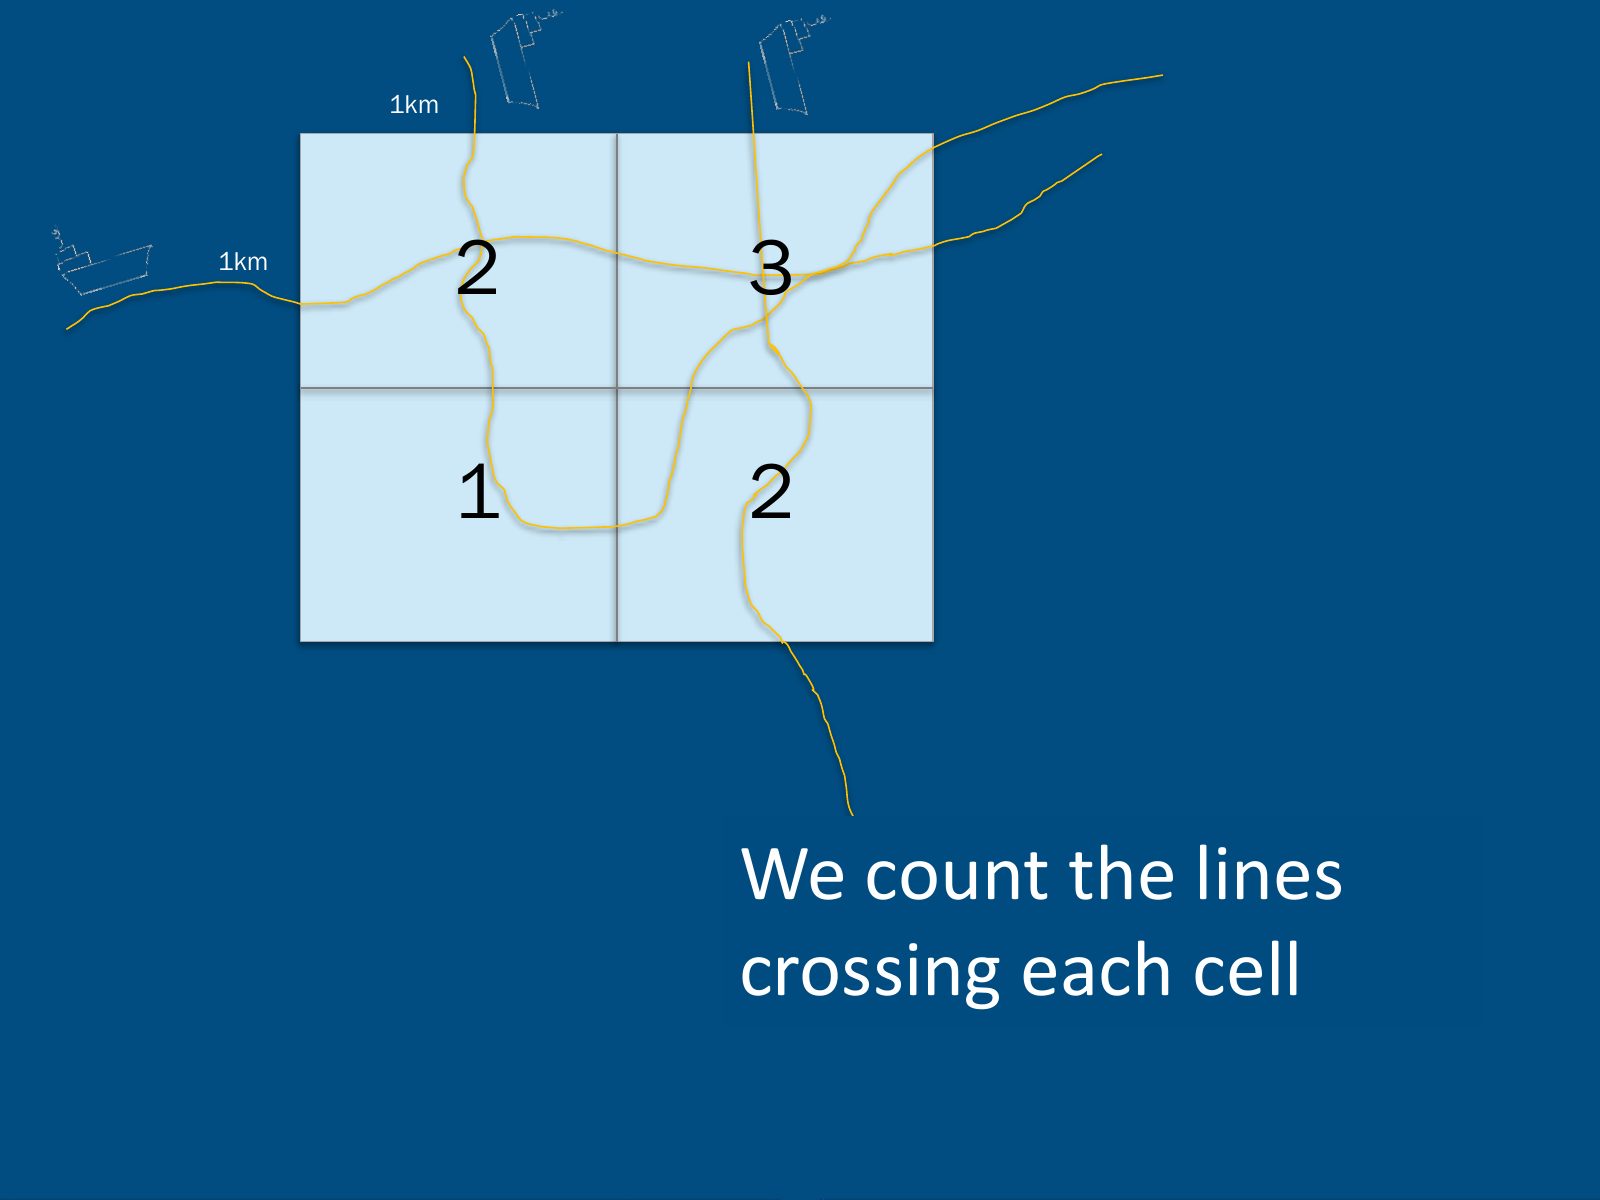
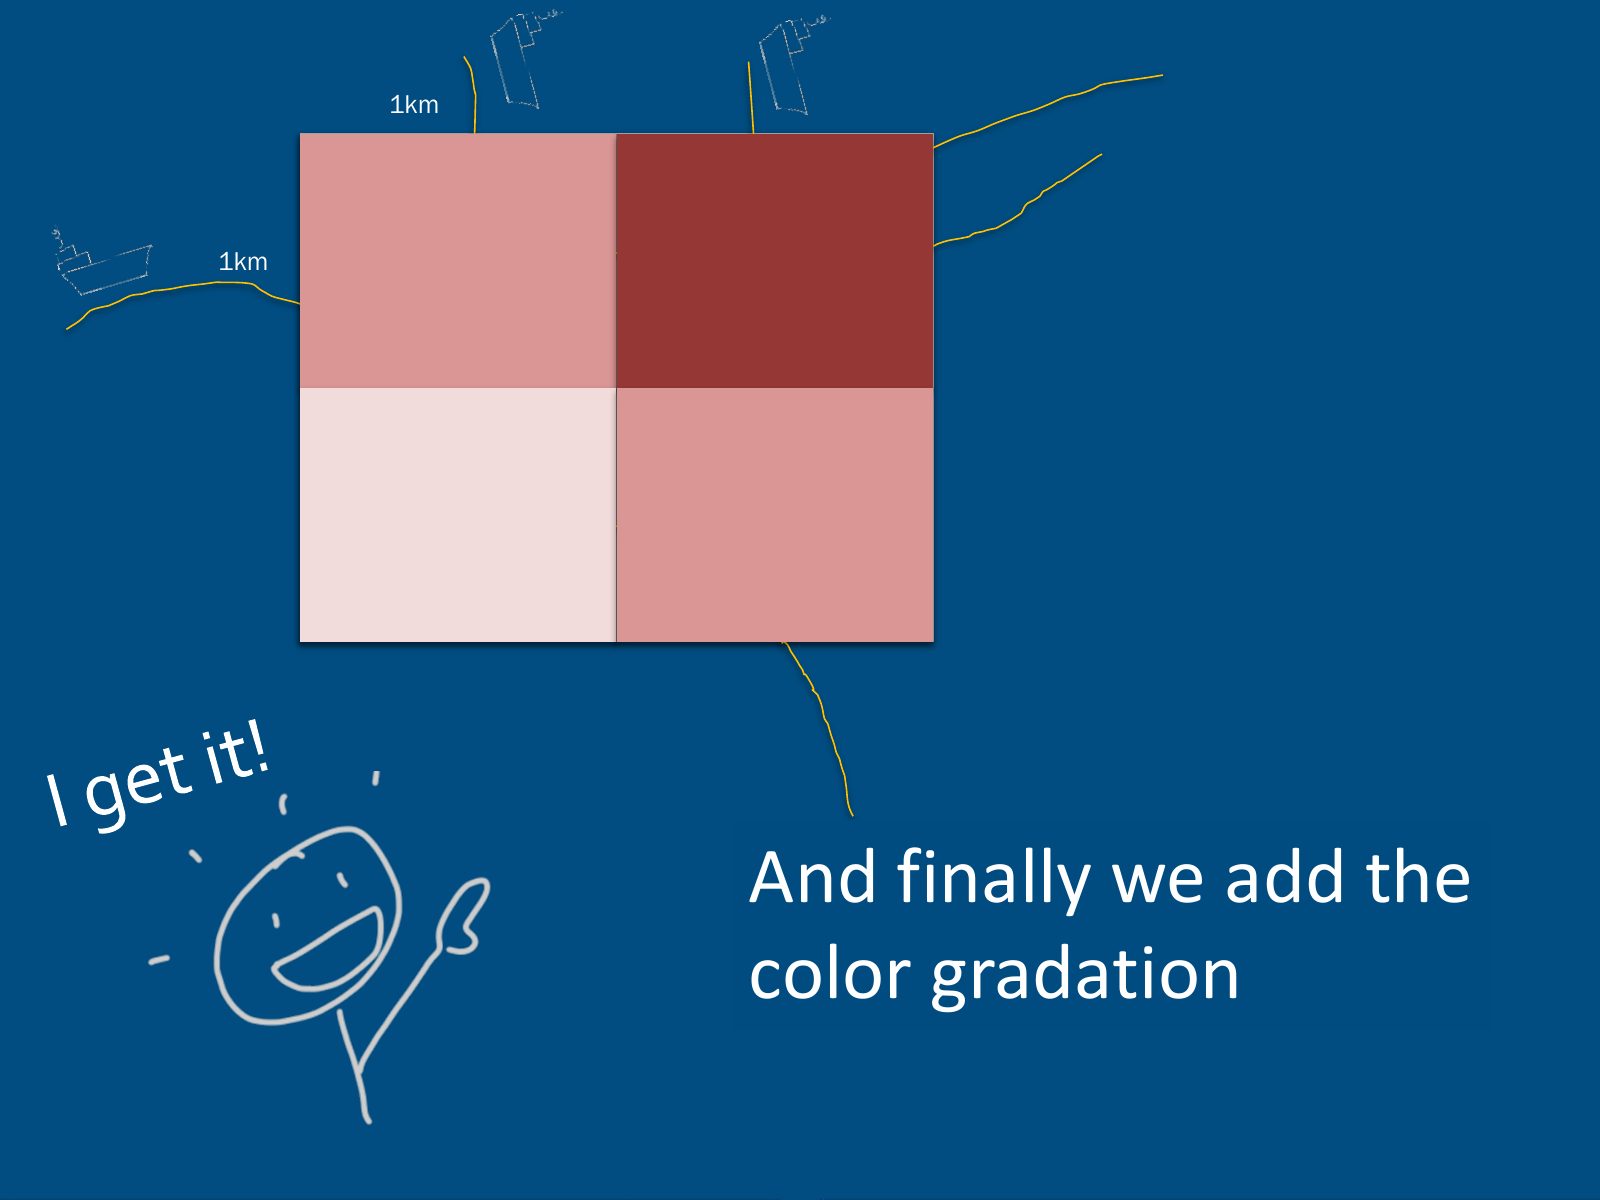
Slide 33 of 41: 1km 1km 2 3 1 2 We count the lines crossing each cell
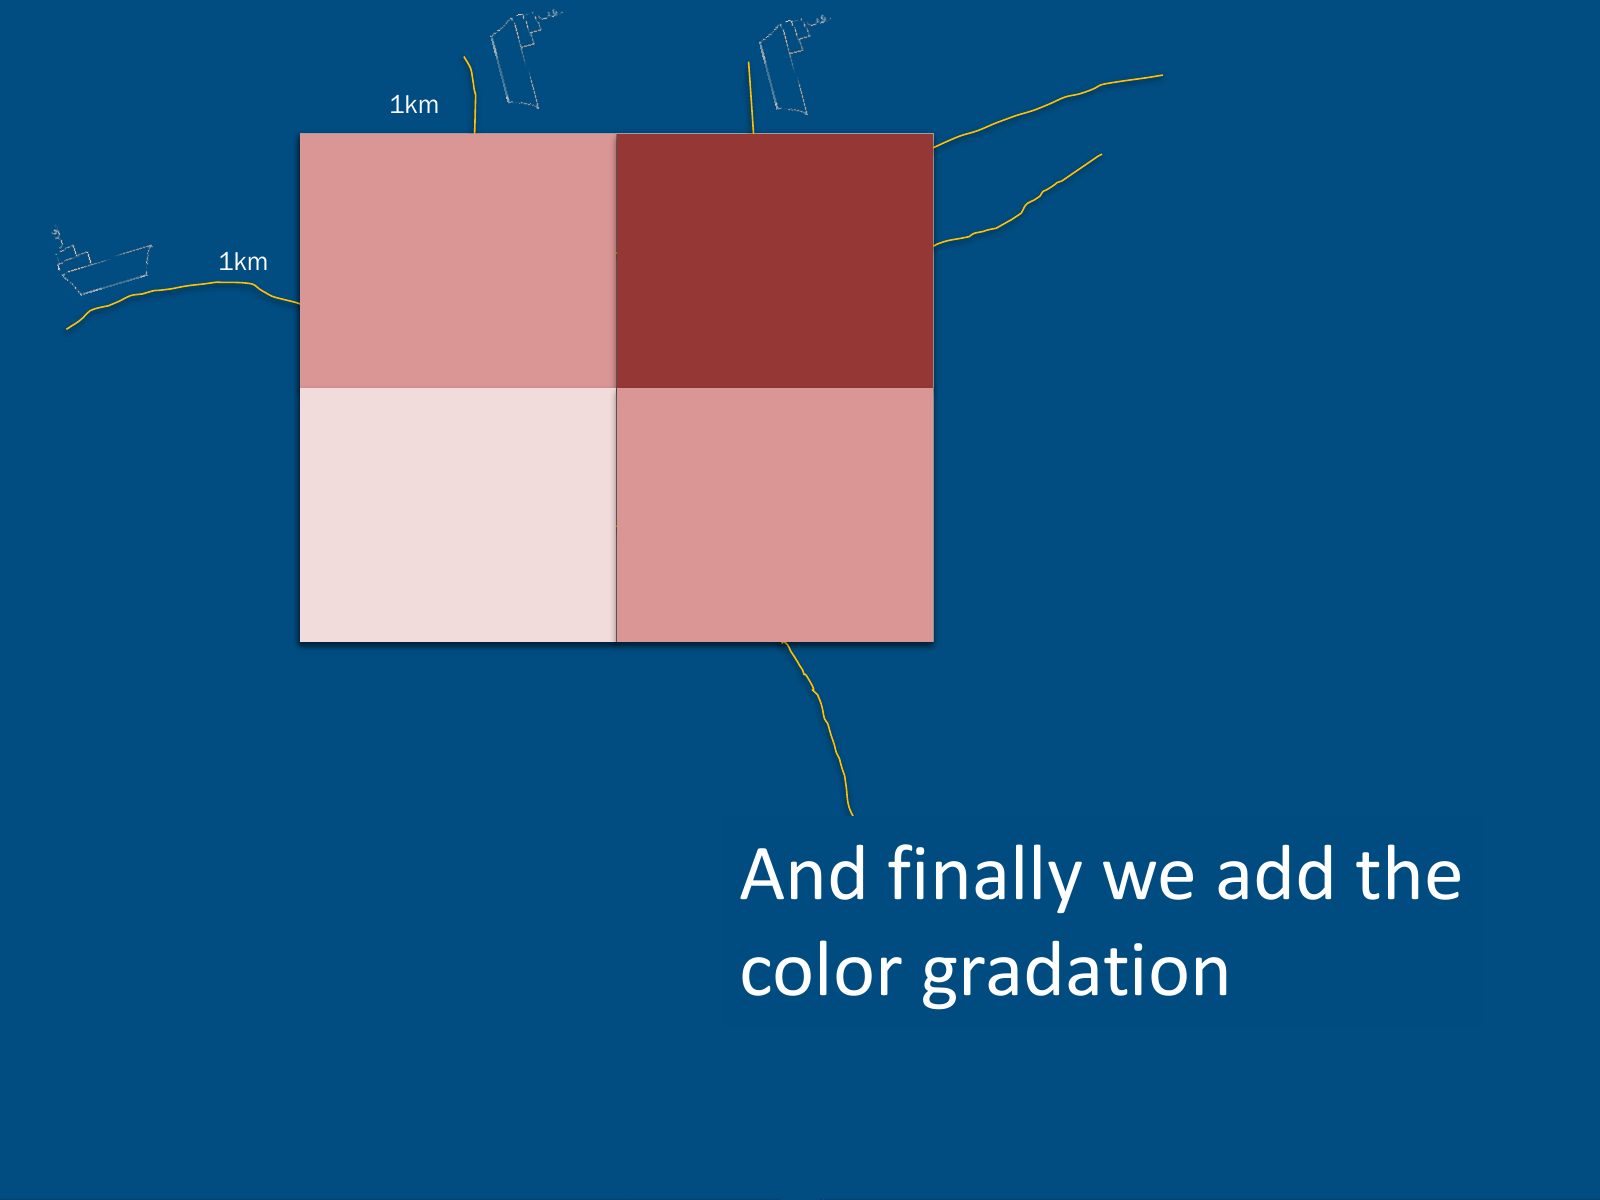
Slide 34 of 41: 1km 1km 2 3 1 2 And finally we add the color gradation
Slide 35 of 41: 1km 1km 2 3 1 2 And finally we add the color gradation
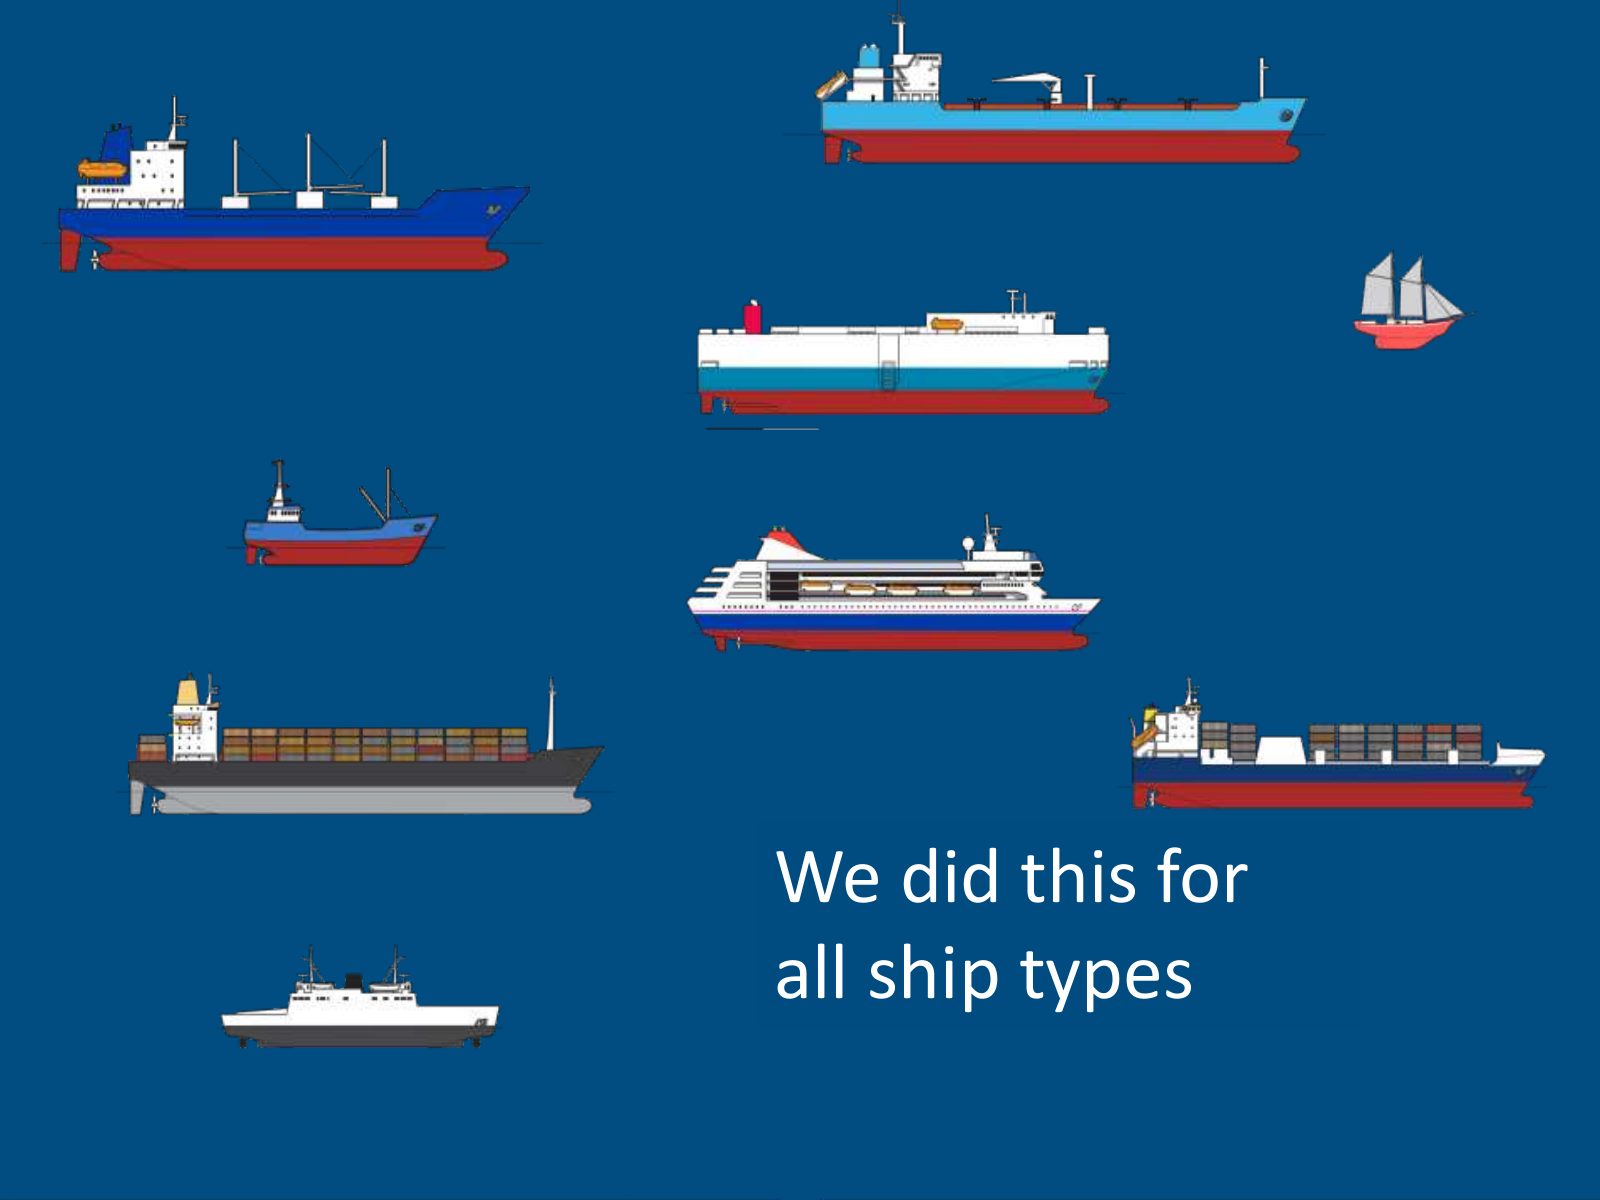
Slide 36 of 41: We did this for all ship types
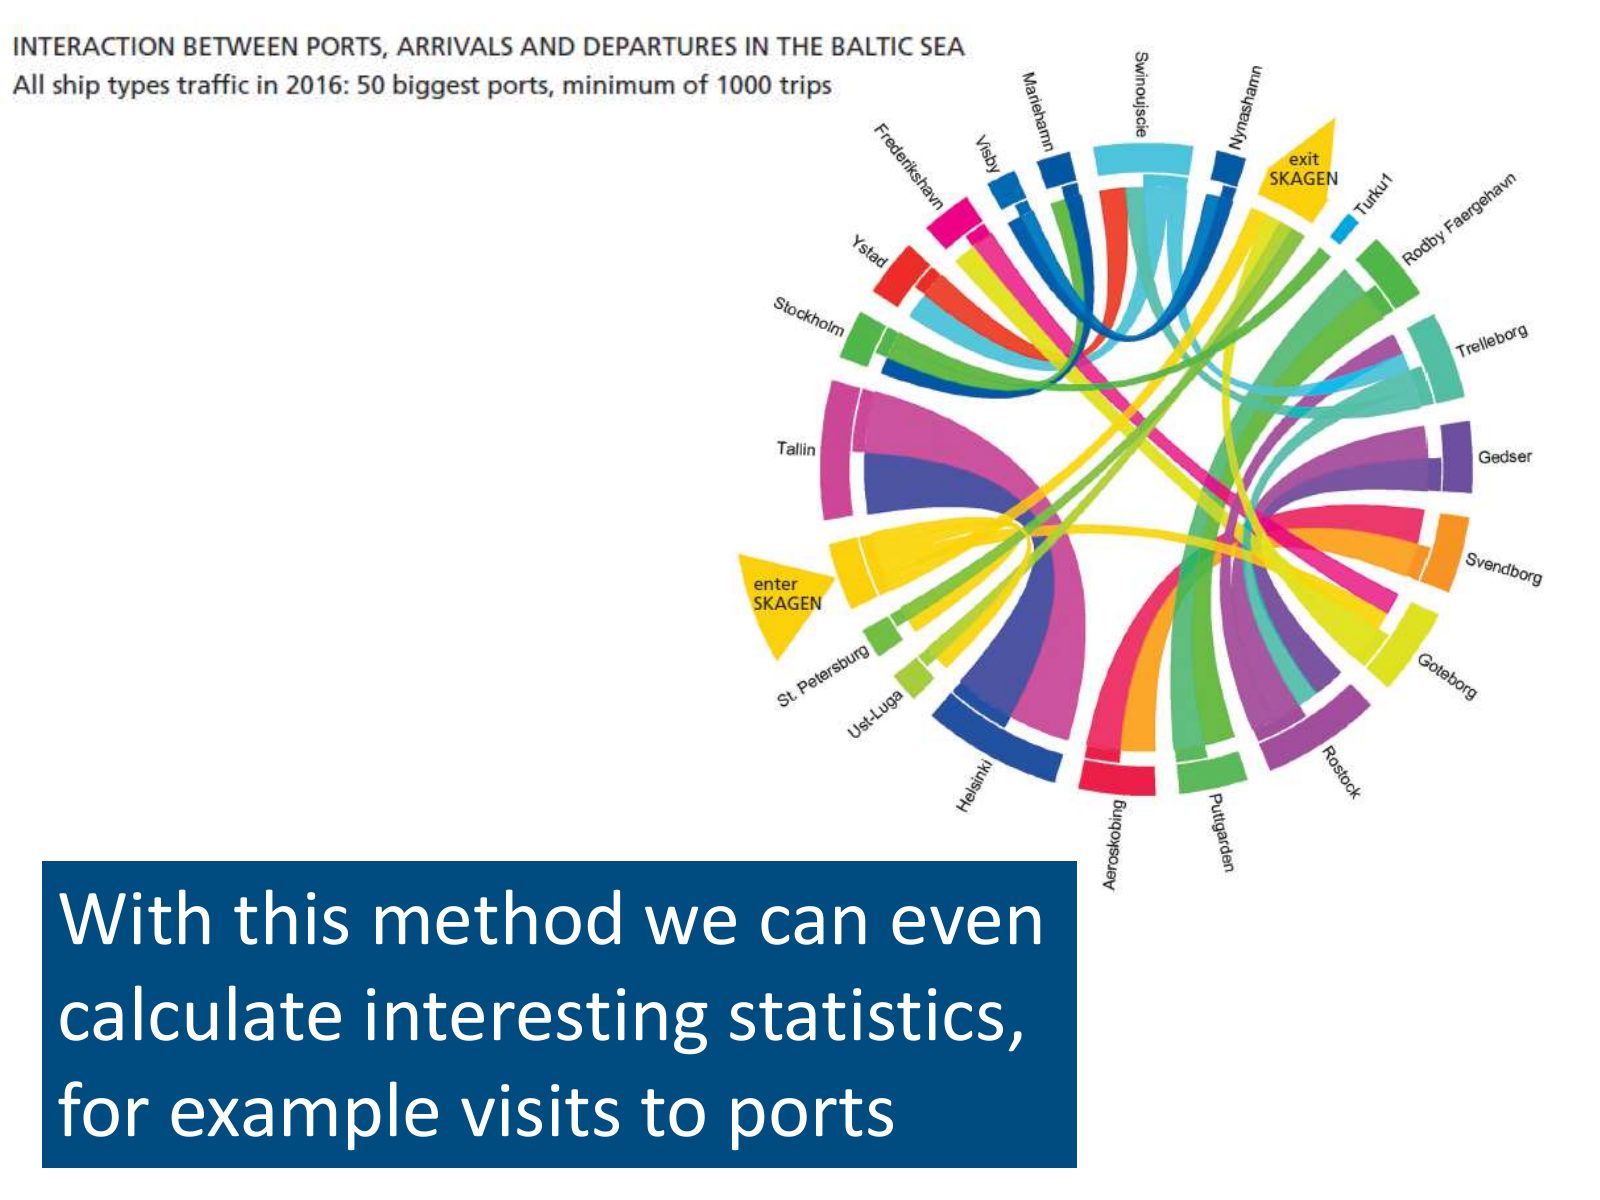
Slide 37 of 41: With this method we can even calculate interesting statistics, for example visits to ports
Slide 38 of 41: picture slide without text
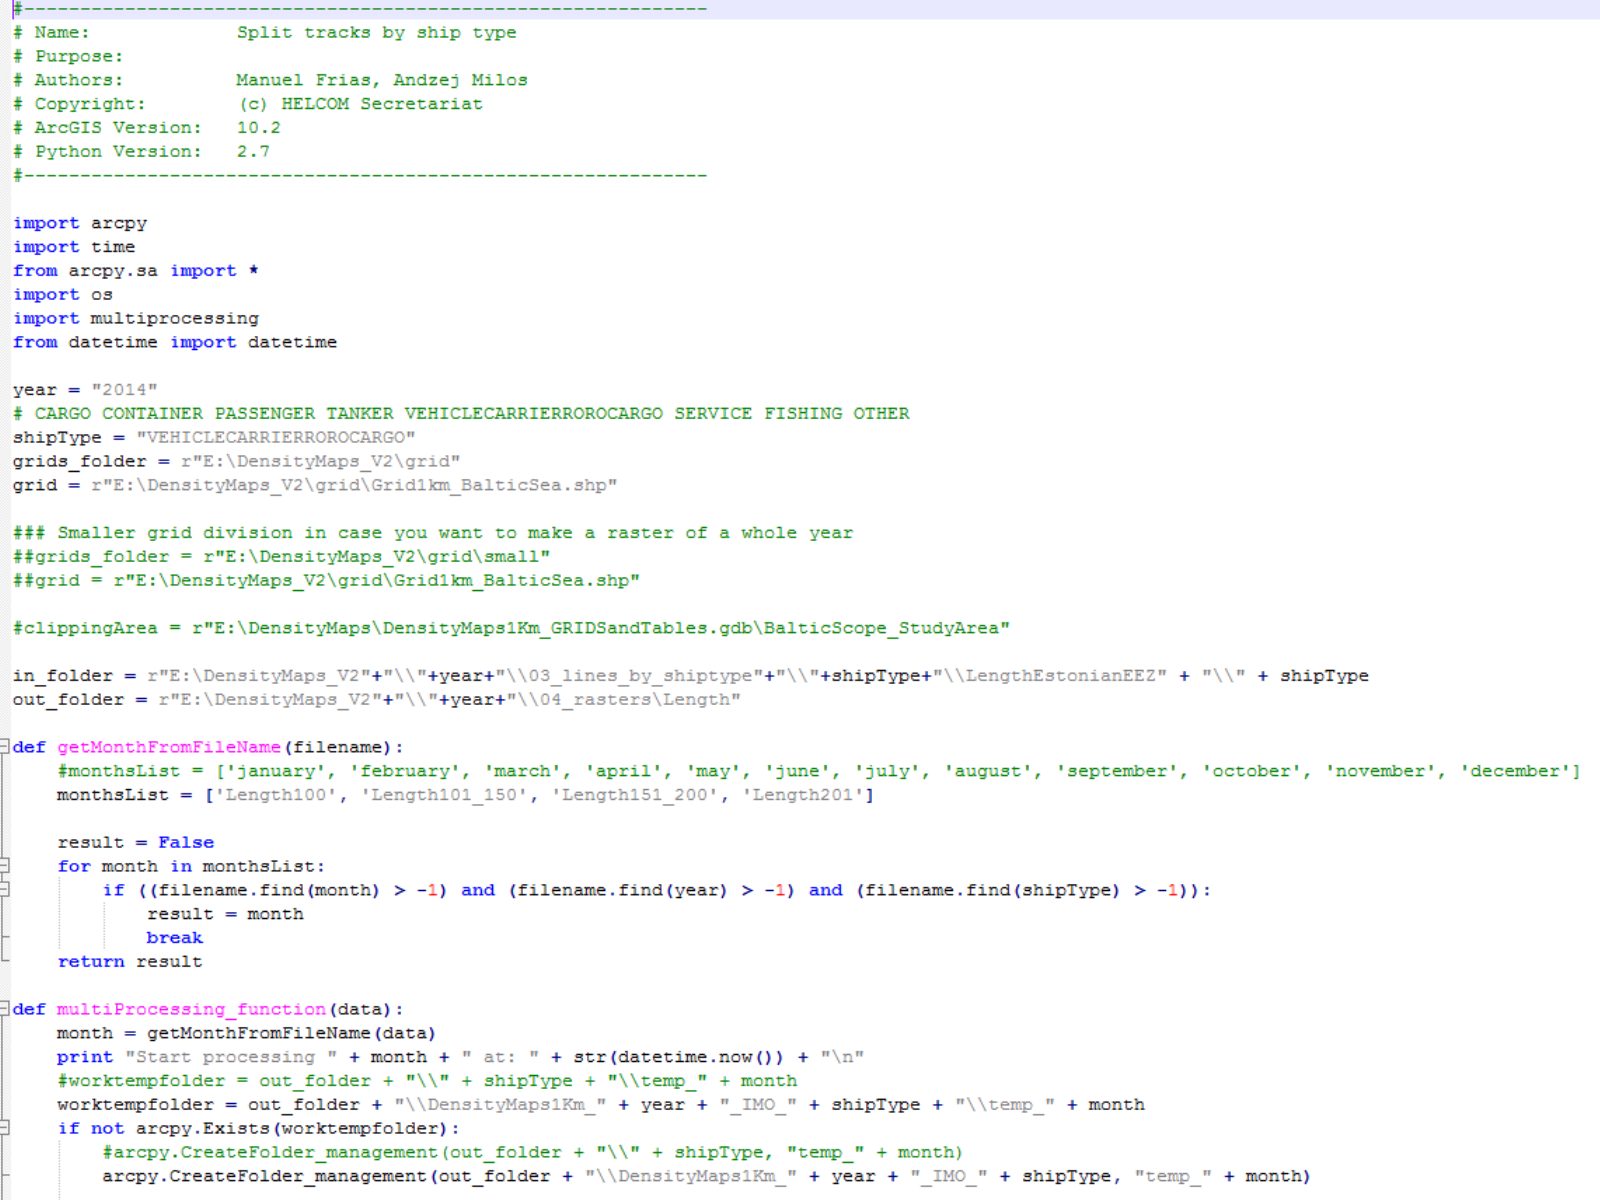
Slide 39 of 41: We produced hundreds of lines of code…
Slide 40 of 41: That we plan to share!
Slide 41 of 41: picture slide without text
1 / 41
Swipe, use the arrows or the keyboard arrow keys. Download the slides (PDF, 1.6 MB)

← All stories