How to make more effective graphs

2018 · 71 slides · Data viz & presentation

The training-session slides: what an effective data visualization is, choosing the right graph and improving its style.
Slide 1 of 71: How to make more effective graphs Training session on data visualization organized by Manuel Frias HELCOM Secretariat, 28th November 2018
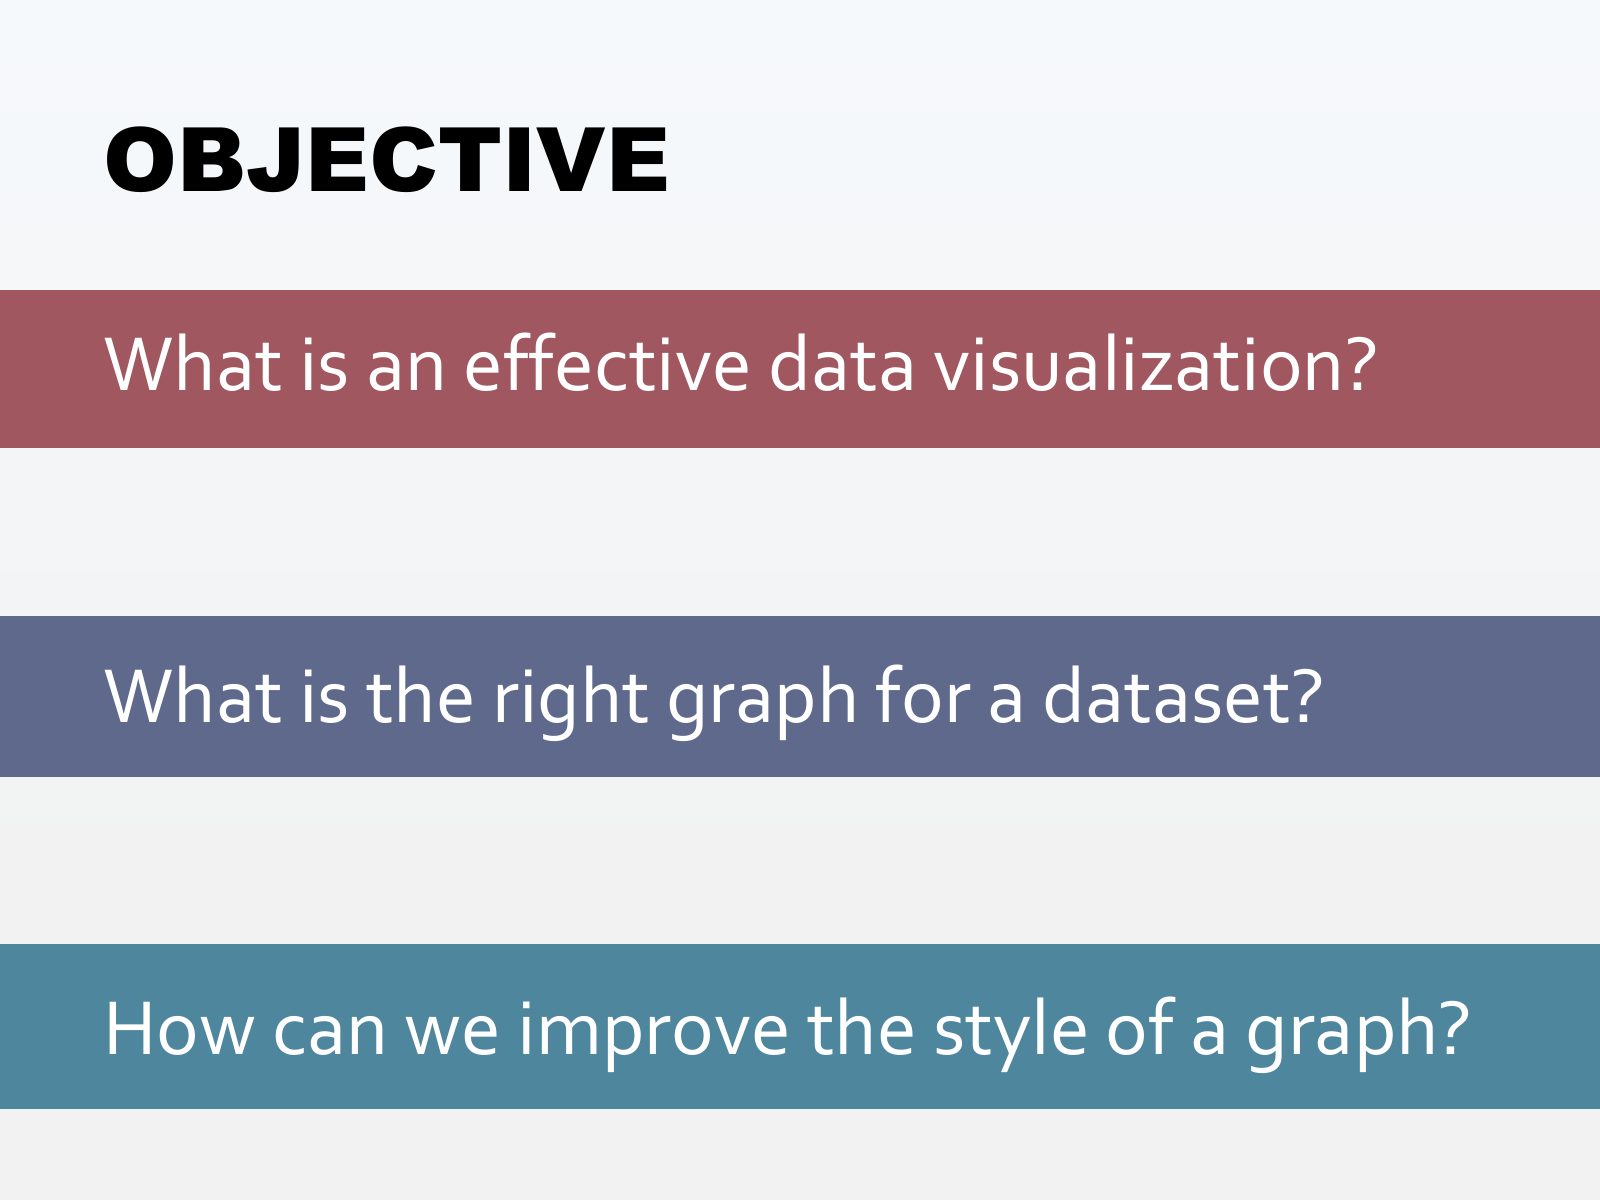
Slide 2 of 71: OBJECTIVE What is an effective data visualization? What is the right graph for a dataset? How can we improve the style of a graph?
Slide 3 of 71: Once upon a time I used to make graphs like this...
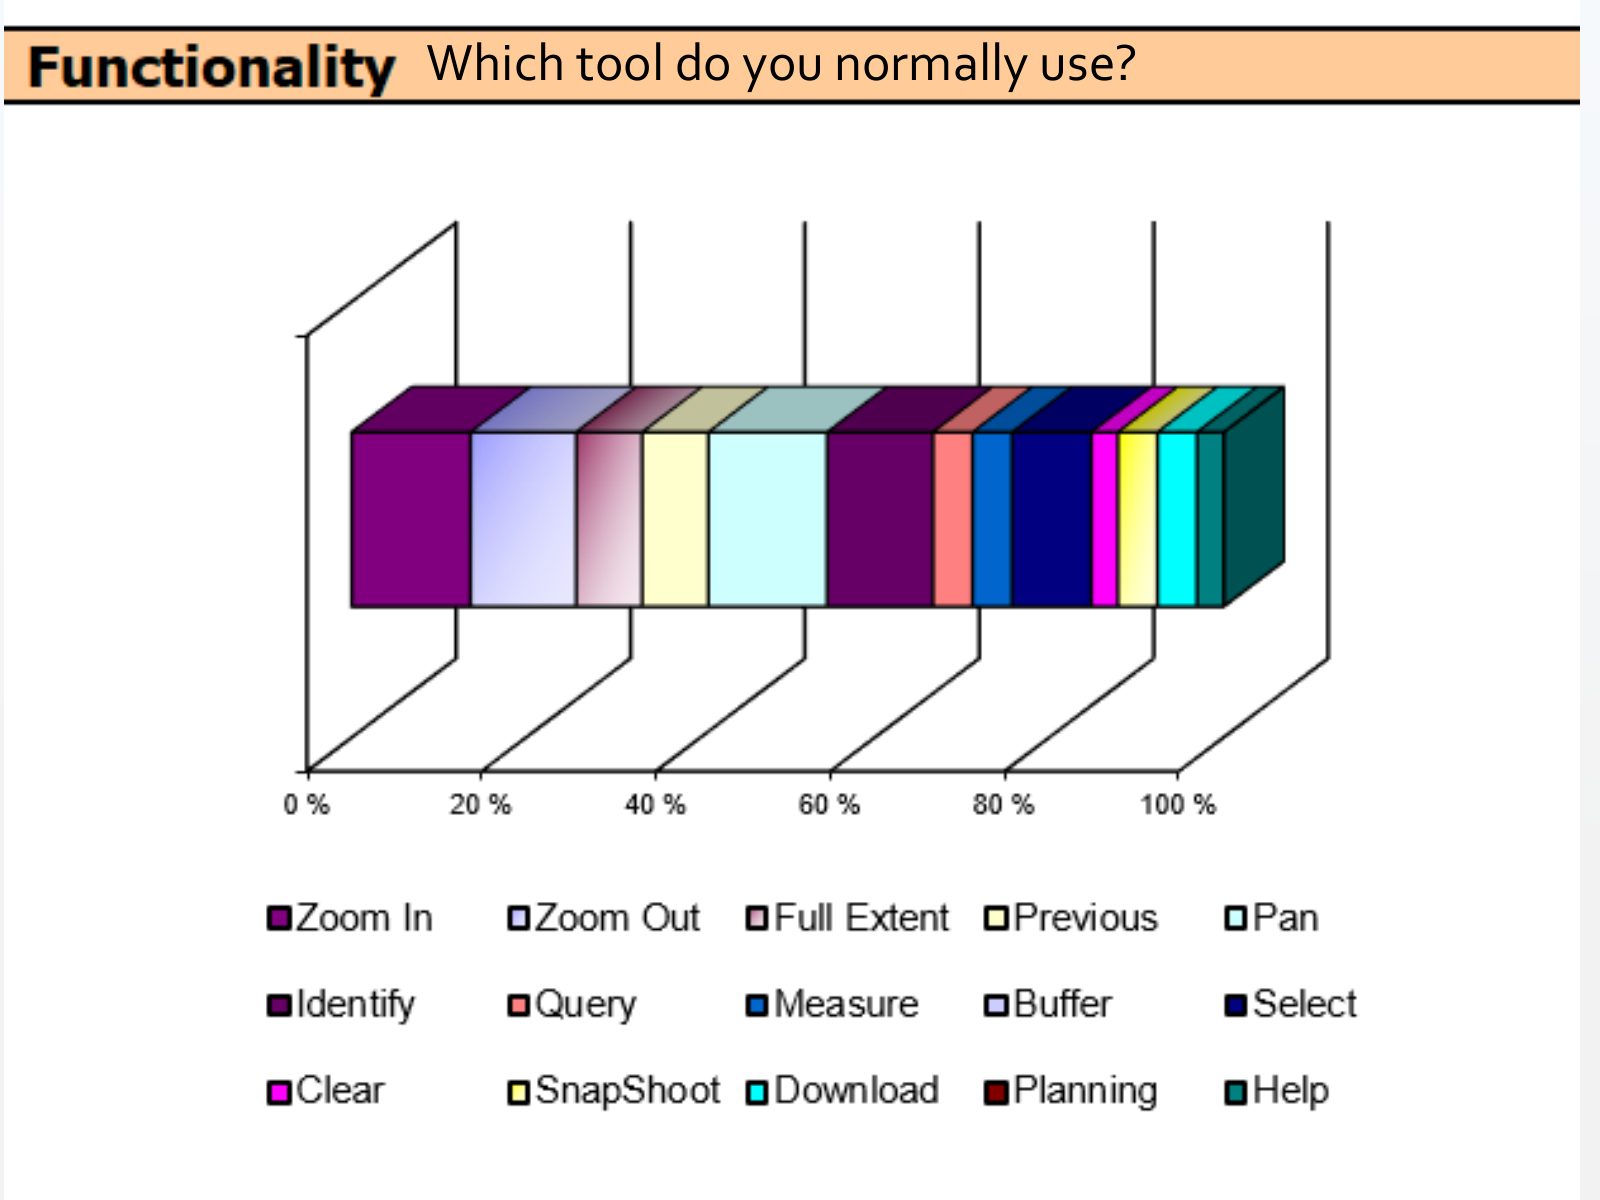
Slide 4 of 71: Which tool do you normally use?
Slide 5 of 71: Then, I started to become interested in data visualization and realized that this was not the best way to visualize data
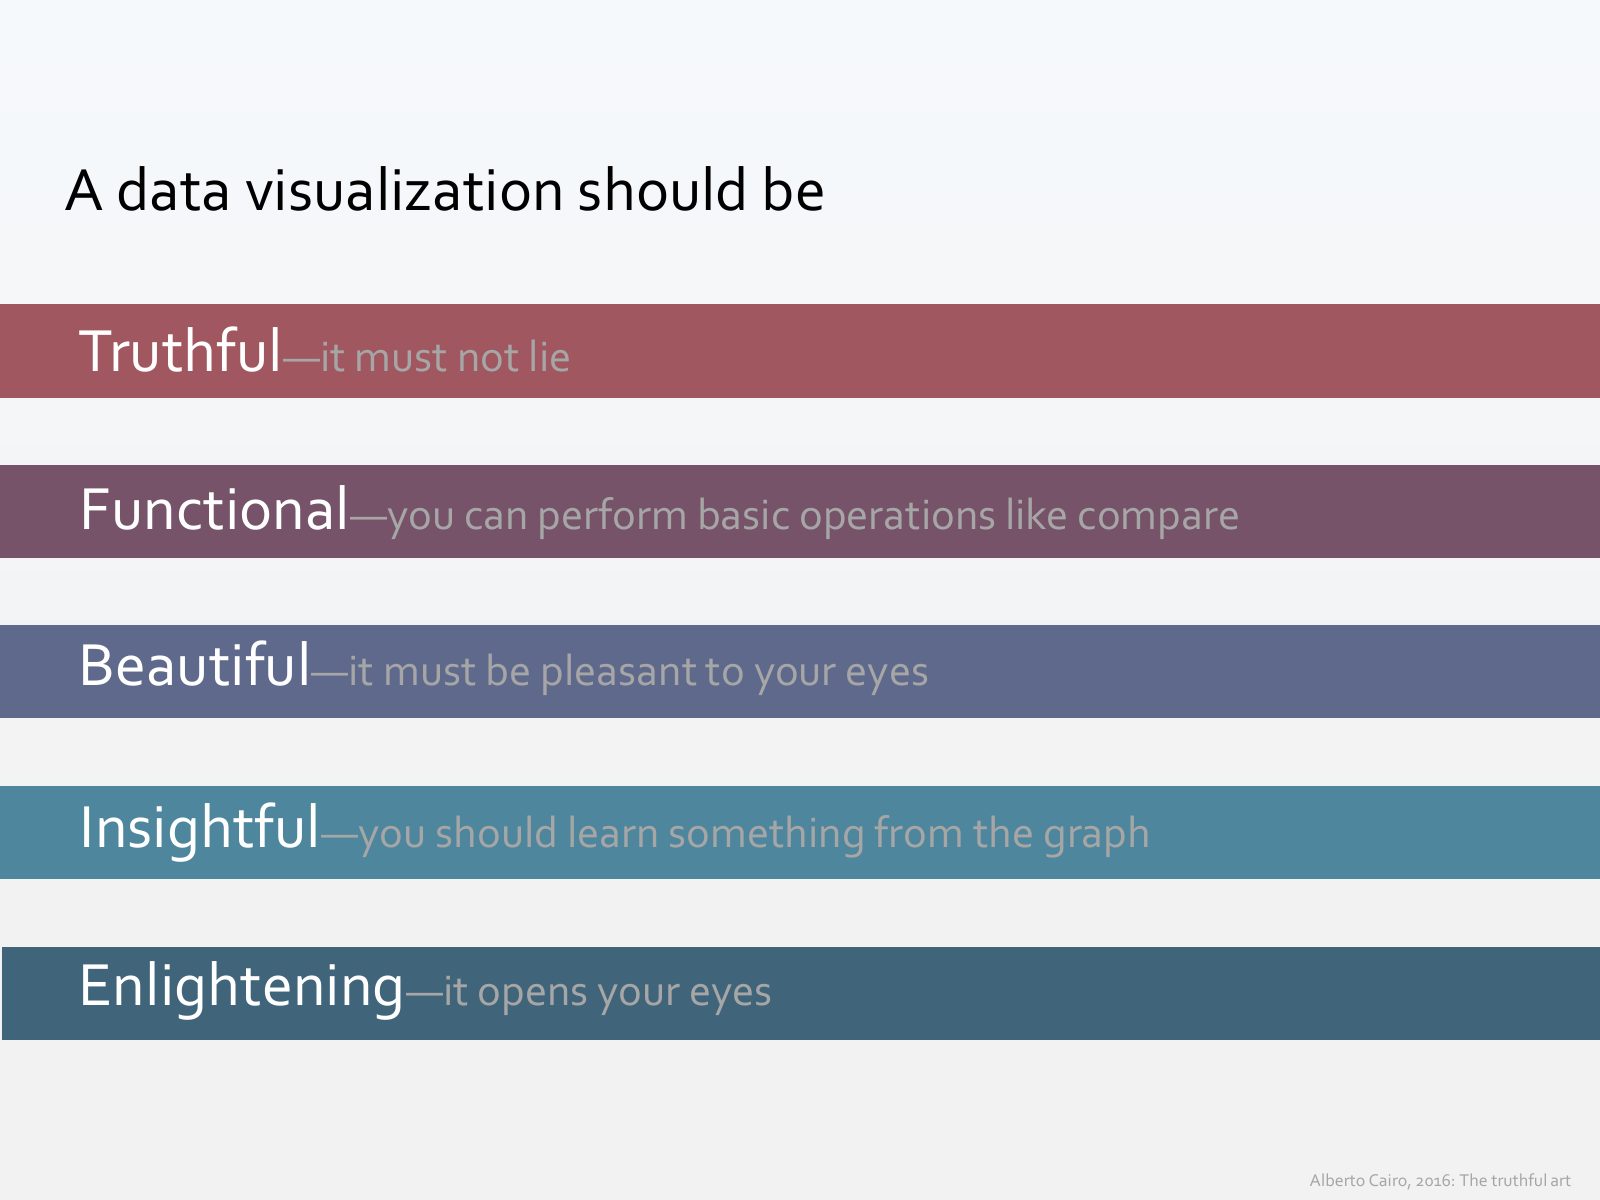
Slide 6 of 71: A data visualization should be Truthful—it must not lie Functional—you can perform basic operations like compare Beautiful—it must be pleasant to your eyes I…
Slide 7 of 71: Let’s test these principles with my (horrendous) graph
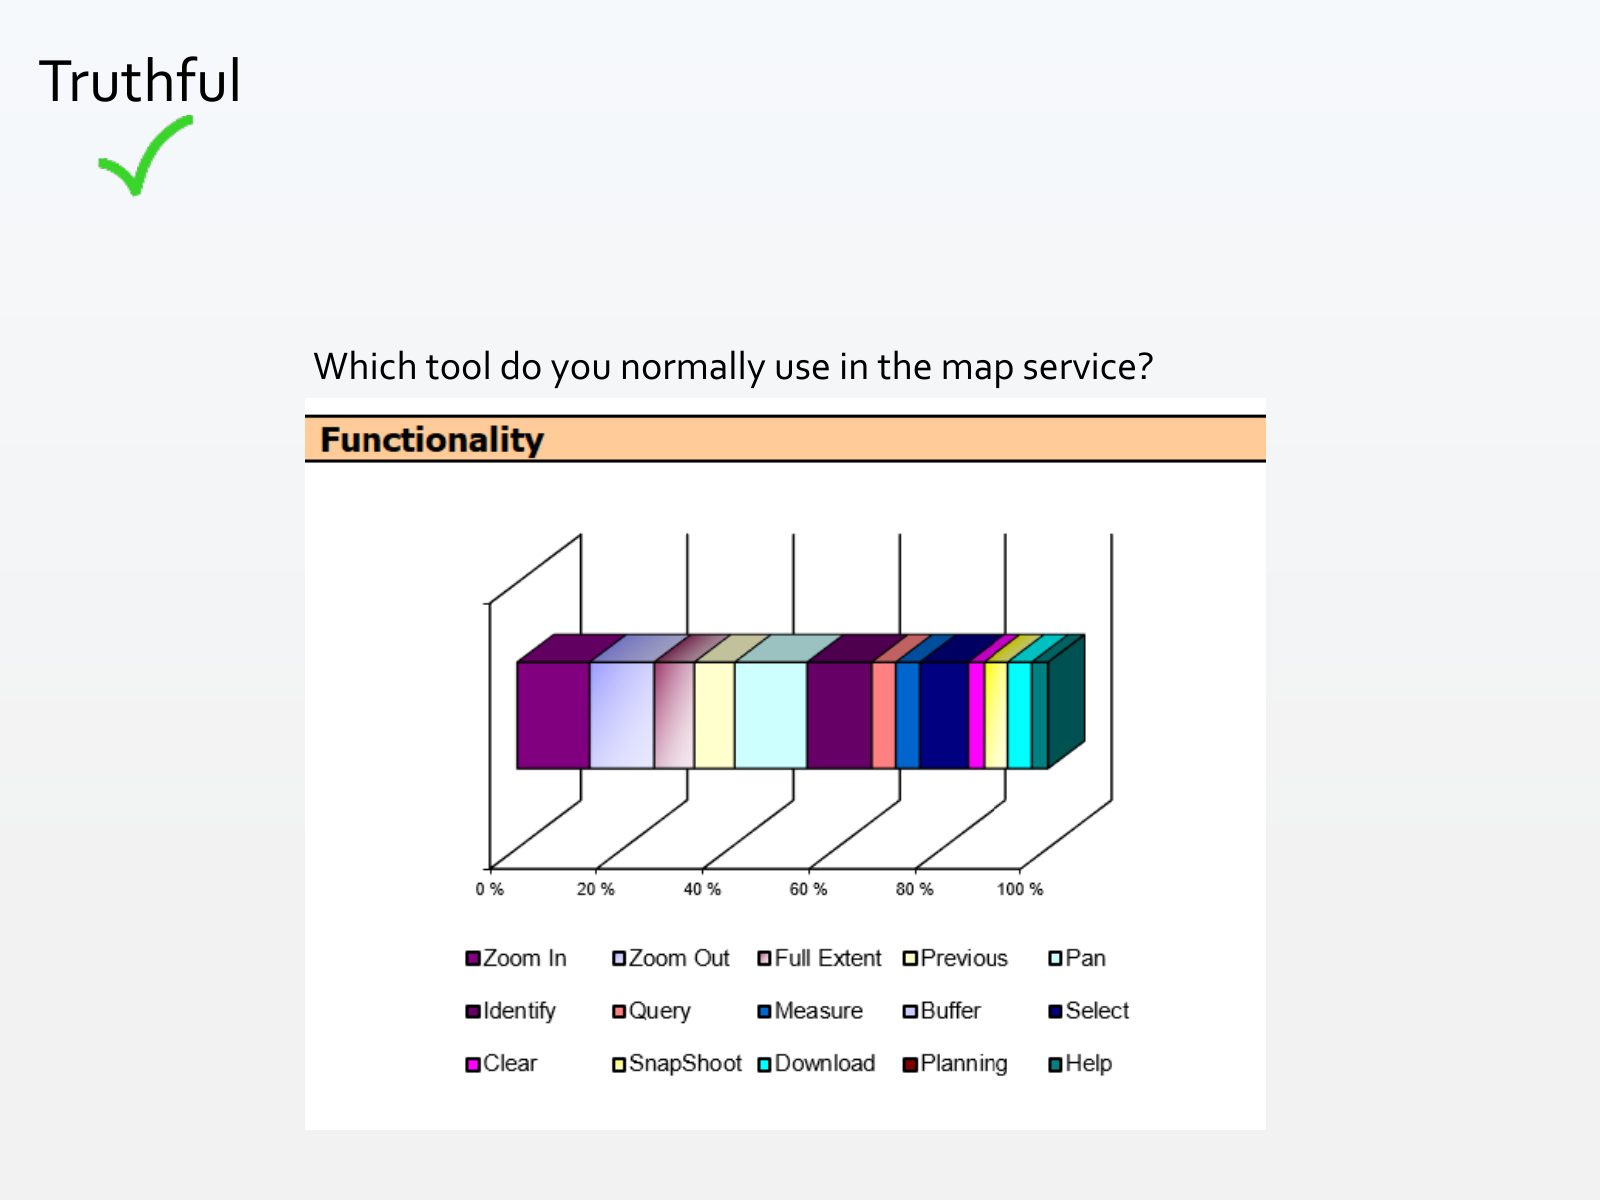
Slide 8 of 71: Truthful Which tool do you normally use in the map service?
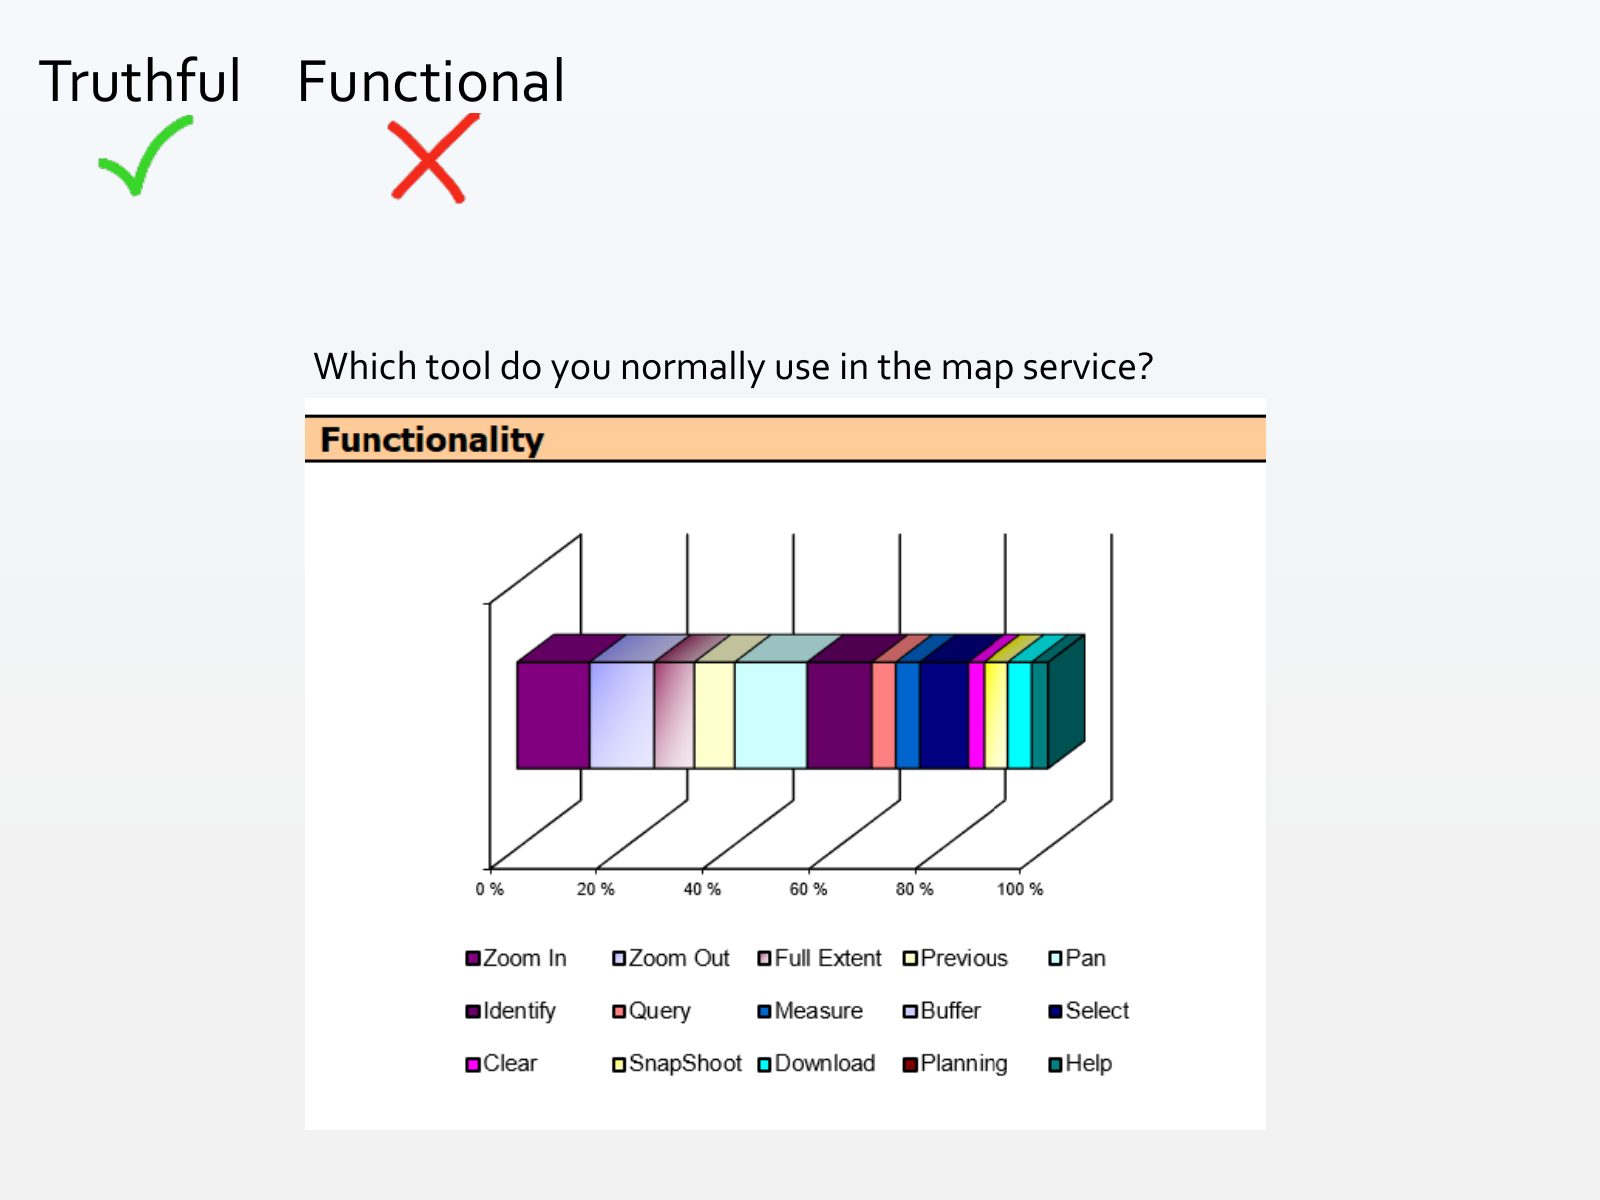
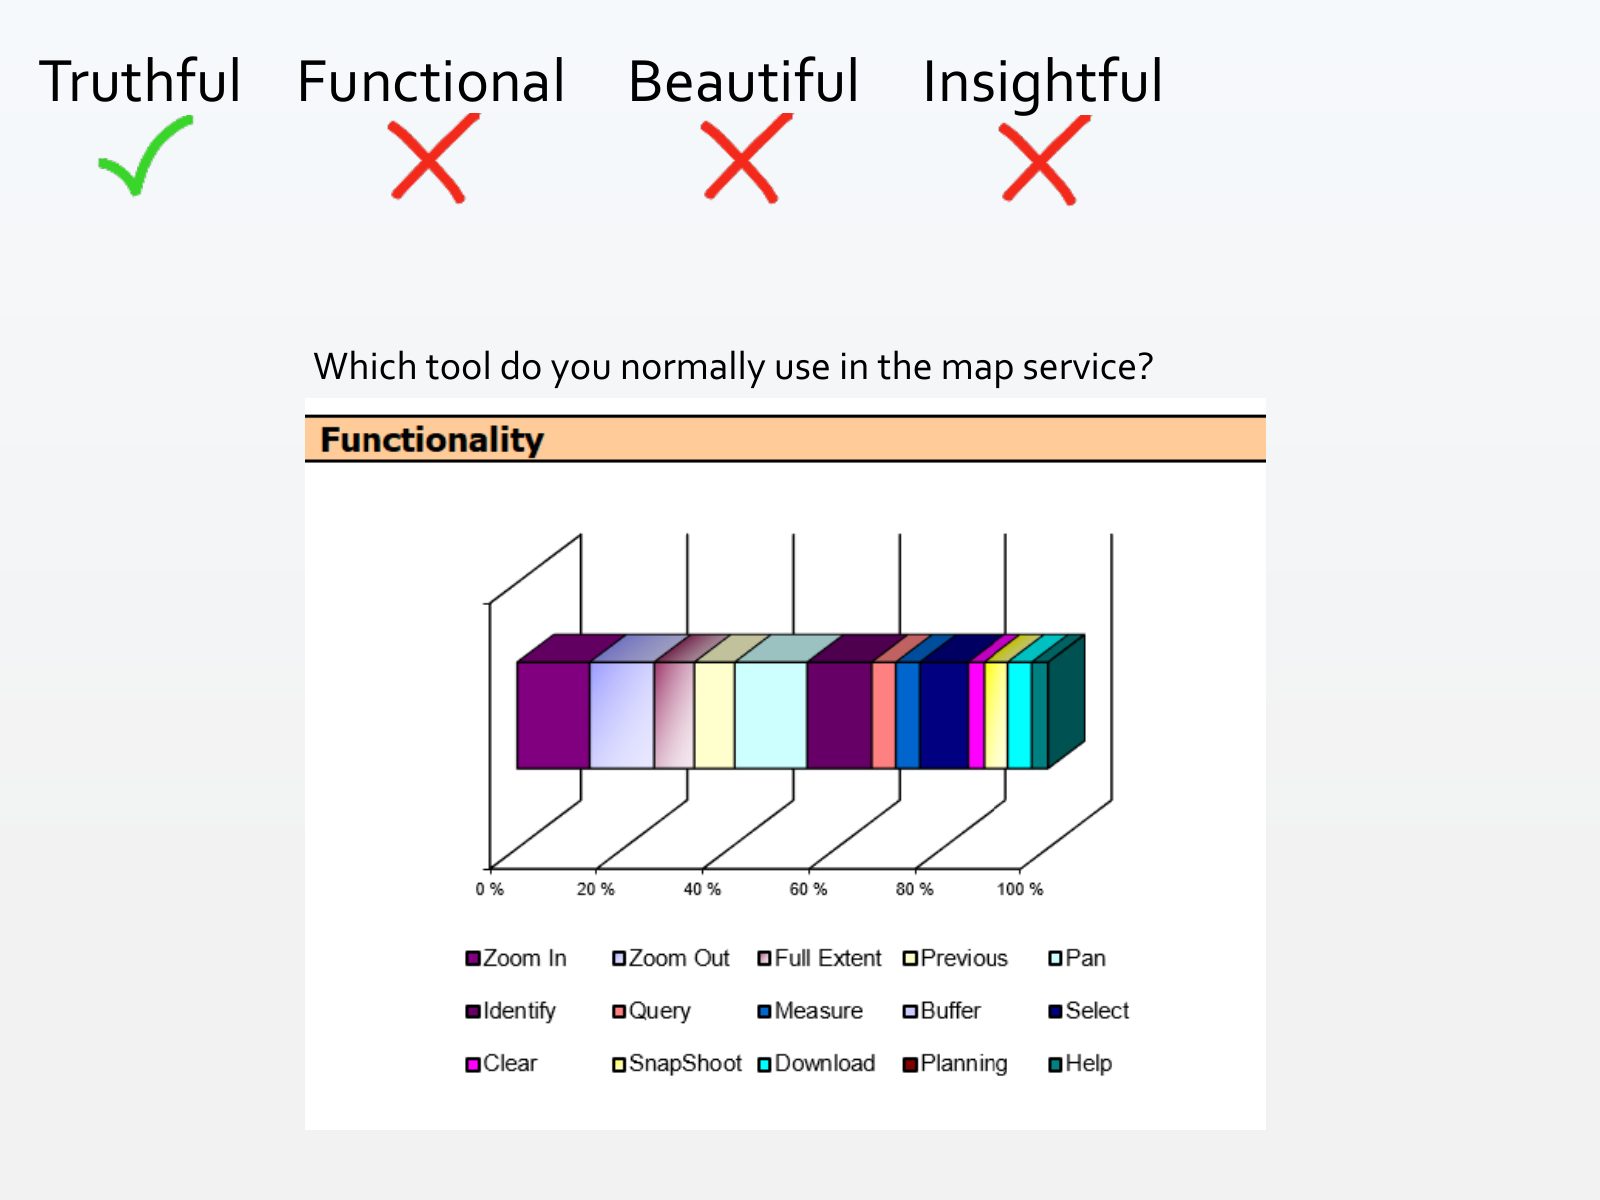
Slide 9 of 71: Truthful Functional Which tool do you normally use in the map service?
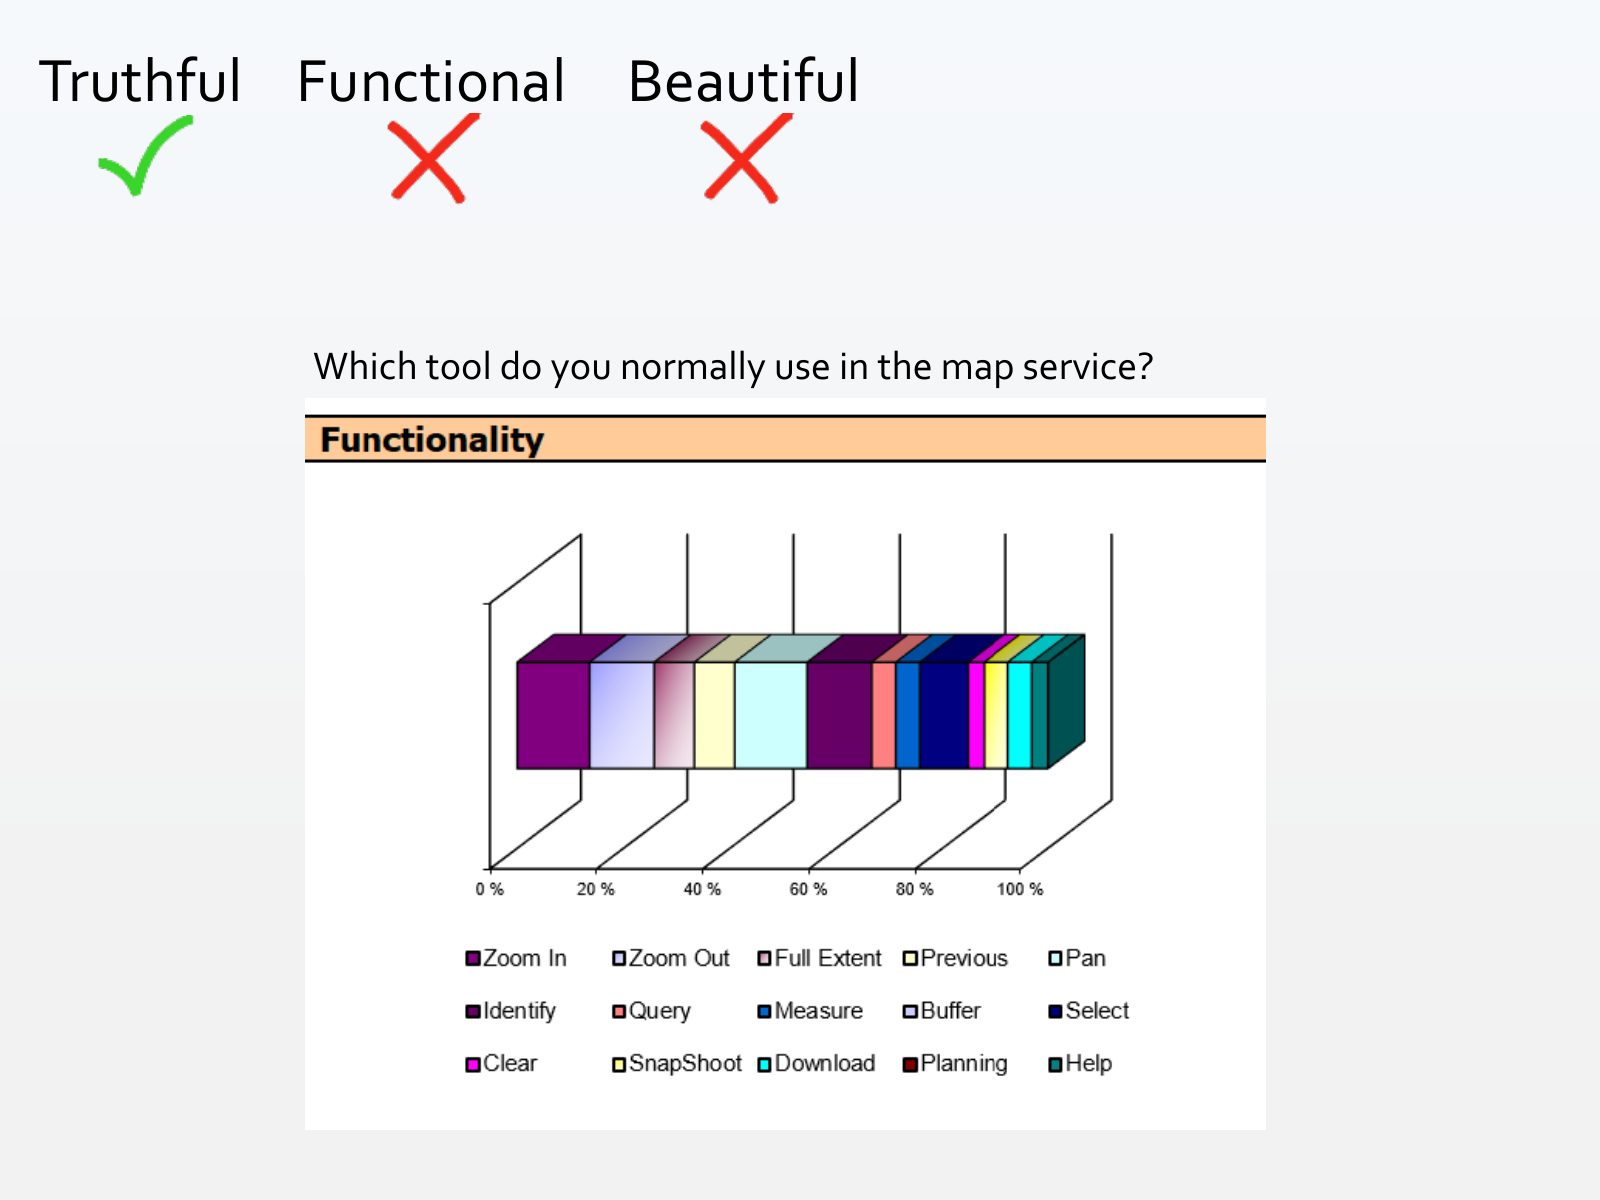
Slide 10 of 71: Truthful Functional Beautiful Which tool do you normally use in the map service?
Slide 11 of 71: Truthful Functional Beautiful Insightful Which tool do you normally use in the map service?
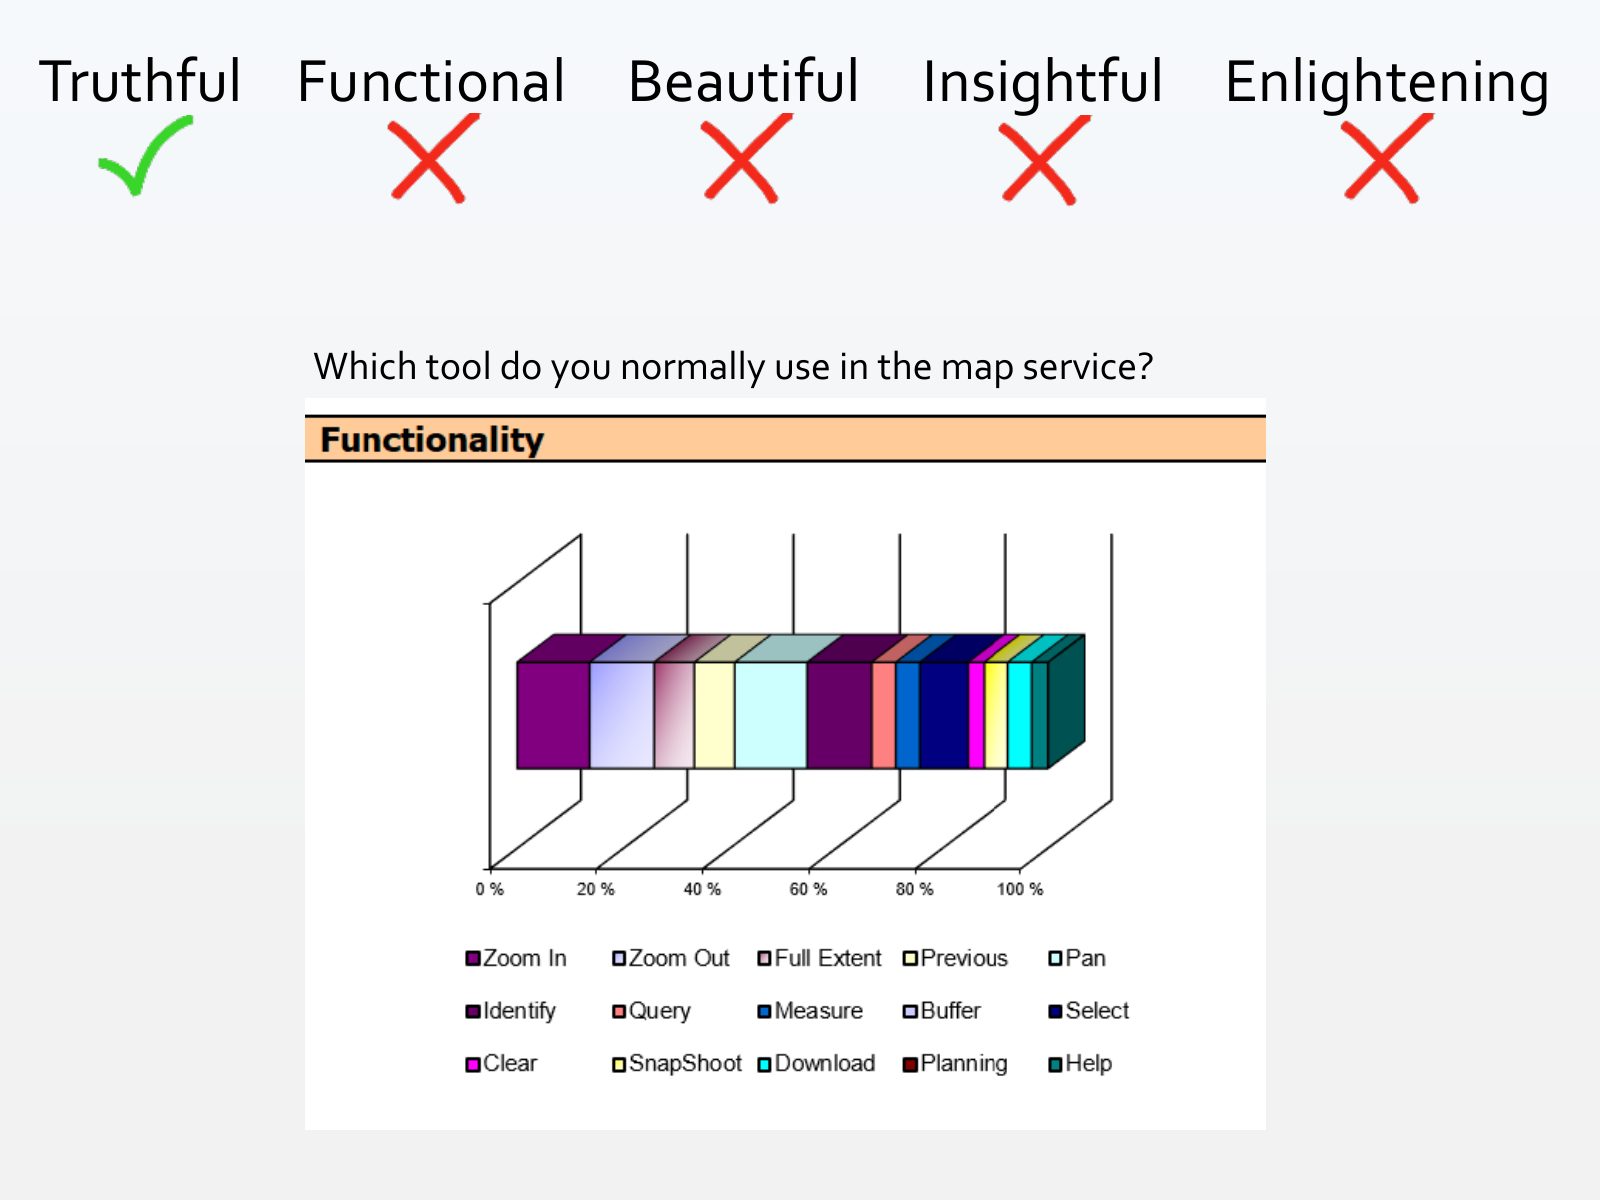
Slide 12 of 71: Truthful Functional Beautiful Insightful Enlightening Which tool do you normally use in the map service?
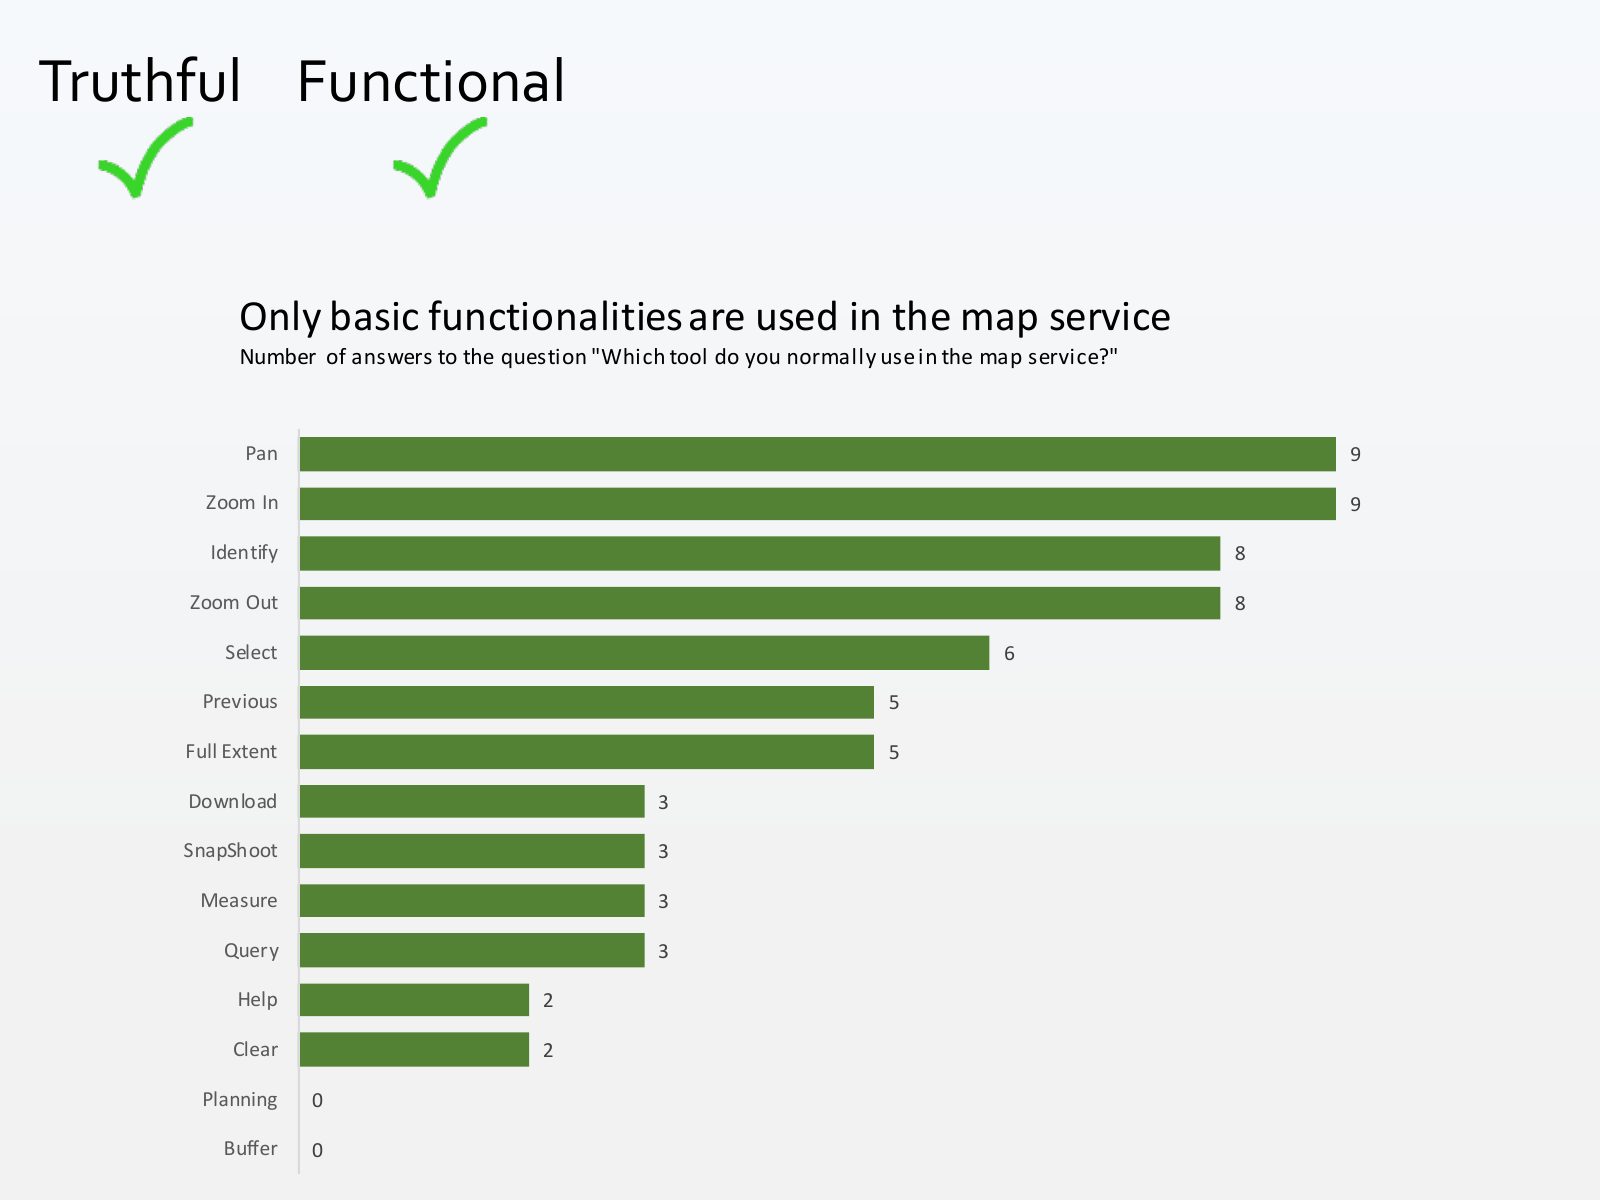
Slide 13 of 71: Let’s remake the graph and run the test again...
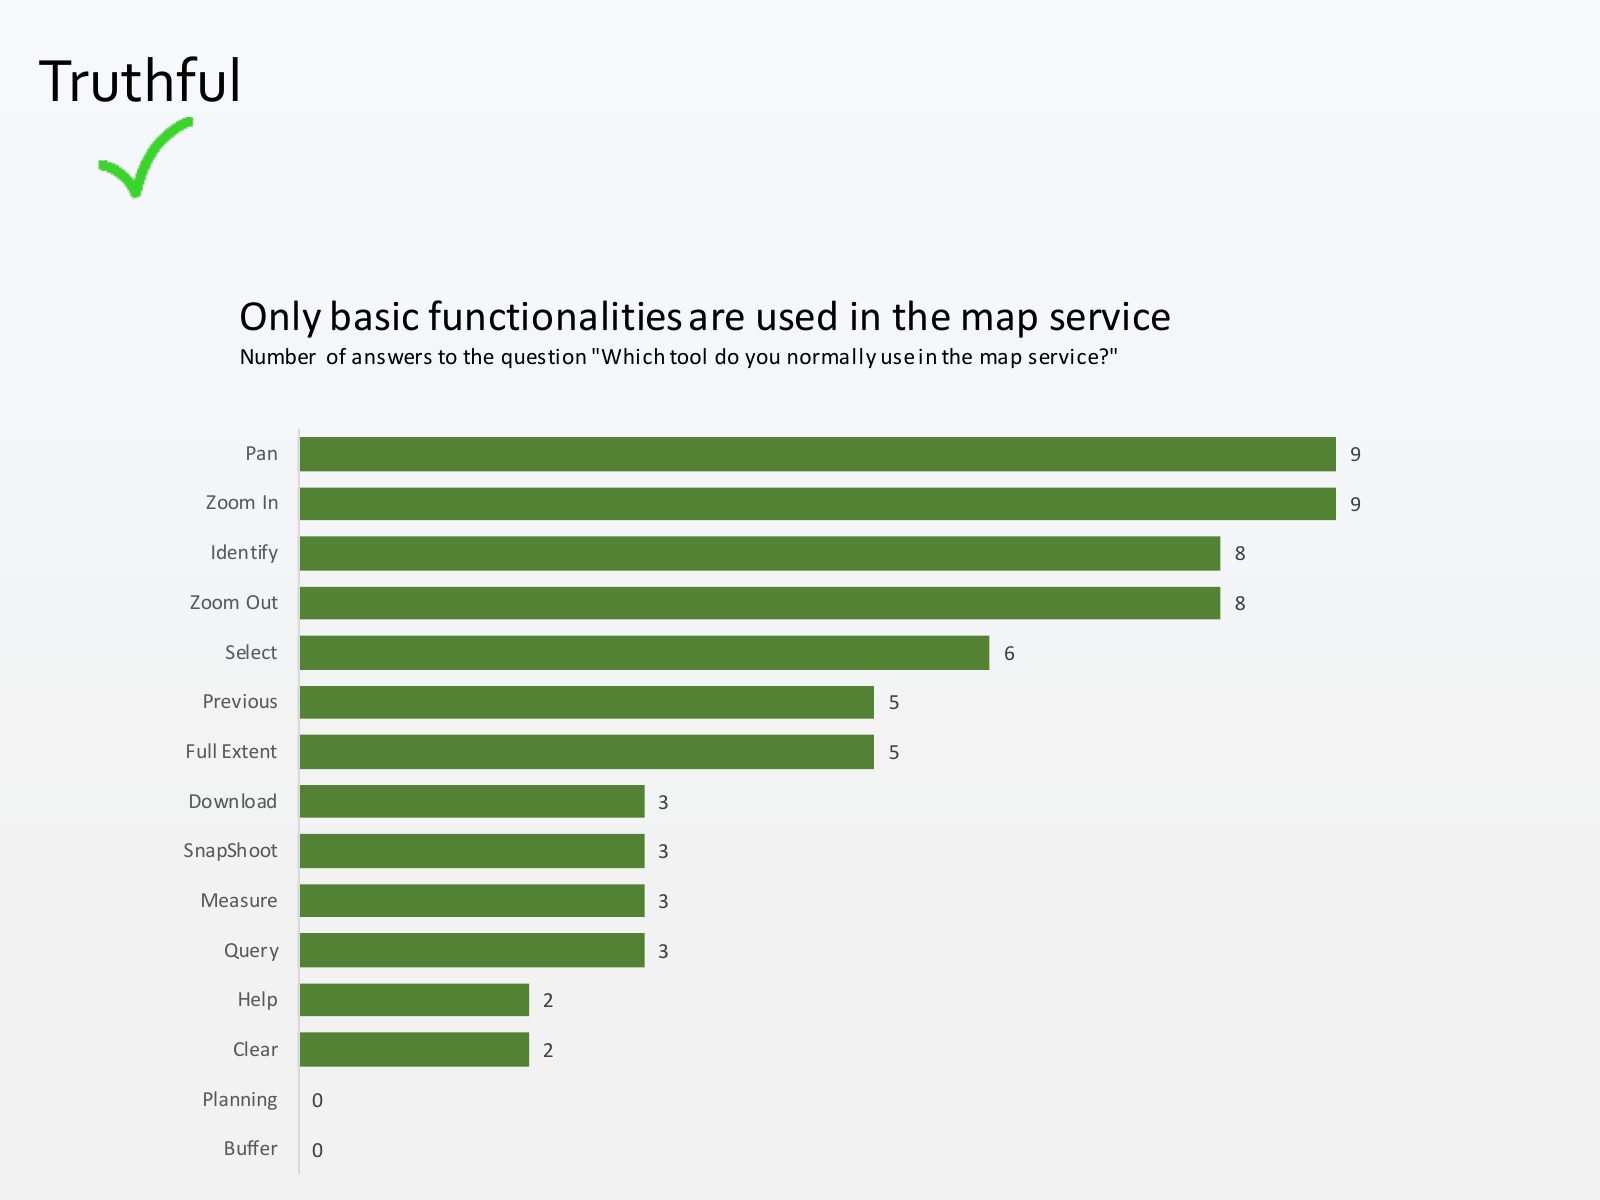
Slide 14 of 71: Truthful Only basic functionalities are used in the map service Number of answers to the question "Which tool do you normally use in the map service?" Pan 9…
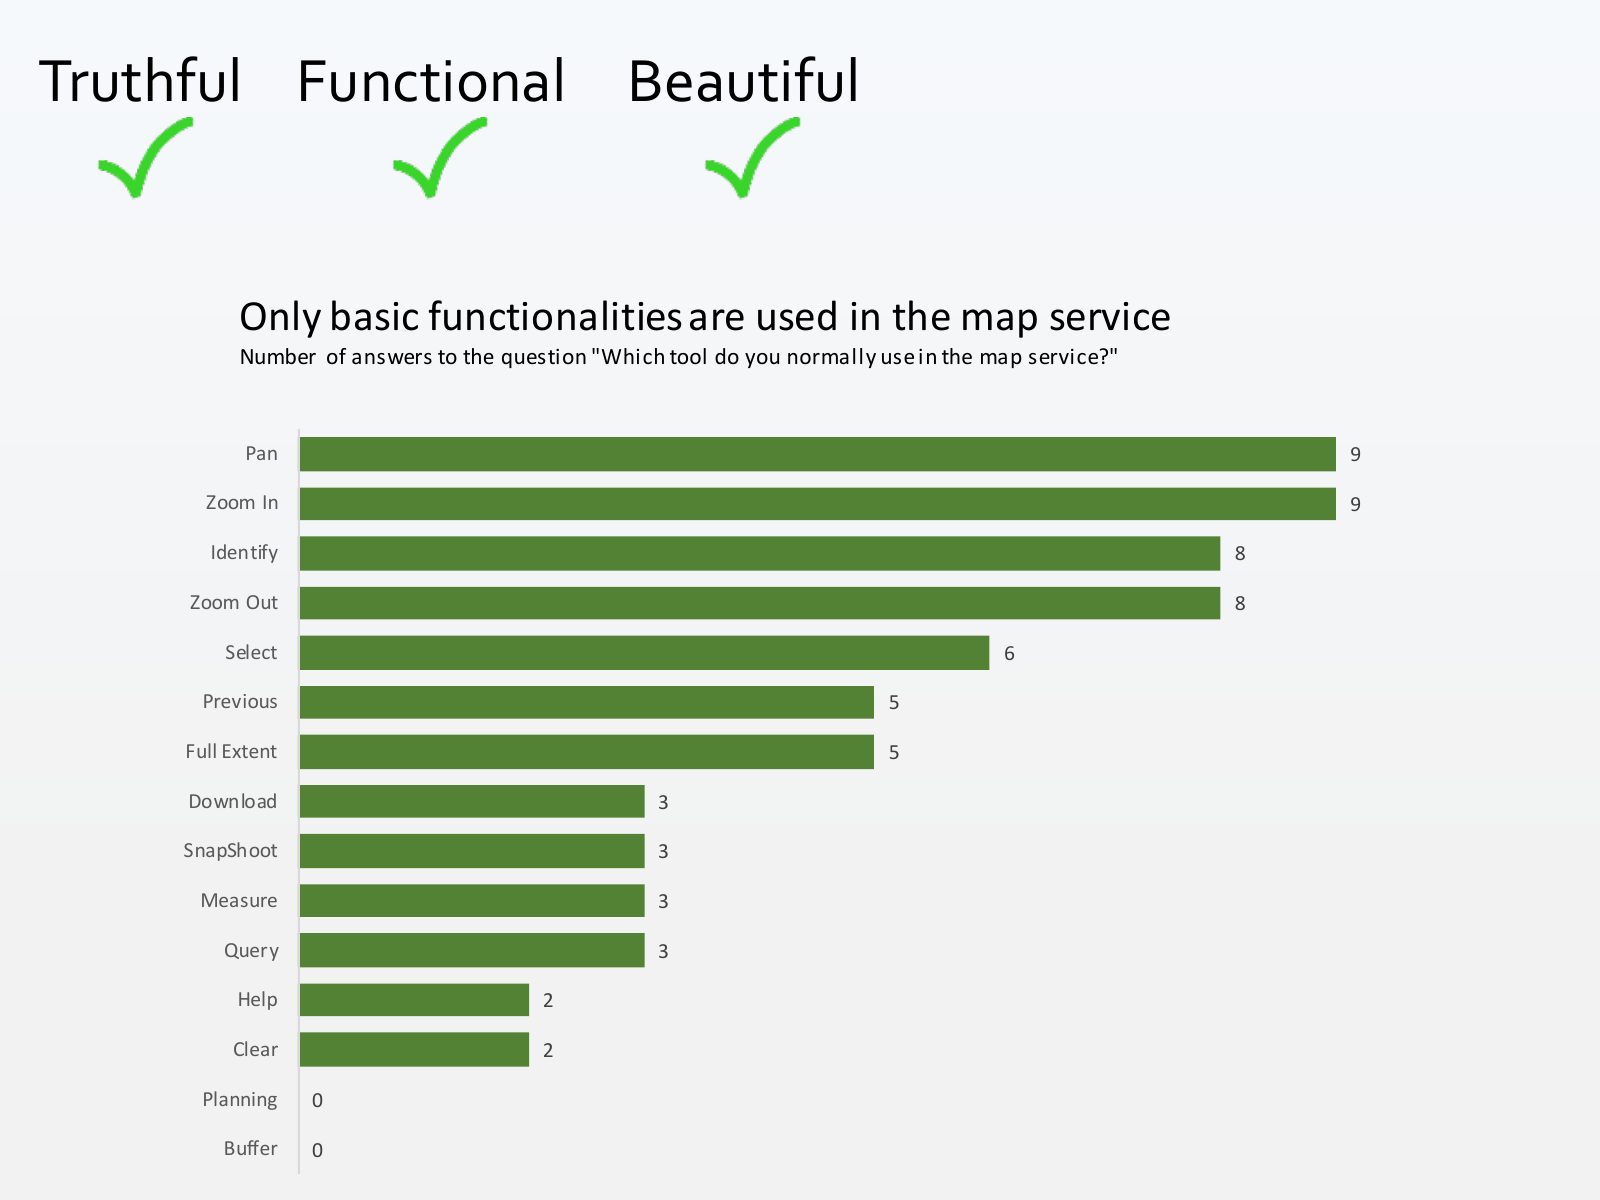
Slide 15 of 71: Truthful Functional Only basic functionalities are used in the map service Number of answers to the question "Which tool do you normally use in the map servi…
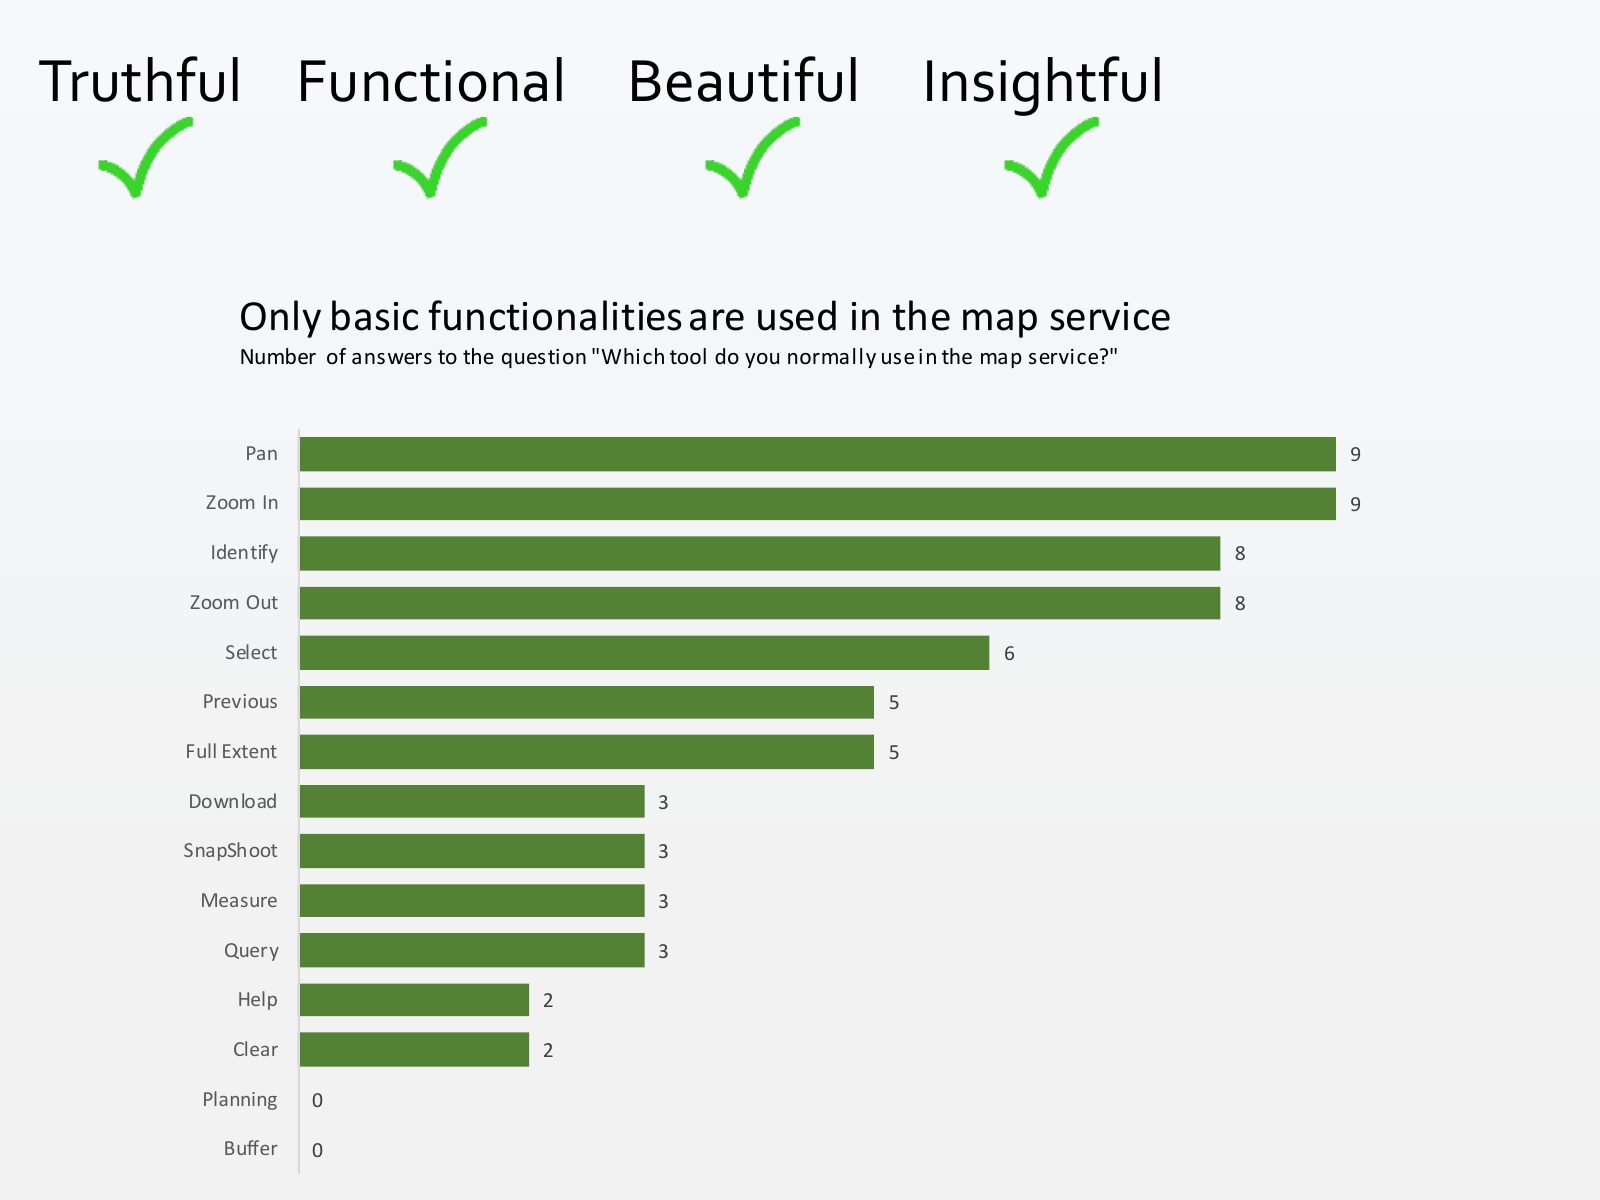
Slide 16 of 71: Truthful Functional Beautiful Only basic functionalities are used in the map service Number of answers to the question "Which tool do you normally use in the…
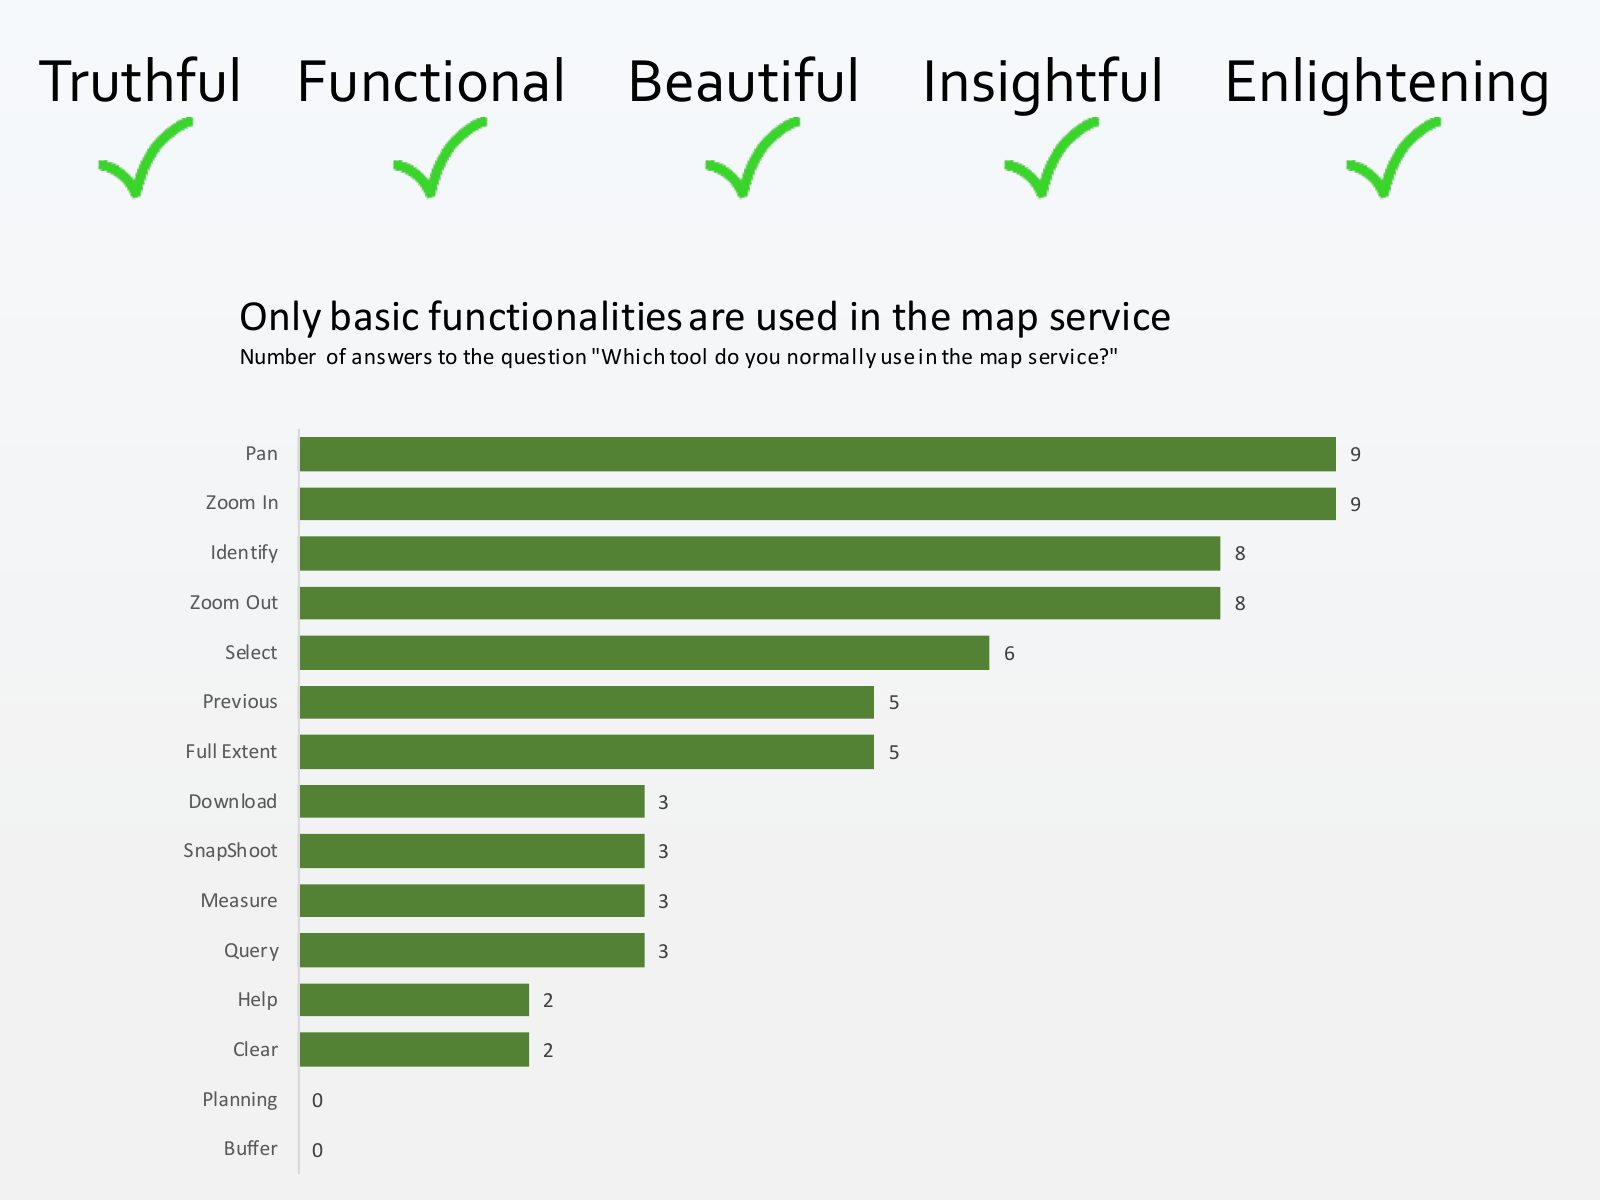
Slide 17 of 71: Truthful Functional Beautiful Insightful Only basic functionalities are used in the map service Number of answers to the question "Which tool do you normally…
Slide 18 of 71: Truthful Functional Beautiful Insightful Enlightening Only basic functionalities are used in the map service Number of answers to the question "Which tool do…
Slide 19 of 71: Very nice but... HOW?
Slide 20 of 71: Steps Find the message Find the shape of the data
Slide 21 of 71: What is the right graph for a dataset?
Slide 22 of 71: Alternative 1: follow a guideline
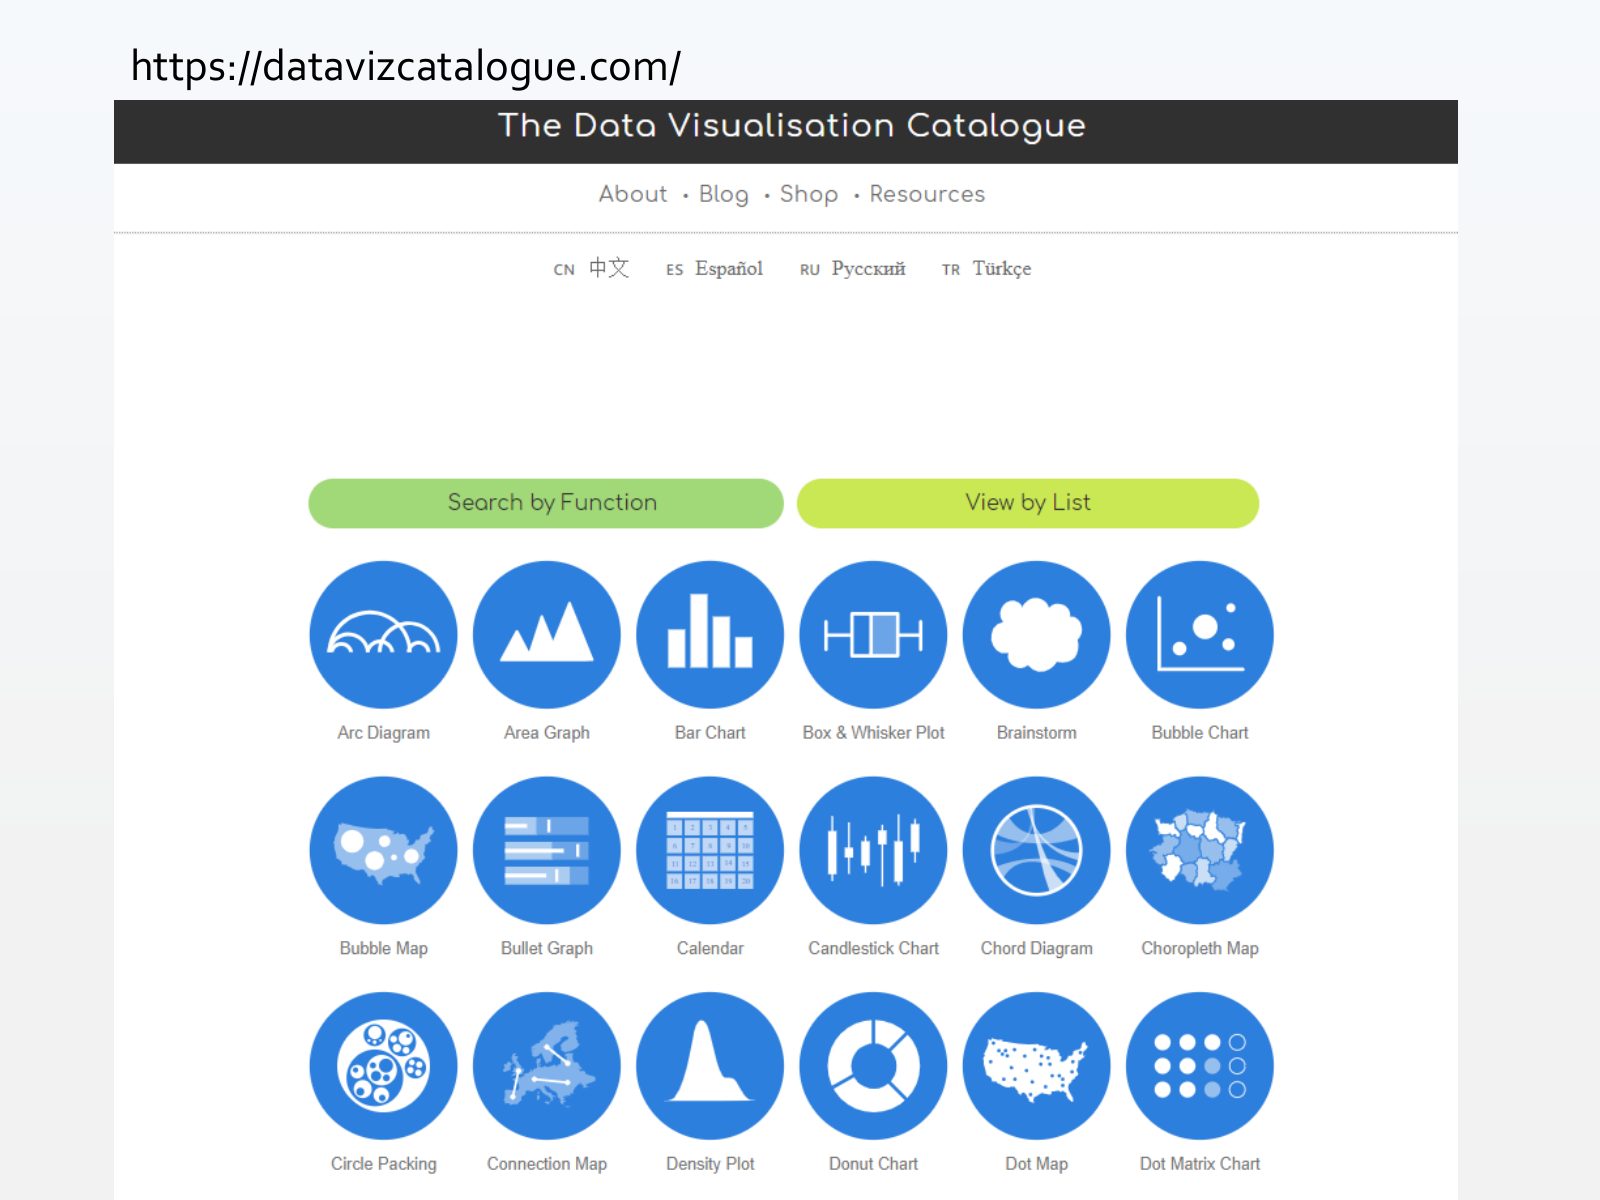
Slide 23 of 71: https://datavizcatalogue.com/
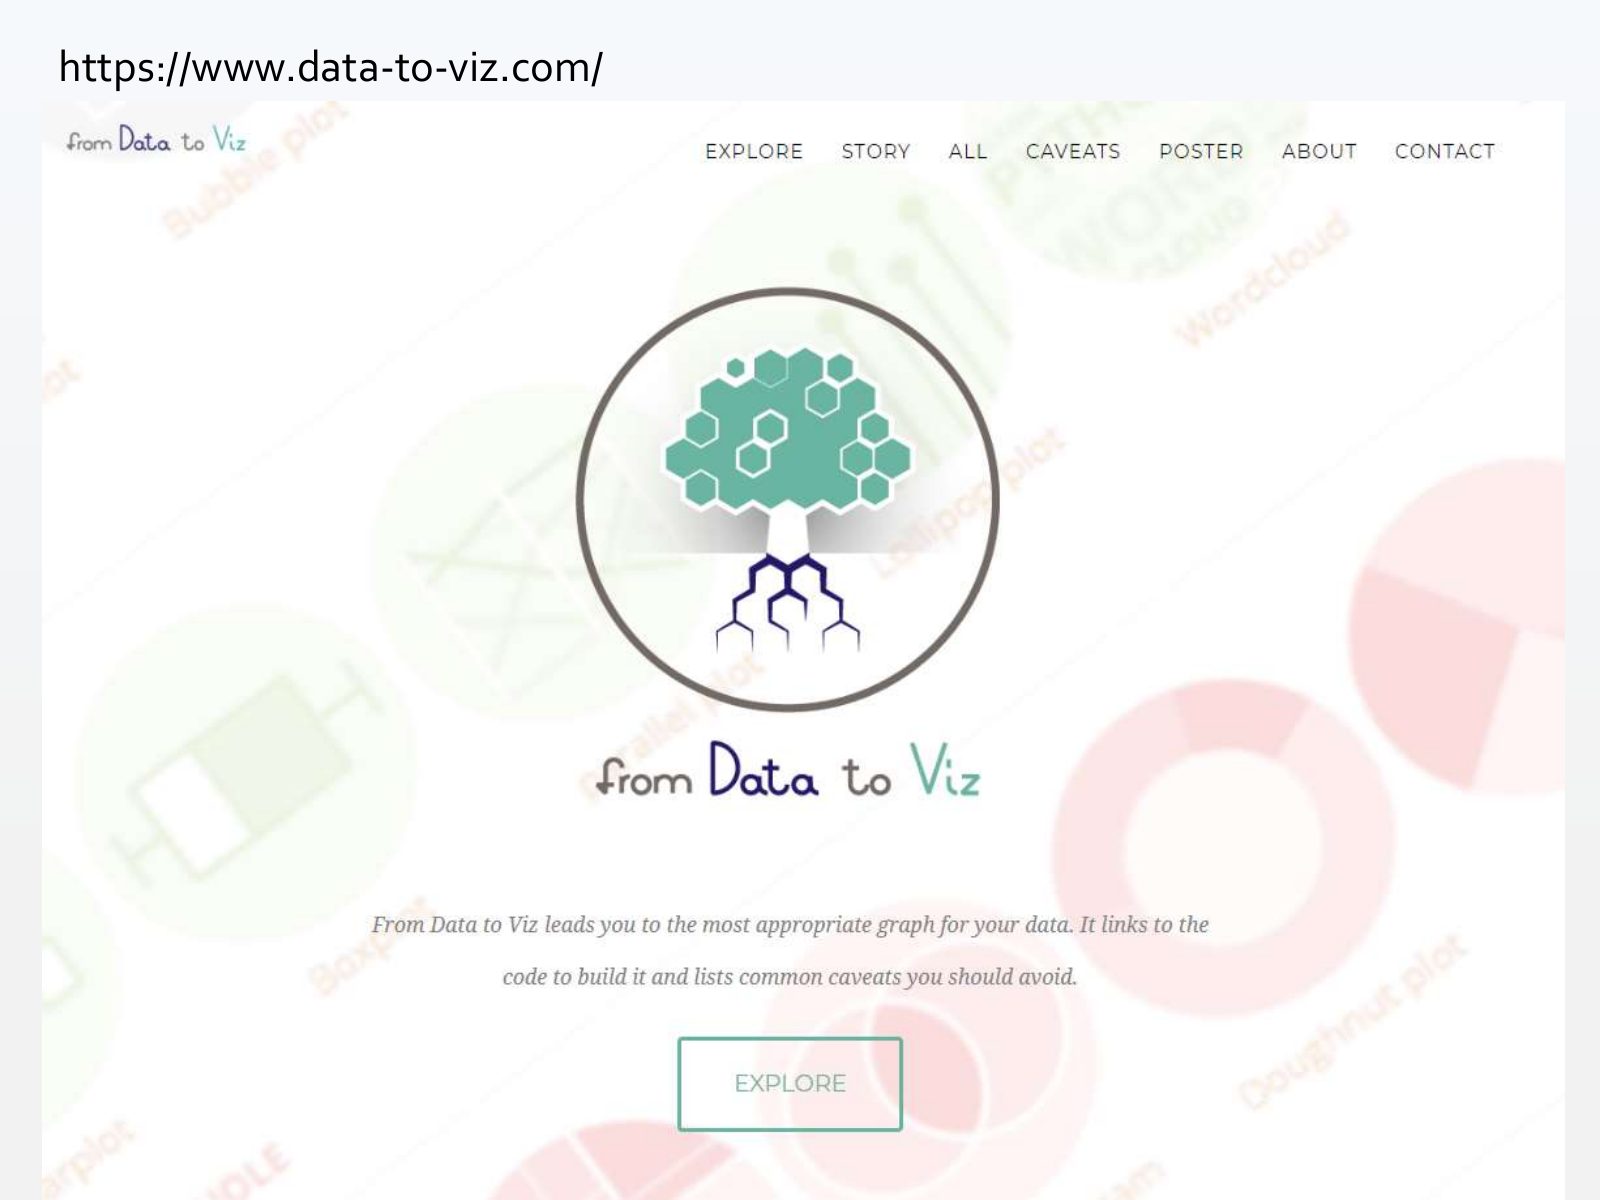
Slide 24 of 71: https://www.data-to-viz.com/
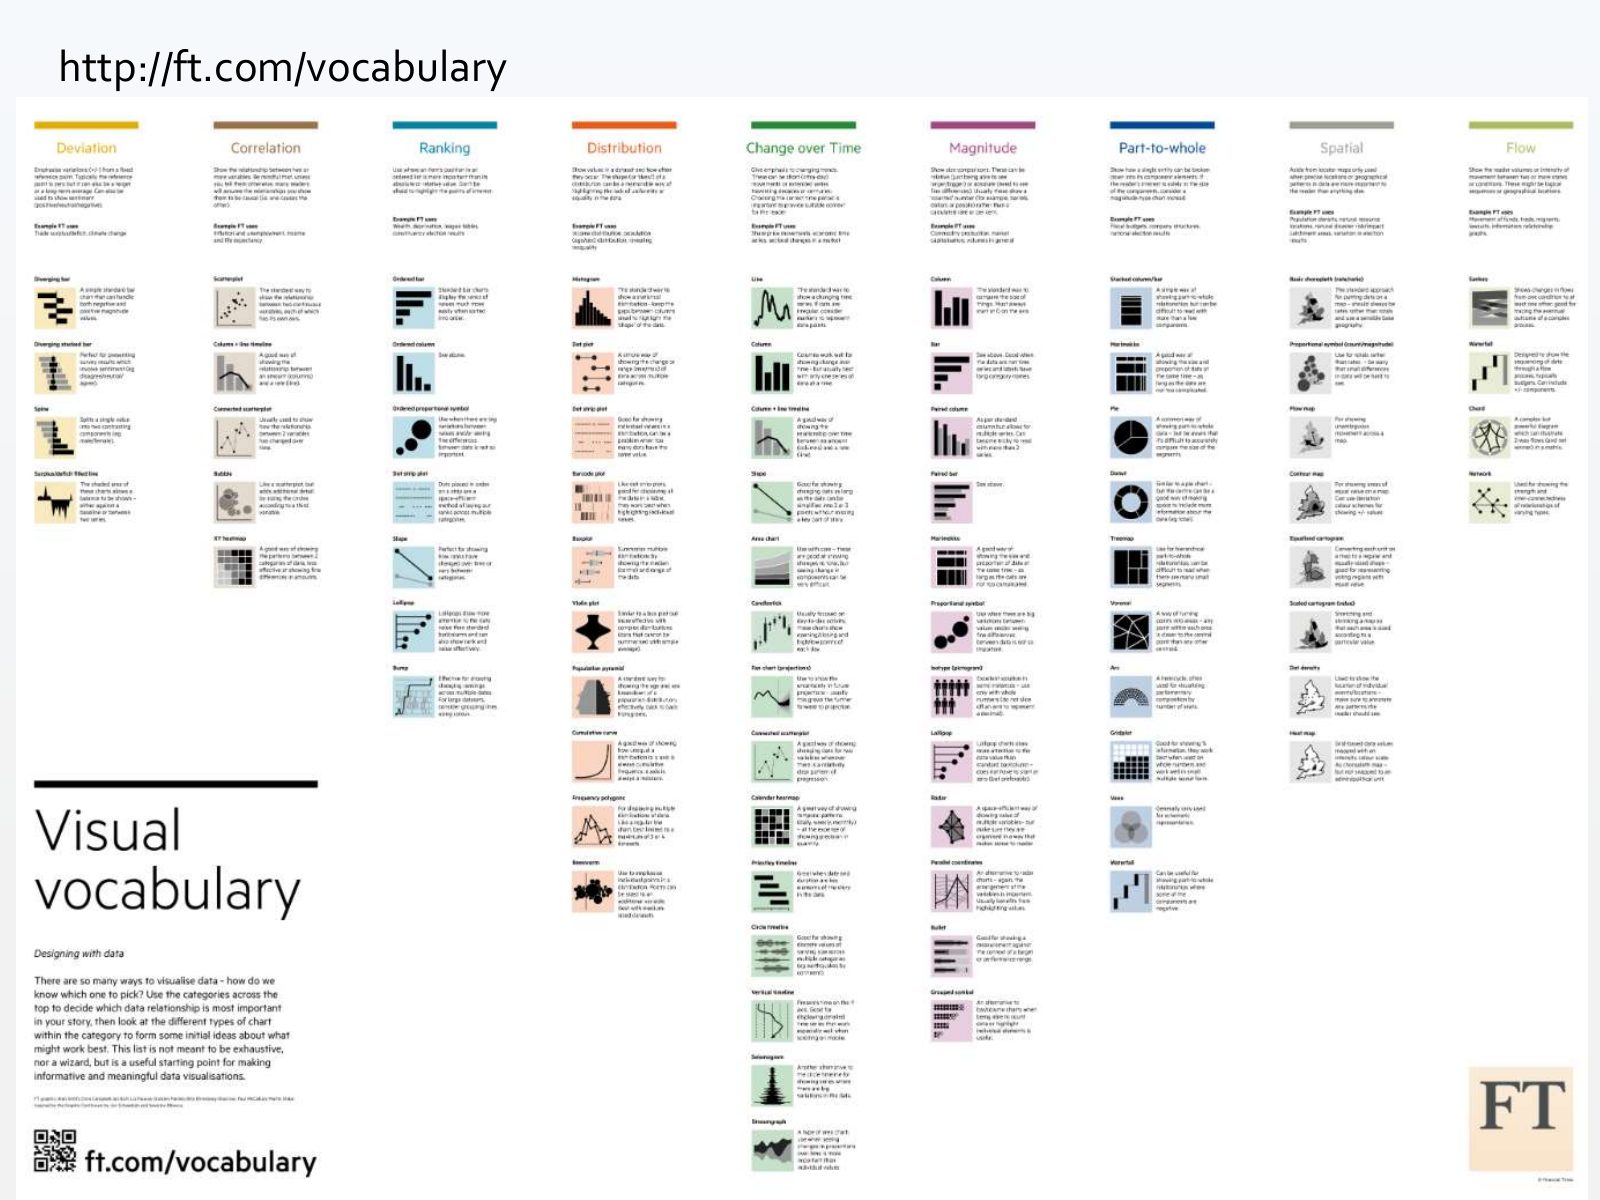
Slide 25 of 71: http://ft.com/vocabulary
Slide 26 of 71: Alternative 2: learn the basics
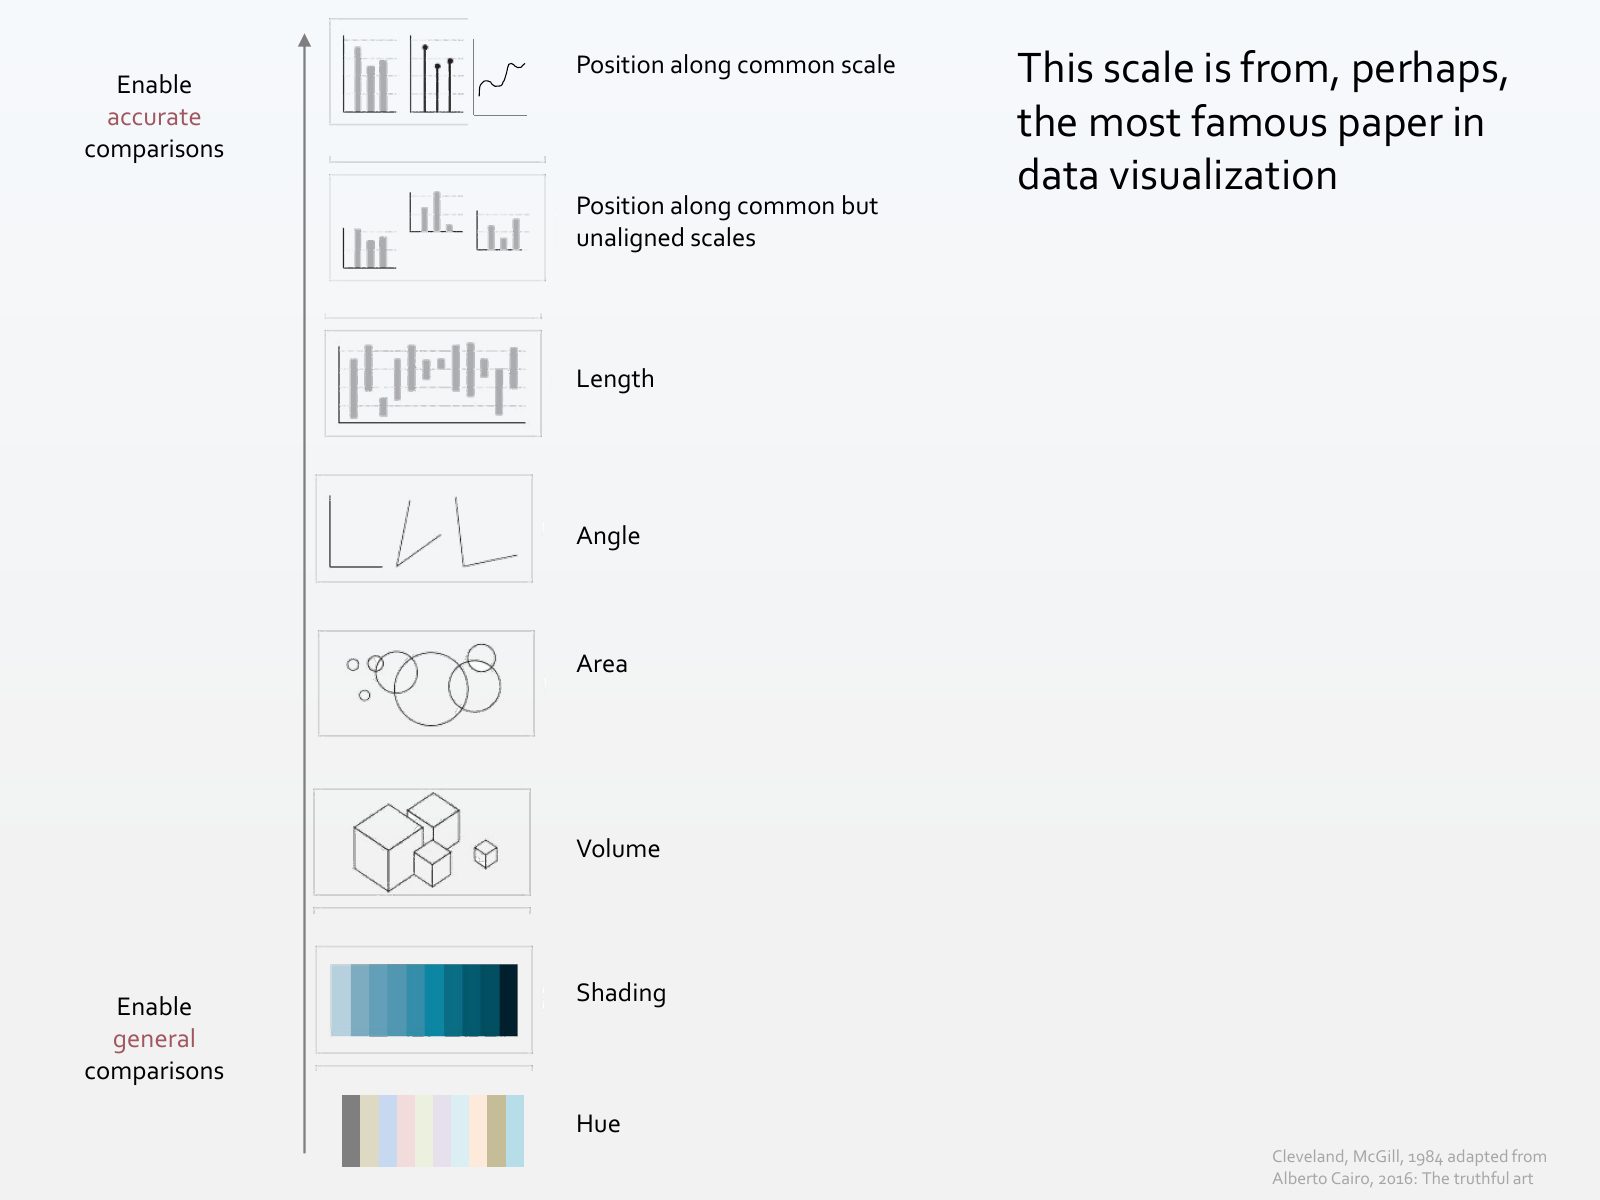
Slide 27 of 71: Enable Position along common scale This scale is from, perhaps, accurate comparisons the most famous paper in data visualization Position along common but un…
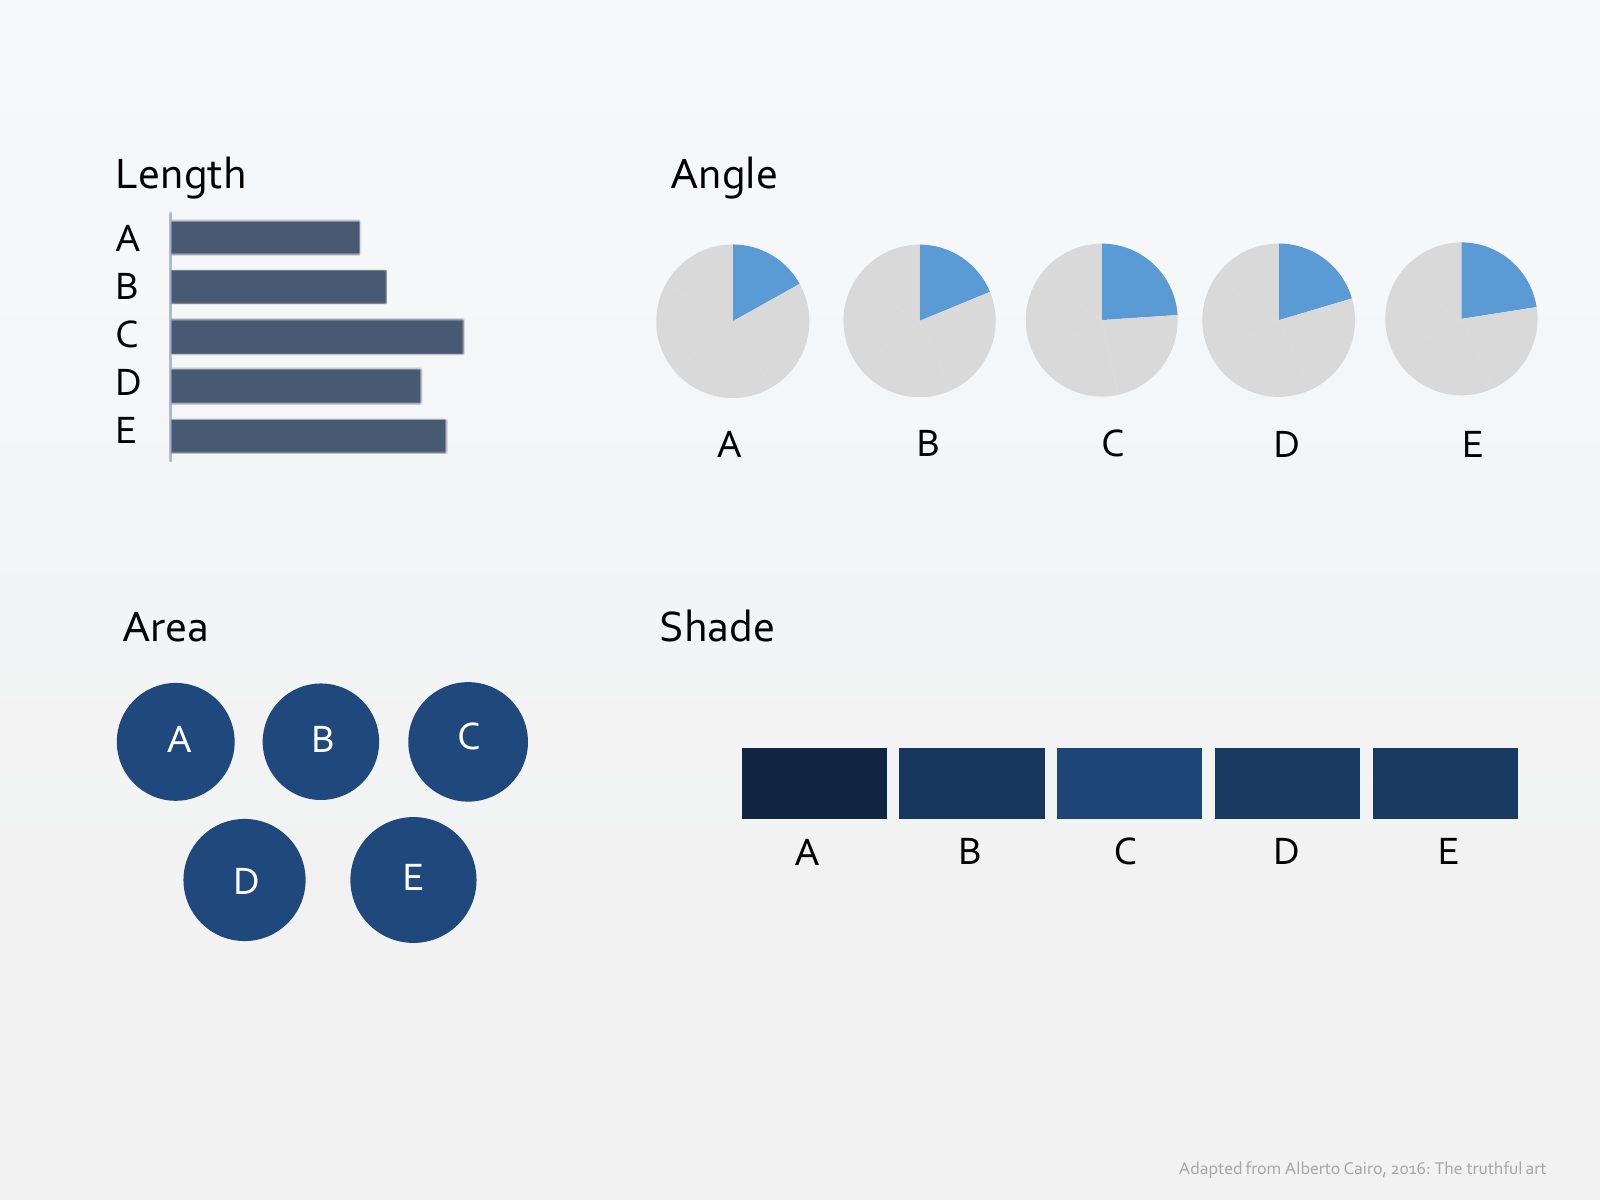
Slide 28 of 71: Let’s put it in practice. What’s the best way to compare this data?
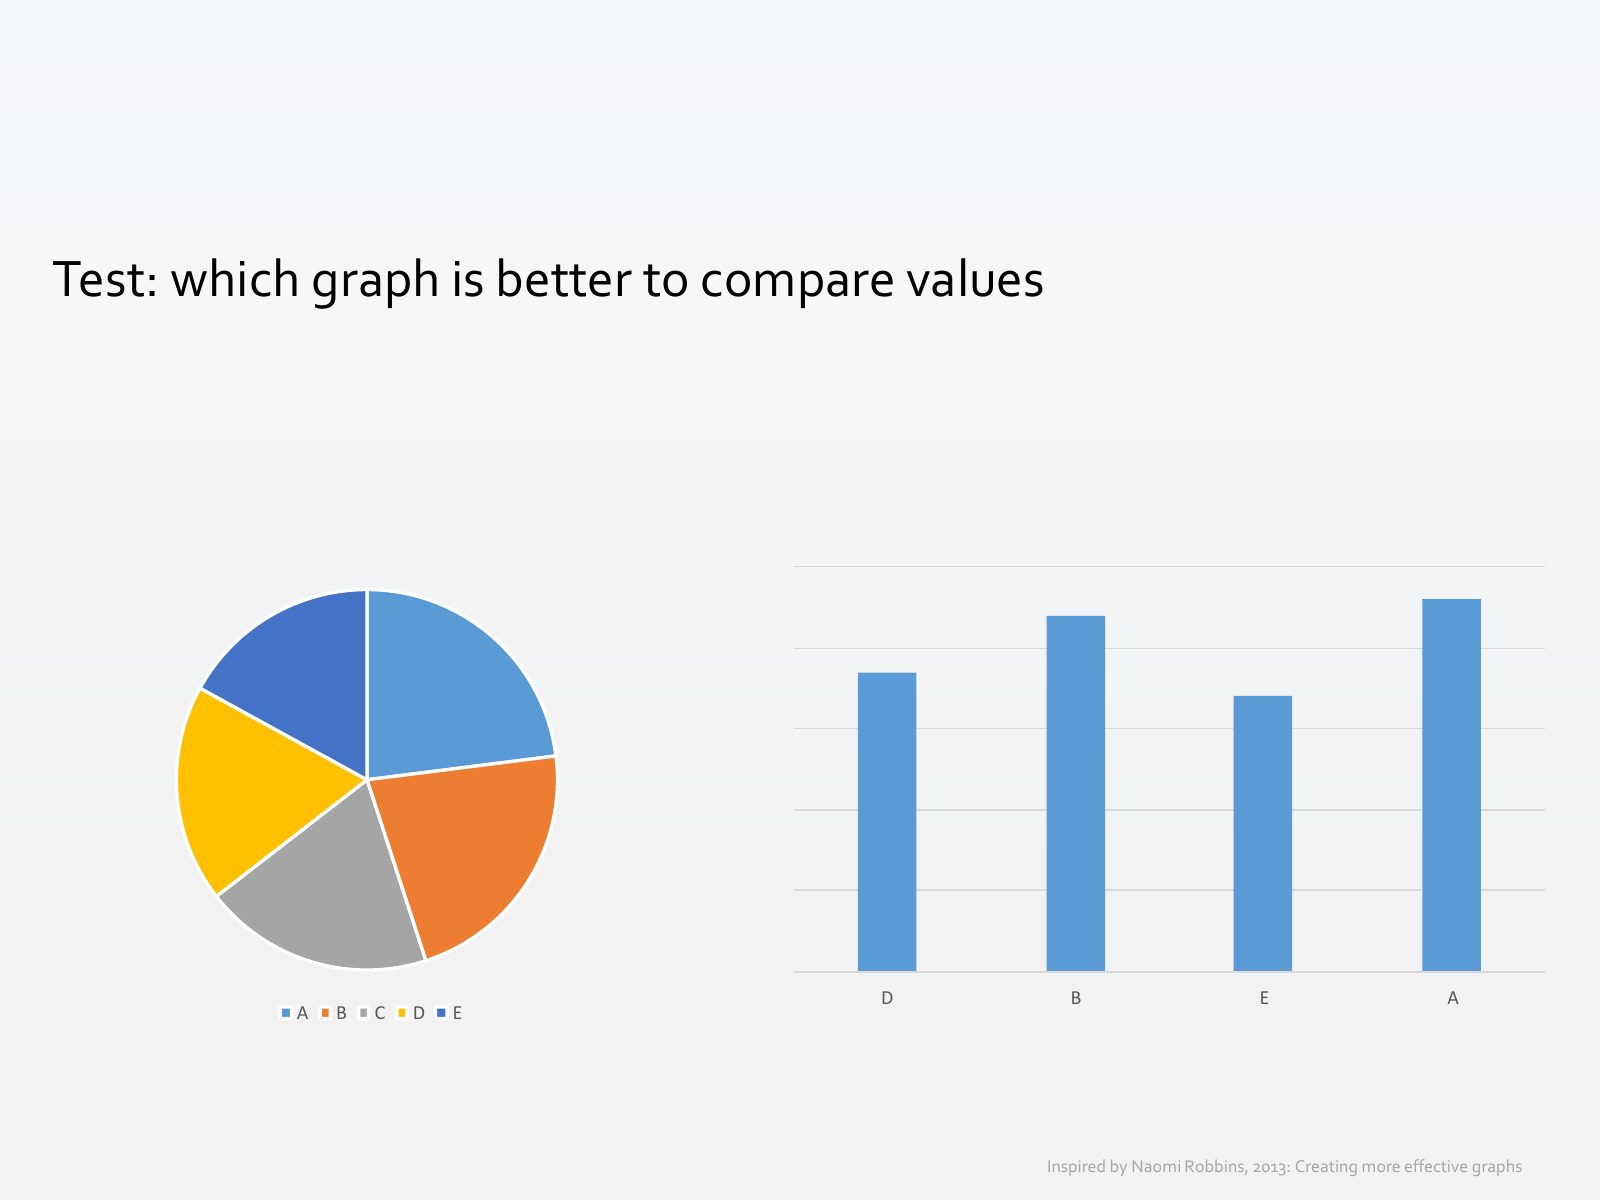
Slide 29 of 71: Length Angle A B C D E A B C D E Area Shade A B C A B C D E D E Adapted from Alberto Cairo, 2016: The truthful art
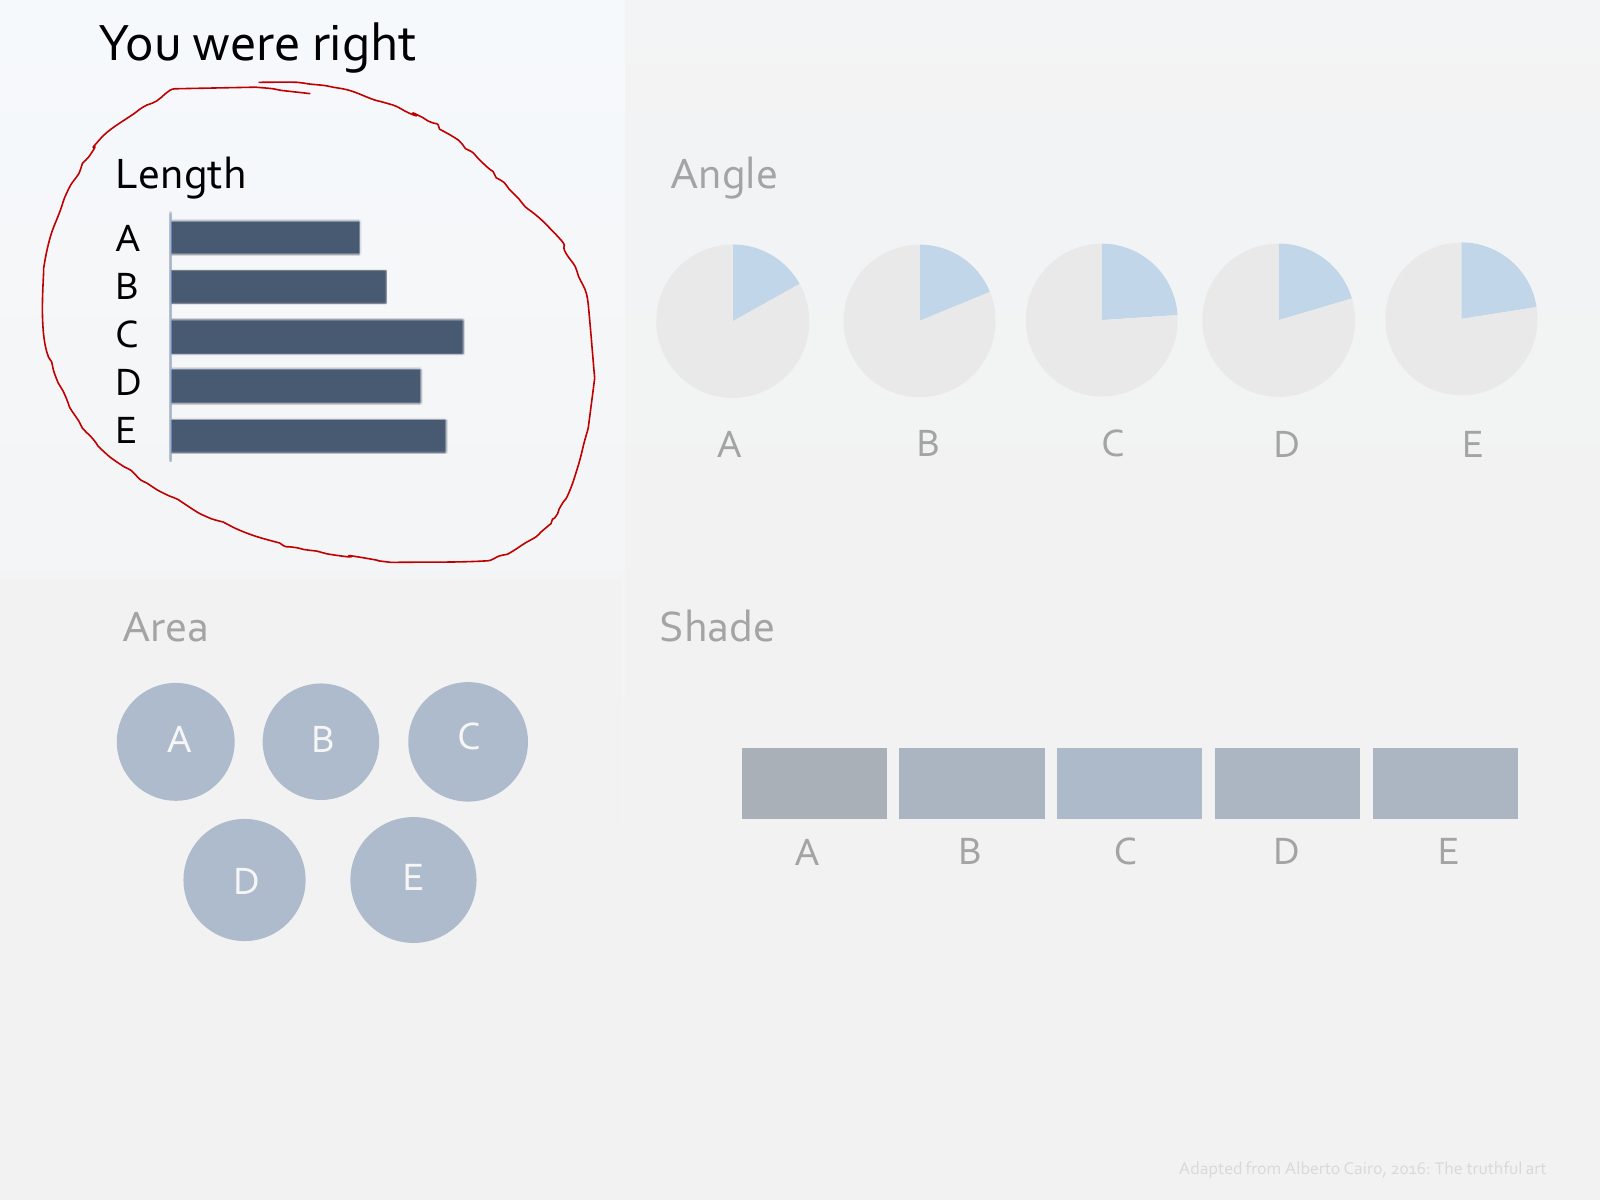
Slide 30 of 71: You were right Length Angle A B C D E A B C D E Area Shade A B C A B C D E D E Adapted from Alberto Cairo, 2016: The truthful art
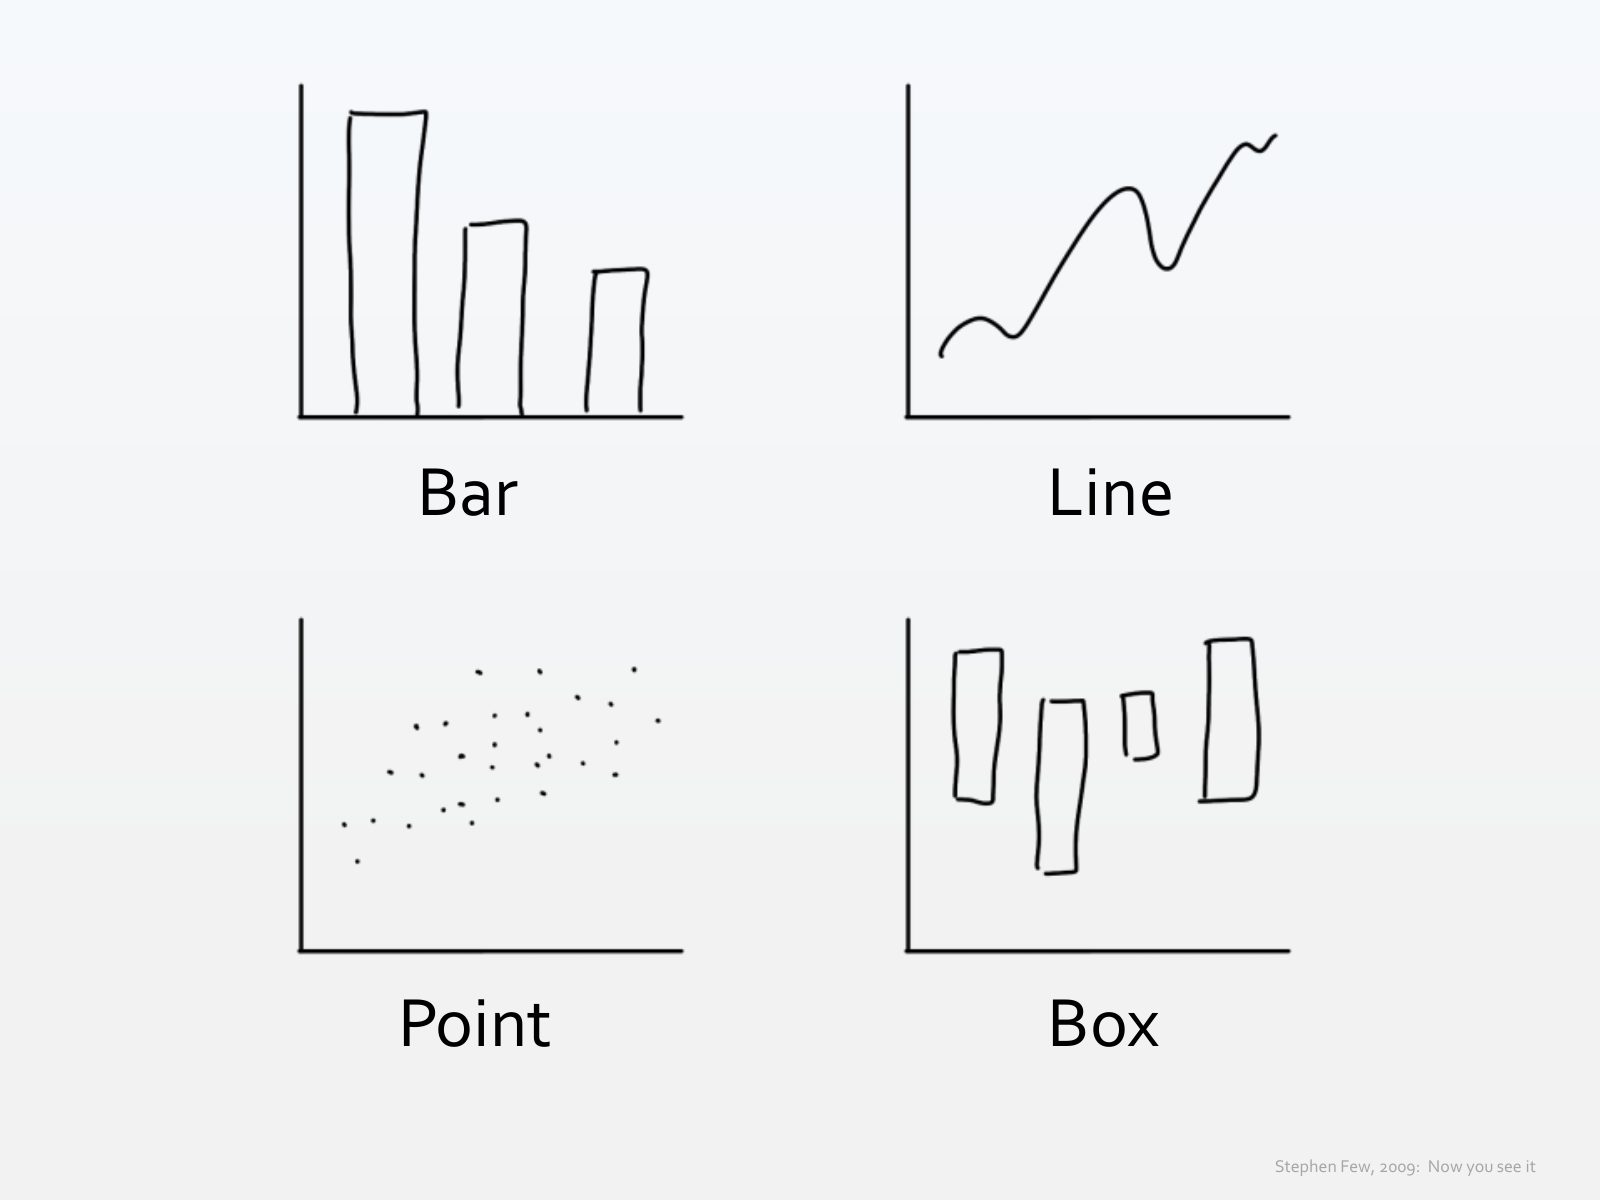
Slide 31 of 71: In fact, according to data visualization author Stephen Few, most quantitative analyses can be performed effectively with only four graphs...
Slide 32 of 71: Bar Line Point Box Stephen Few, 2009: Now you see it
Slide 33 of 71: Hold on... where are the pies?
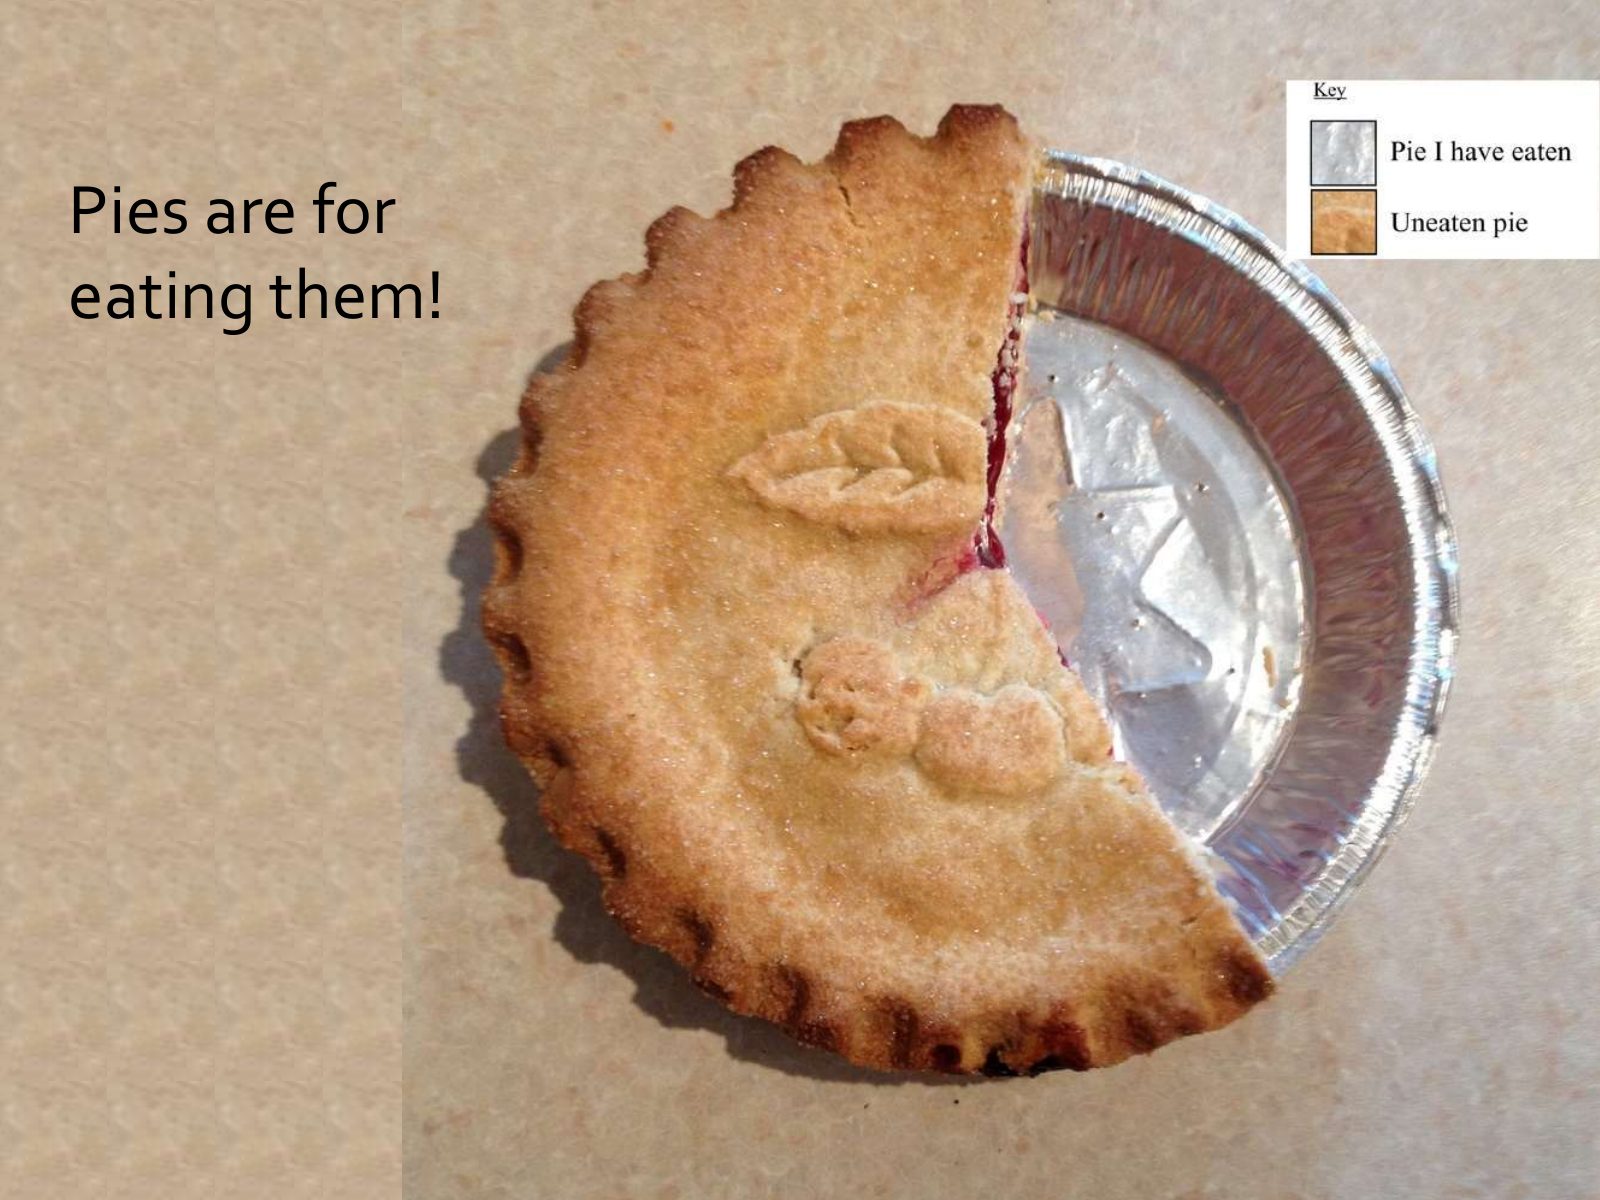
Slide 34 of 71: Pies are for eating them!
Slide 35 of 71: Test: which graph is better to compare values D B E A A B C D E Inspired by Naomi Robbins, 2013: Creating more effective graphs
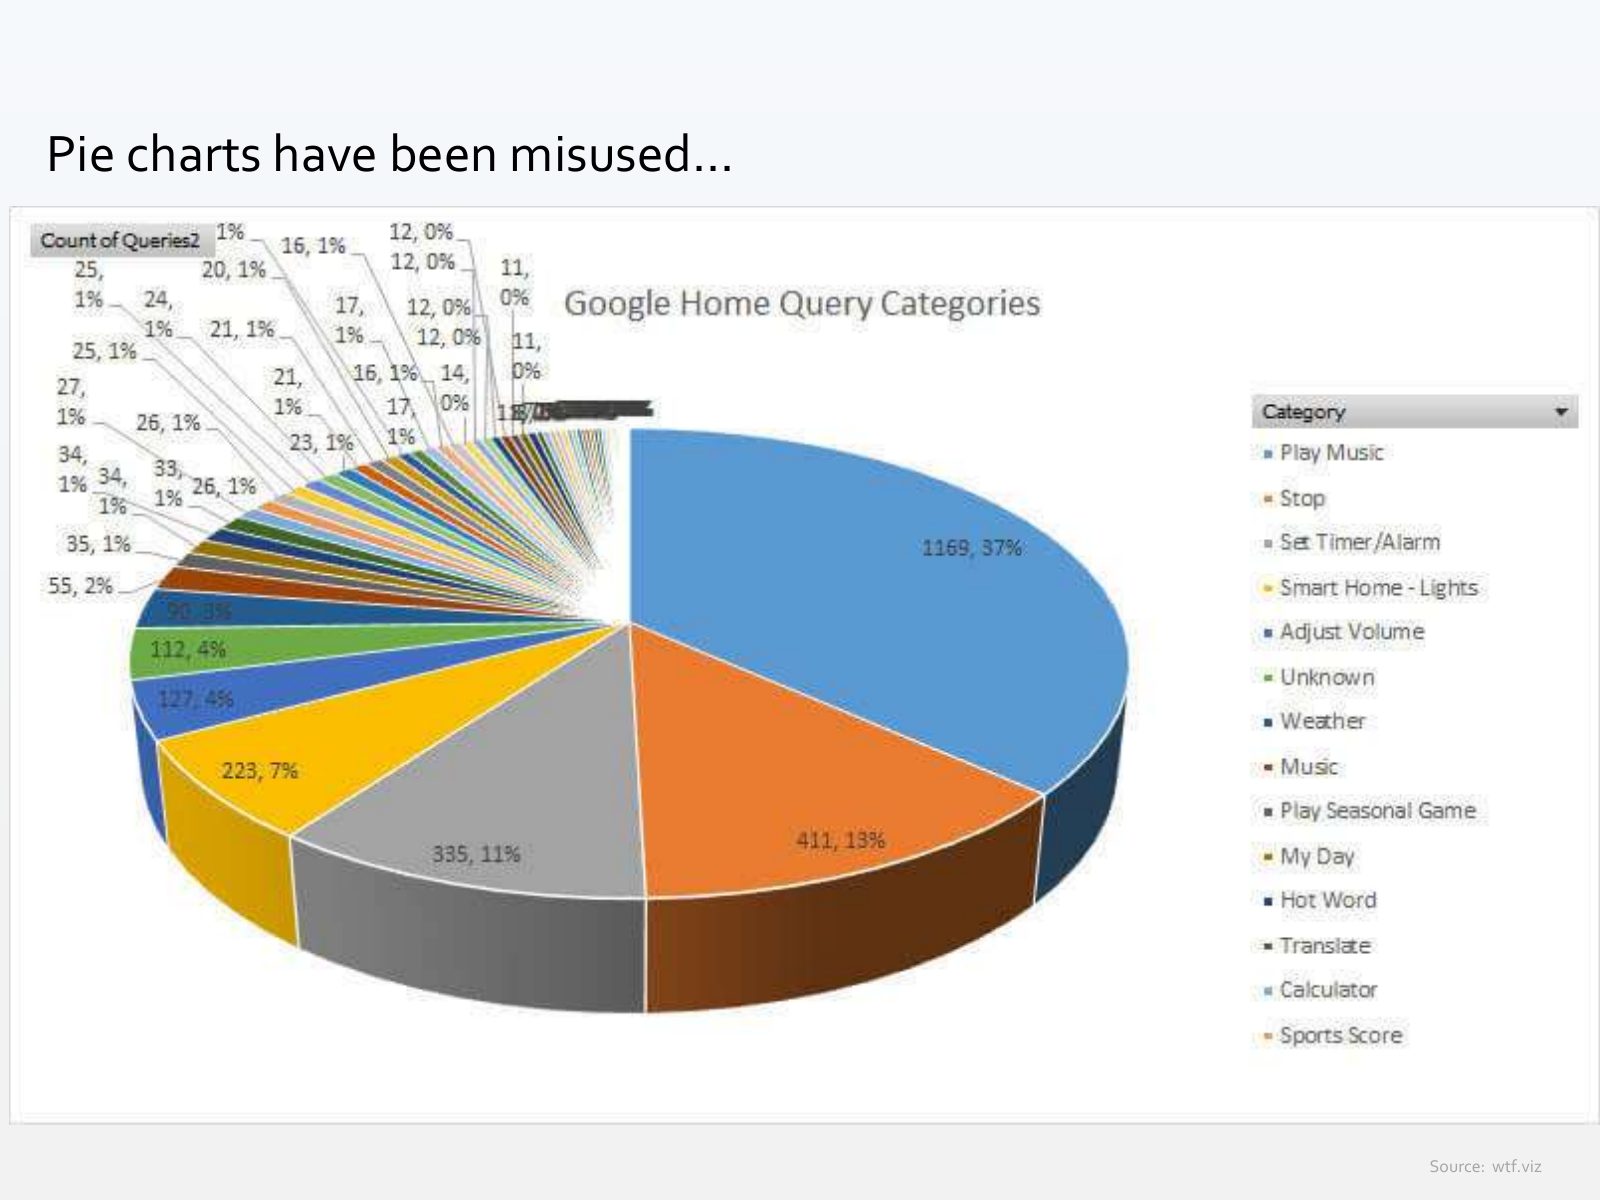
Slide 36 of 71: Pie charts have been misused... Source: wtf.viz
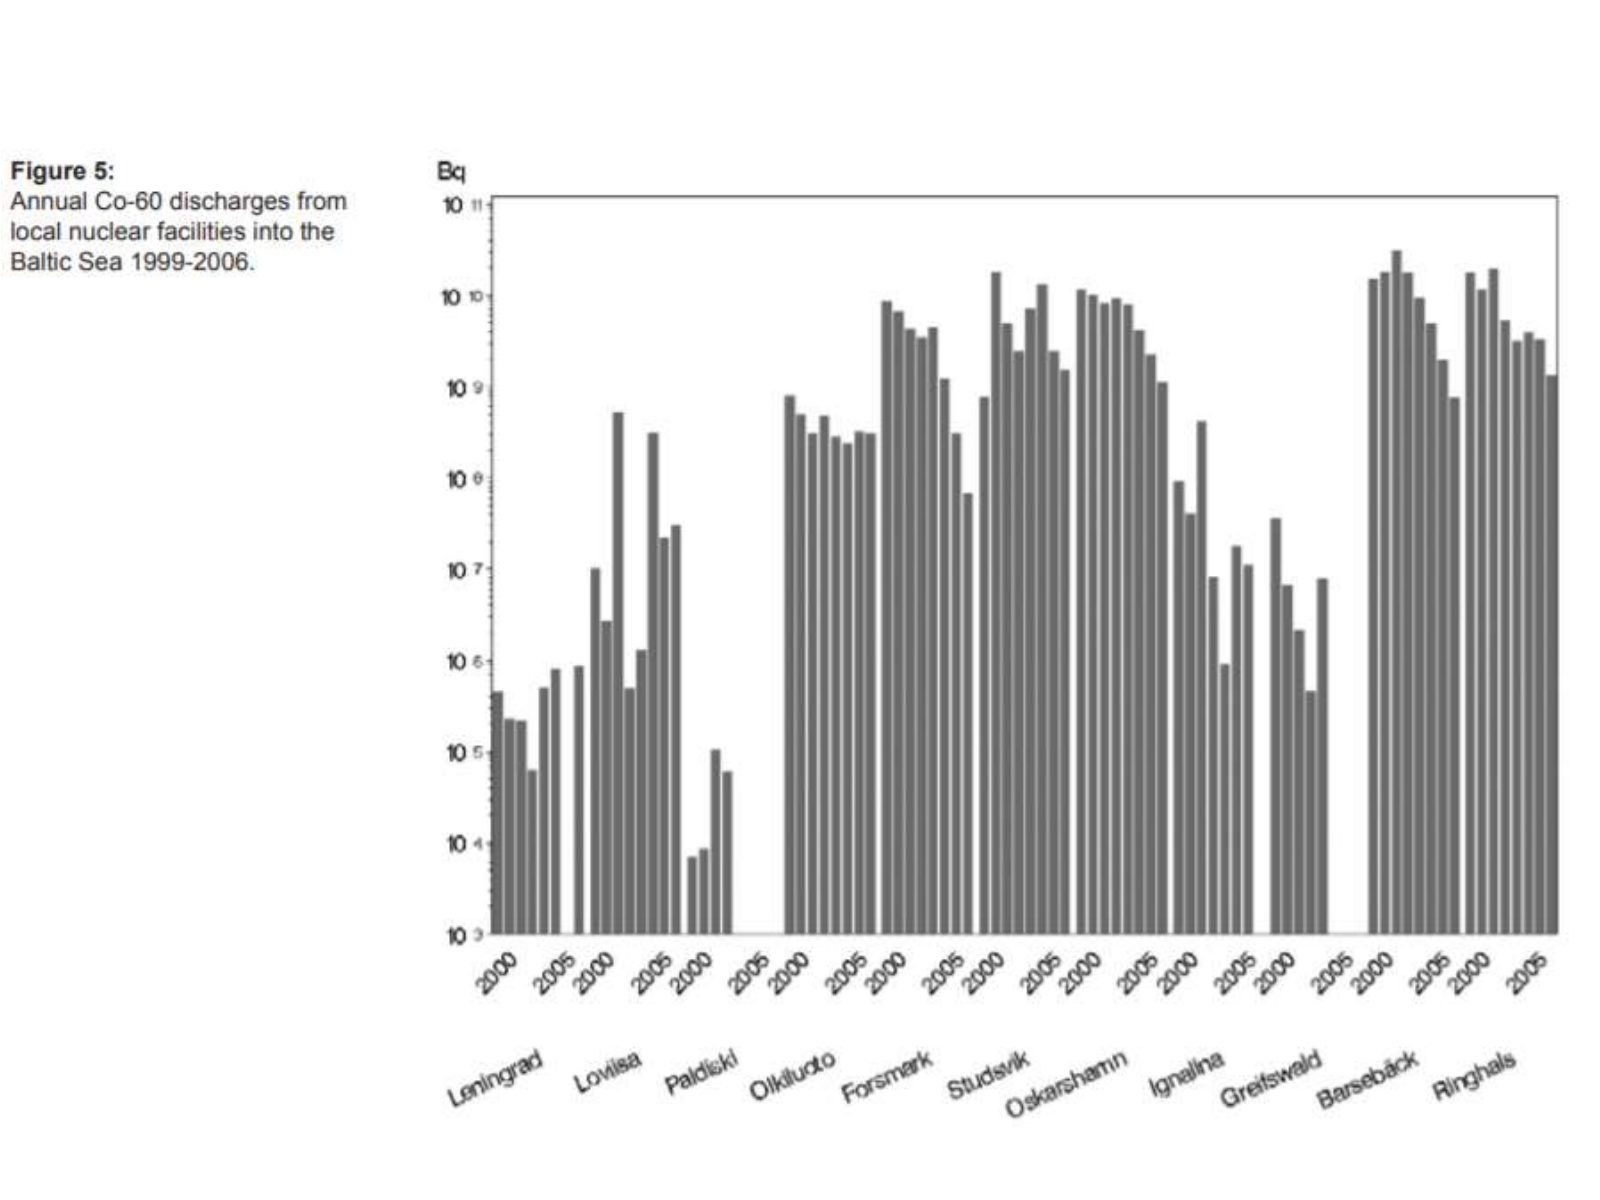
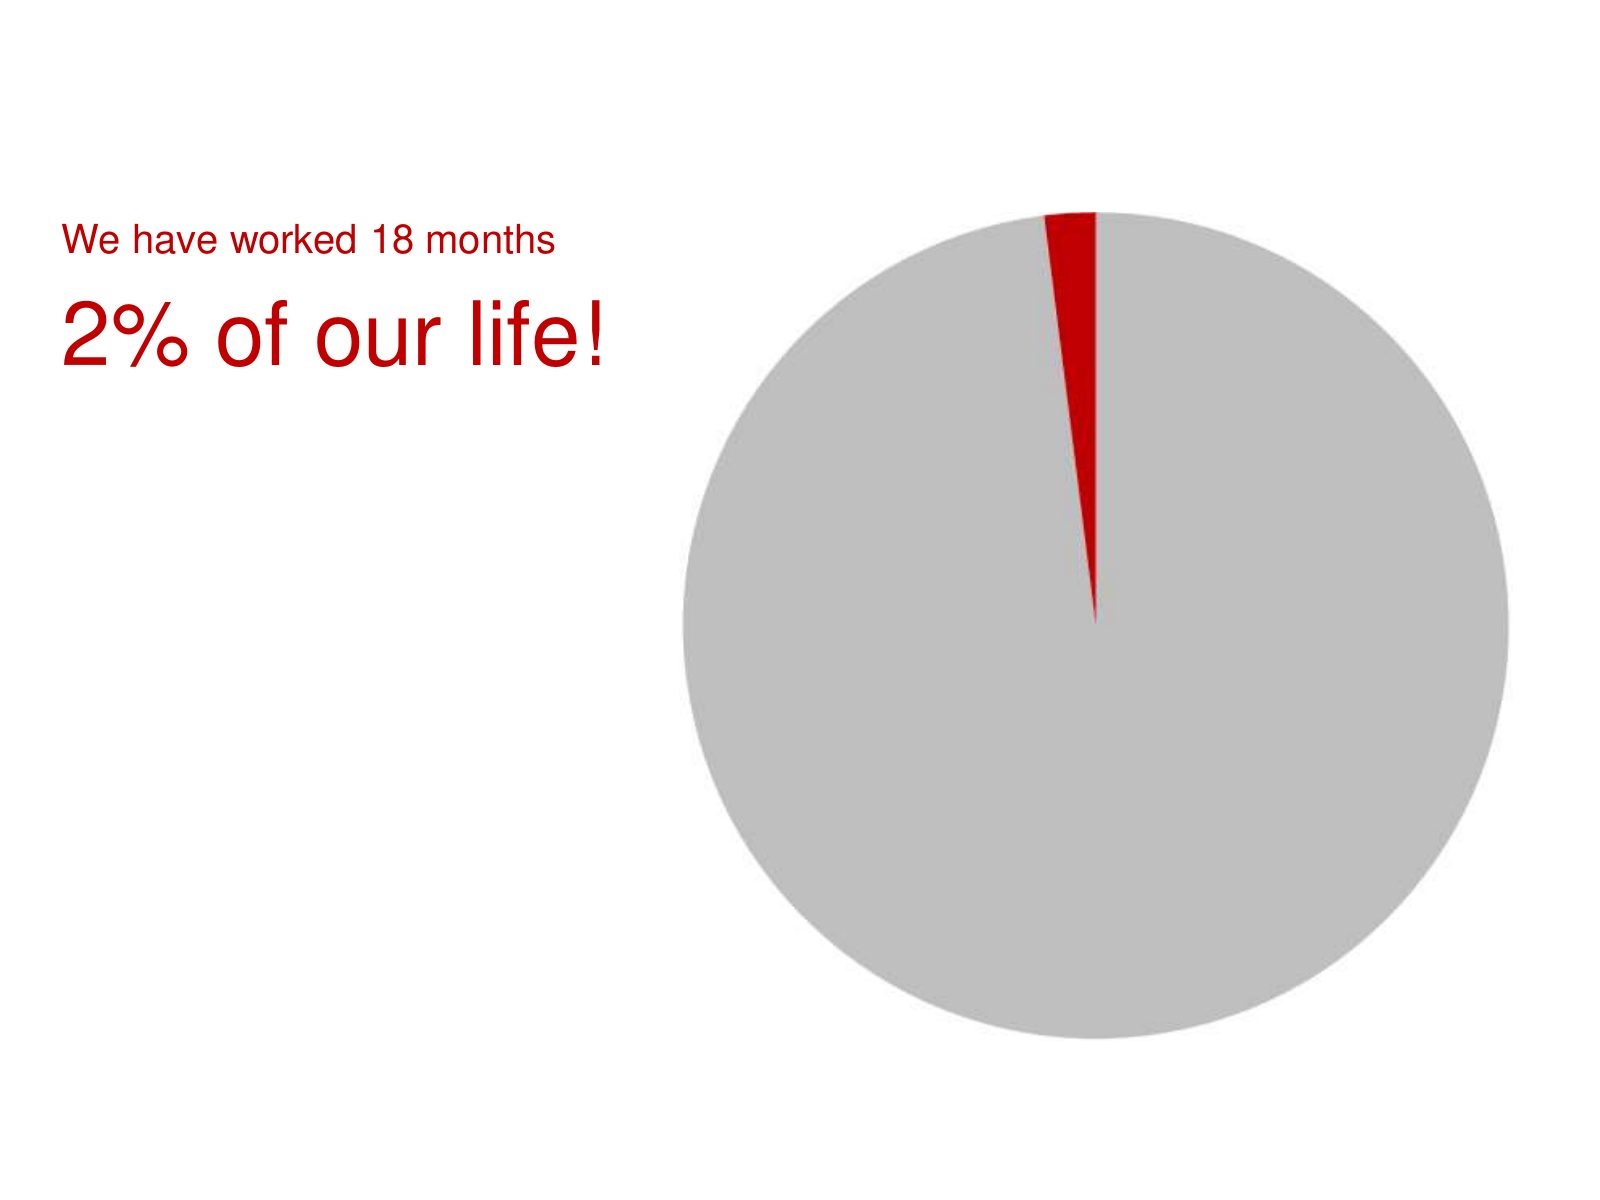
Slide 37 of 71: However, I don't think they are always bad. The next slide was shown at the Plan Bothnia project final conference. We wanted to show how much time we spent w…
Slide 38 of 71: We have worked 18 months 2% of our life!
Slide 39 of 71: Exercise Is it effective? Why? Is there a better alternative? Sketch
Slide 40 of 71: picture slide without text
Slide 41 of 71: picture slide without text
Slide 42 of 71: picture slide without text
Slide 43 of 71: What about other graphs besides bar, line, point and box?
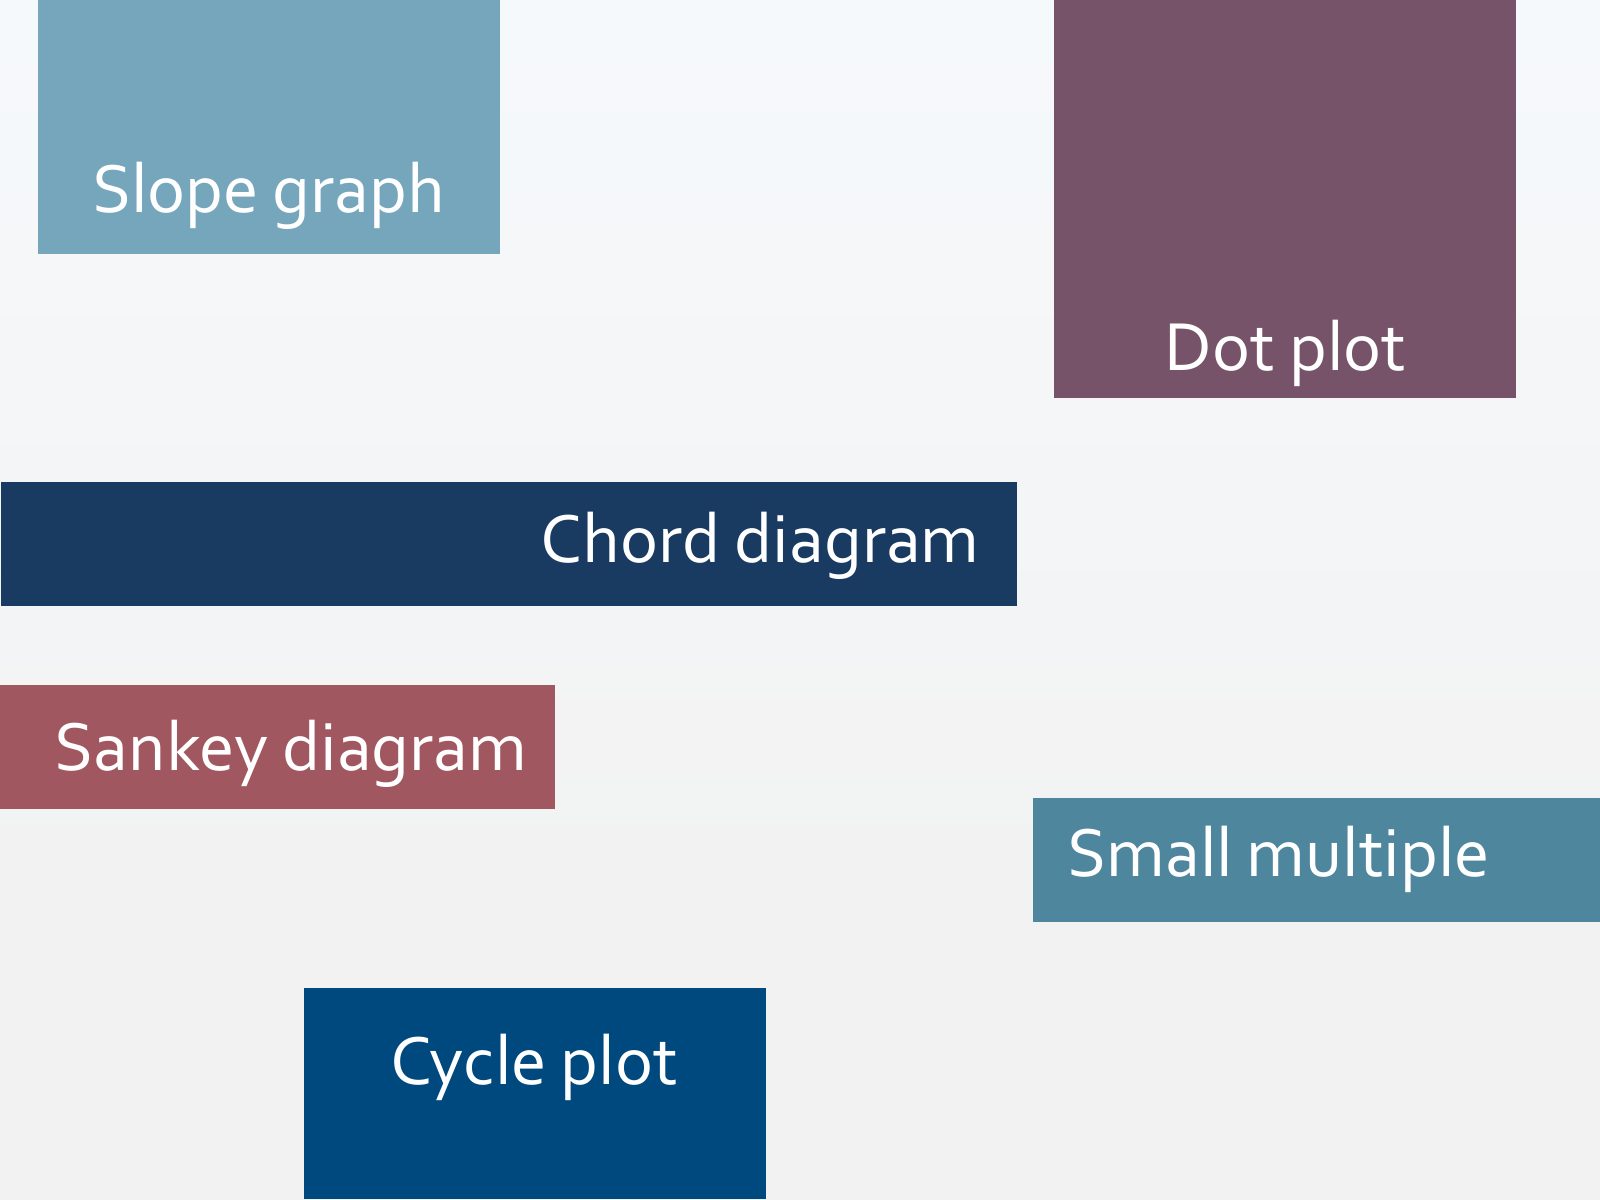
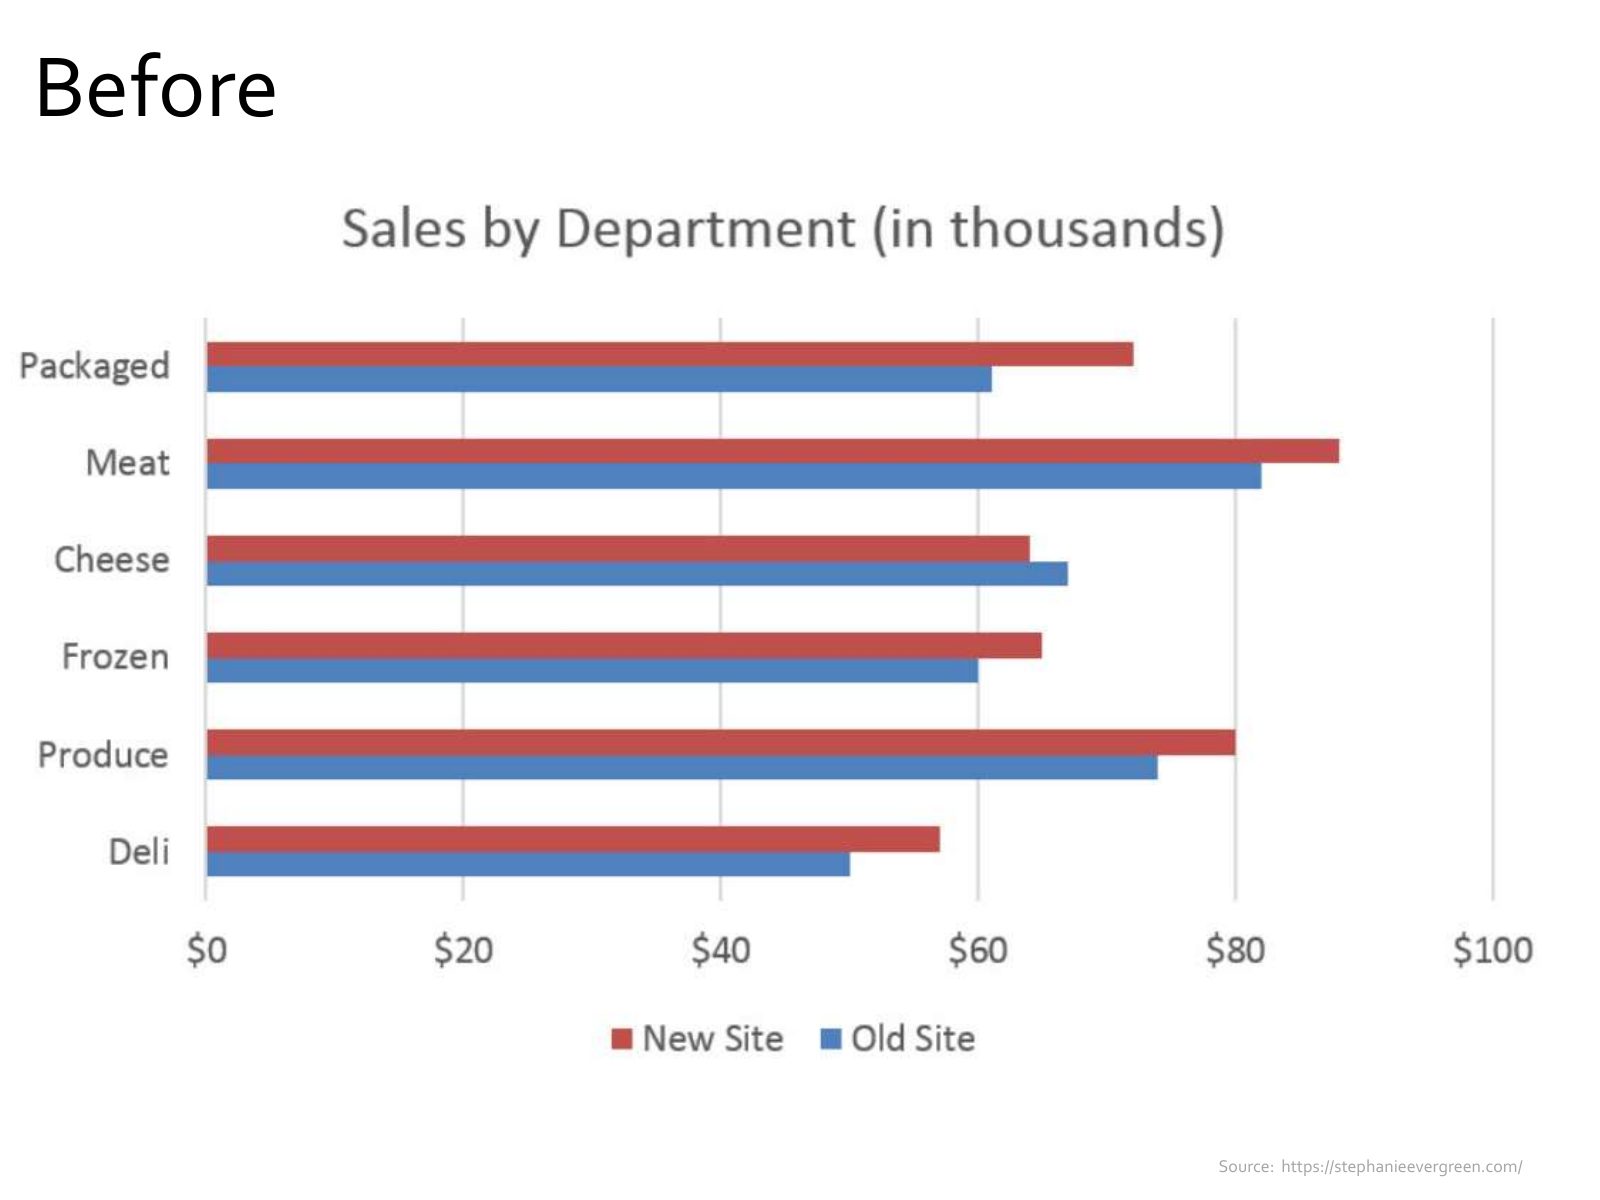
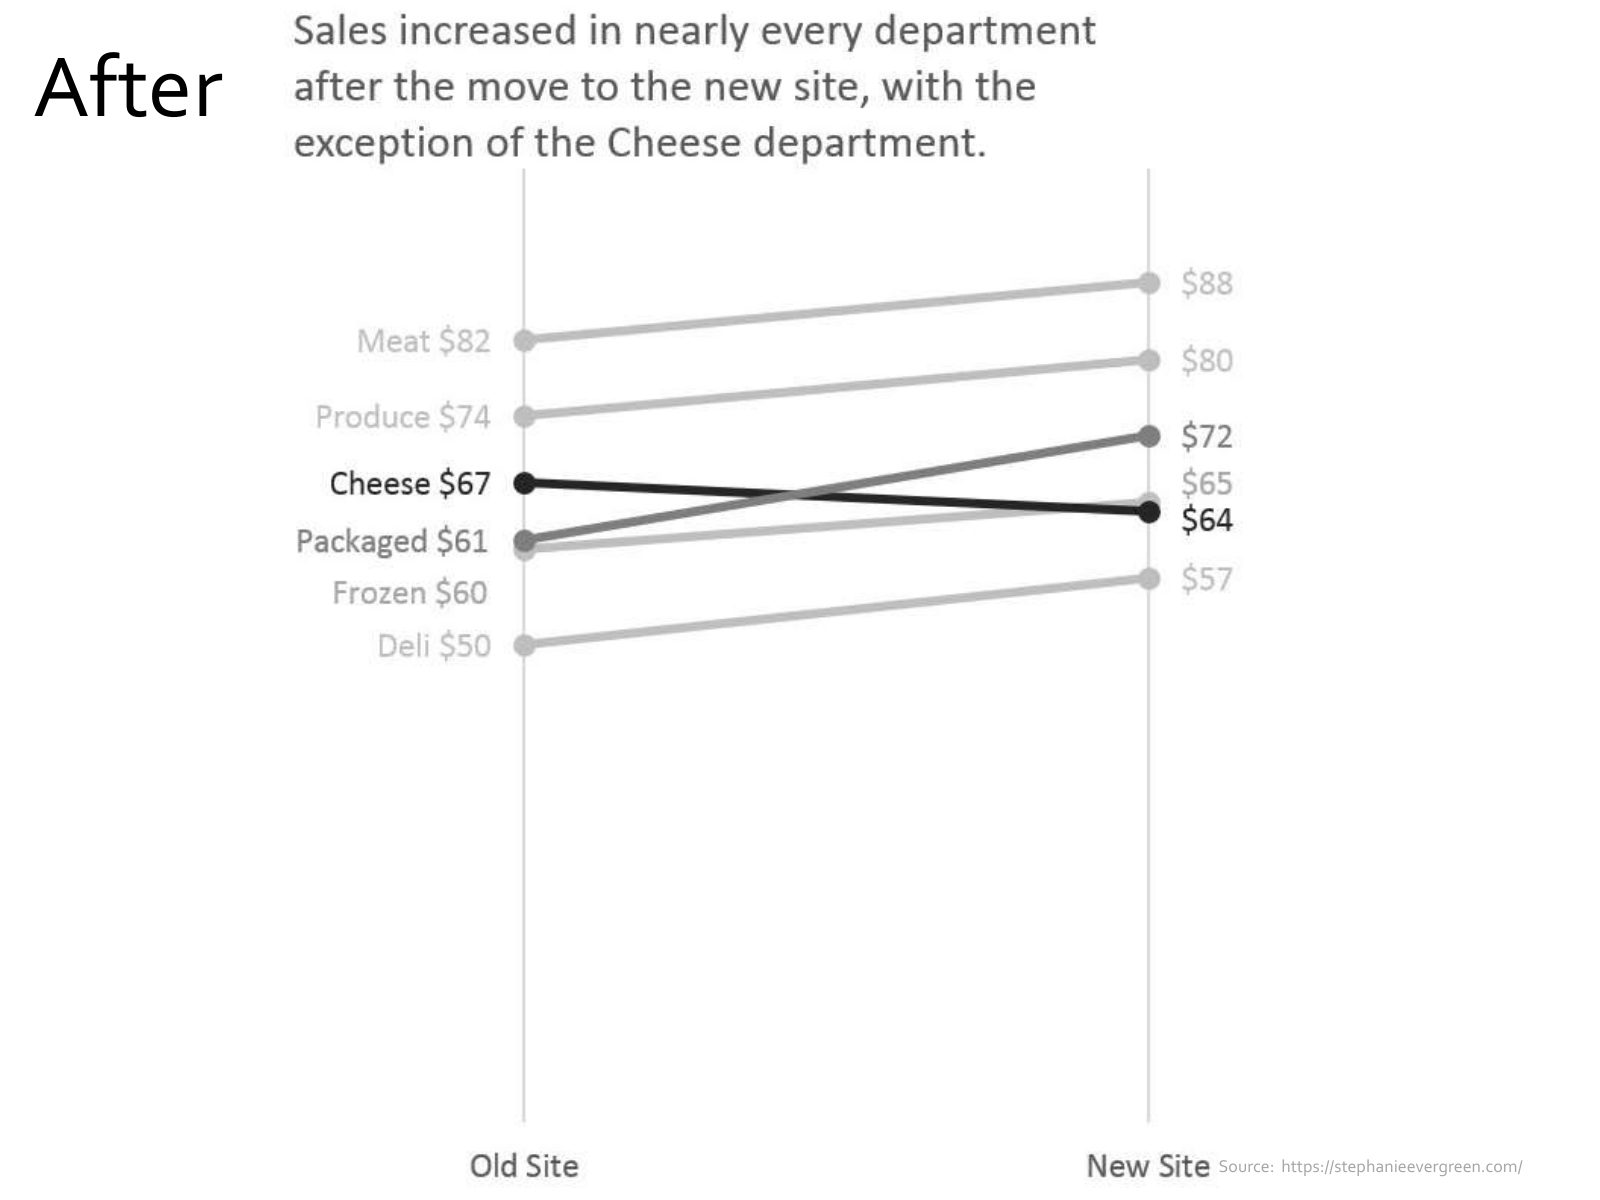
Slide 44 of 71: Slope graph Dot plot Chord diagram Sankey diagram Small multiple Cycle plot
Slide 45 of 71: Slope graph
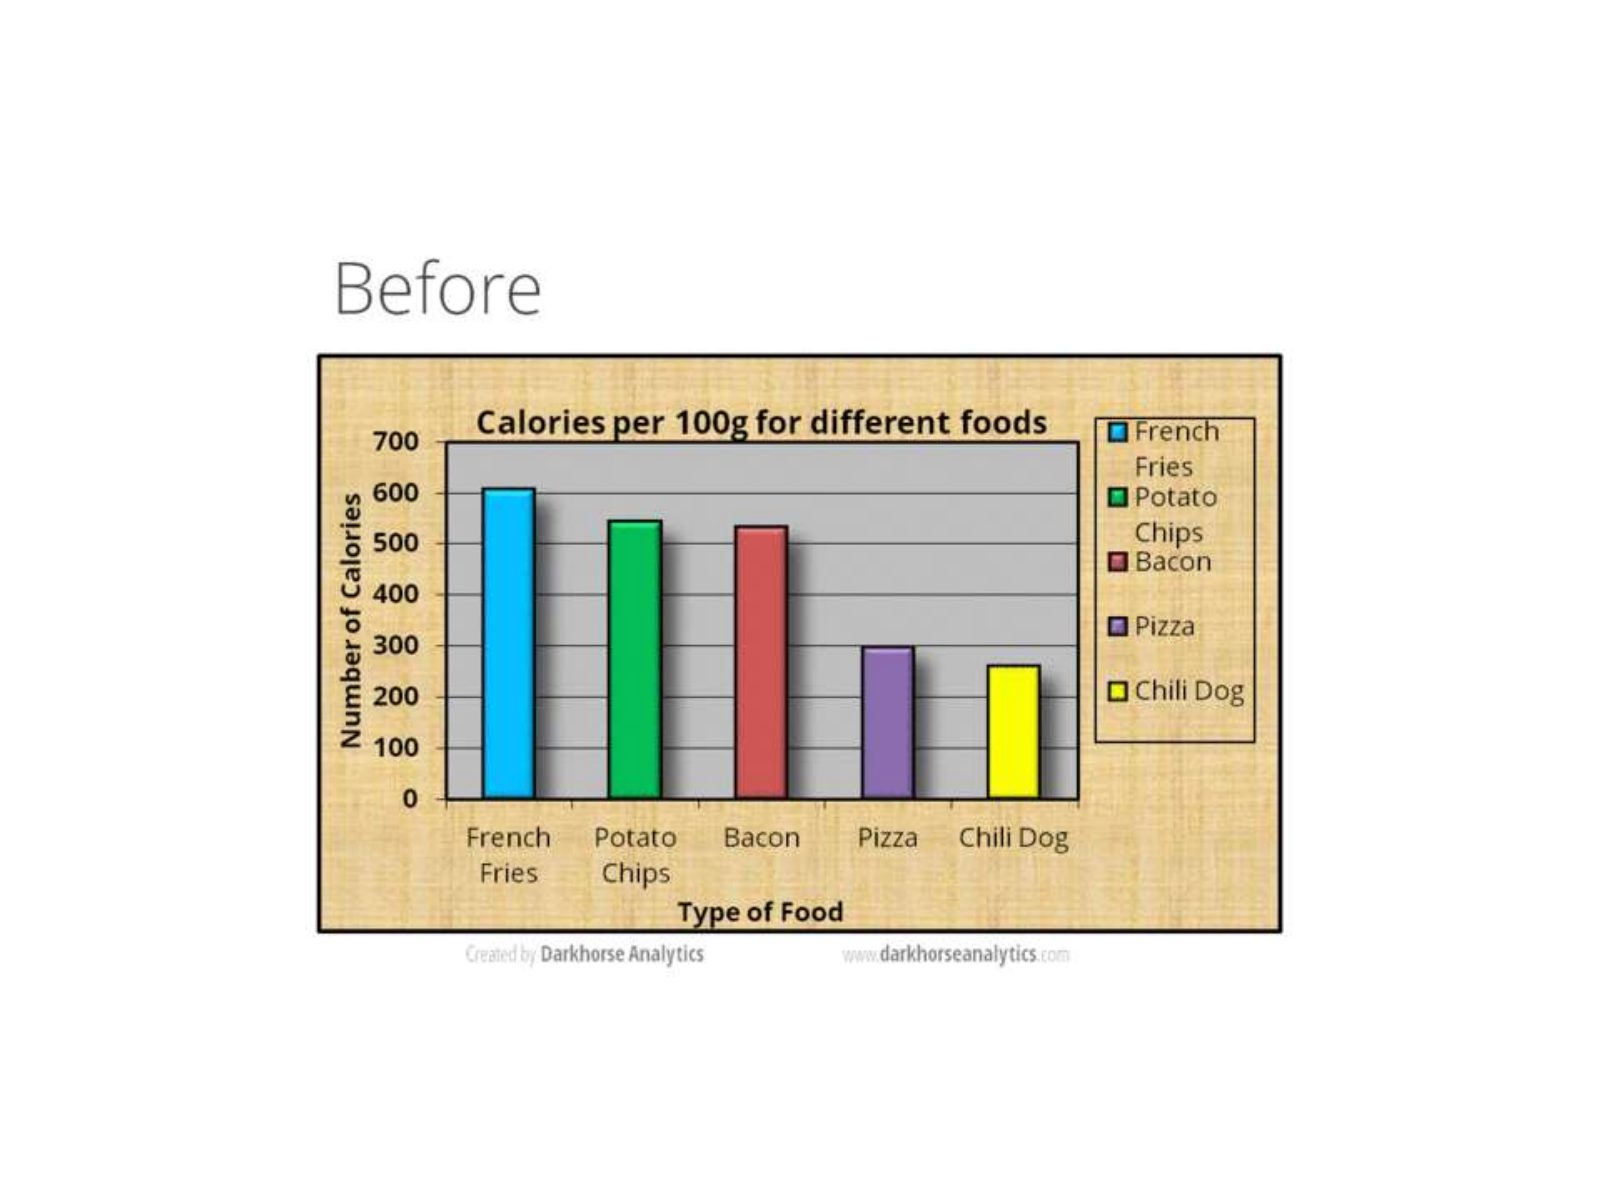
Slide 46 of 71: Before Source: https://stephanieevergreen.com/
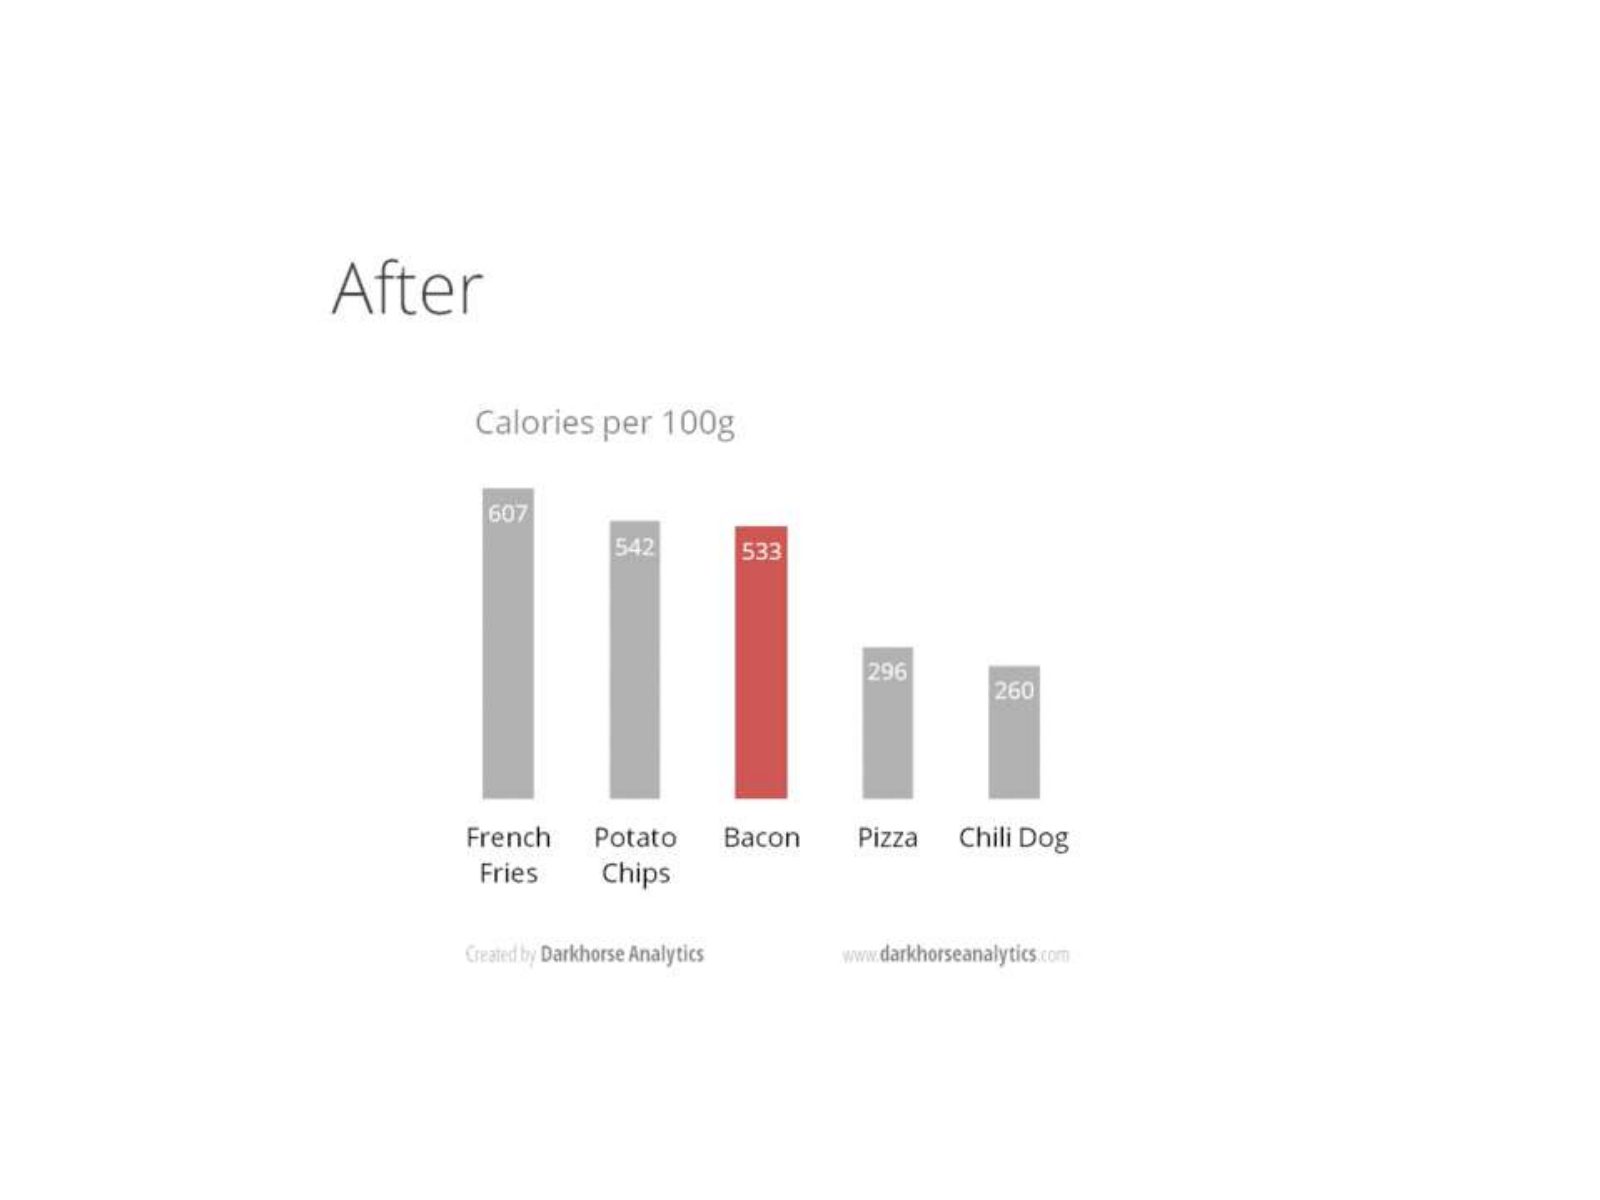
Slide 47 of 71: After Source: https://stephanieevergreen.com/
Slide 48 of 71: Dot plot
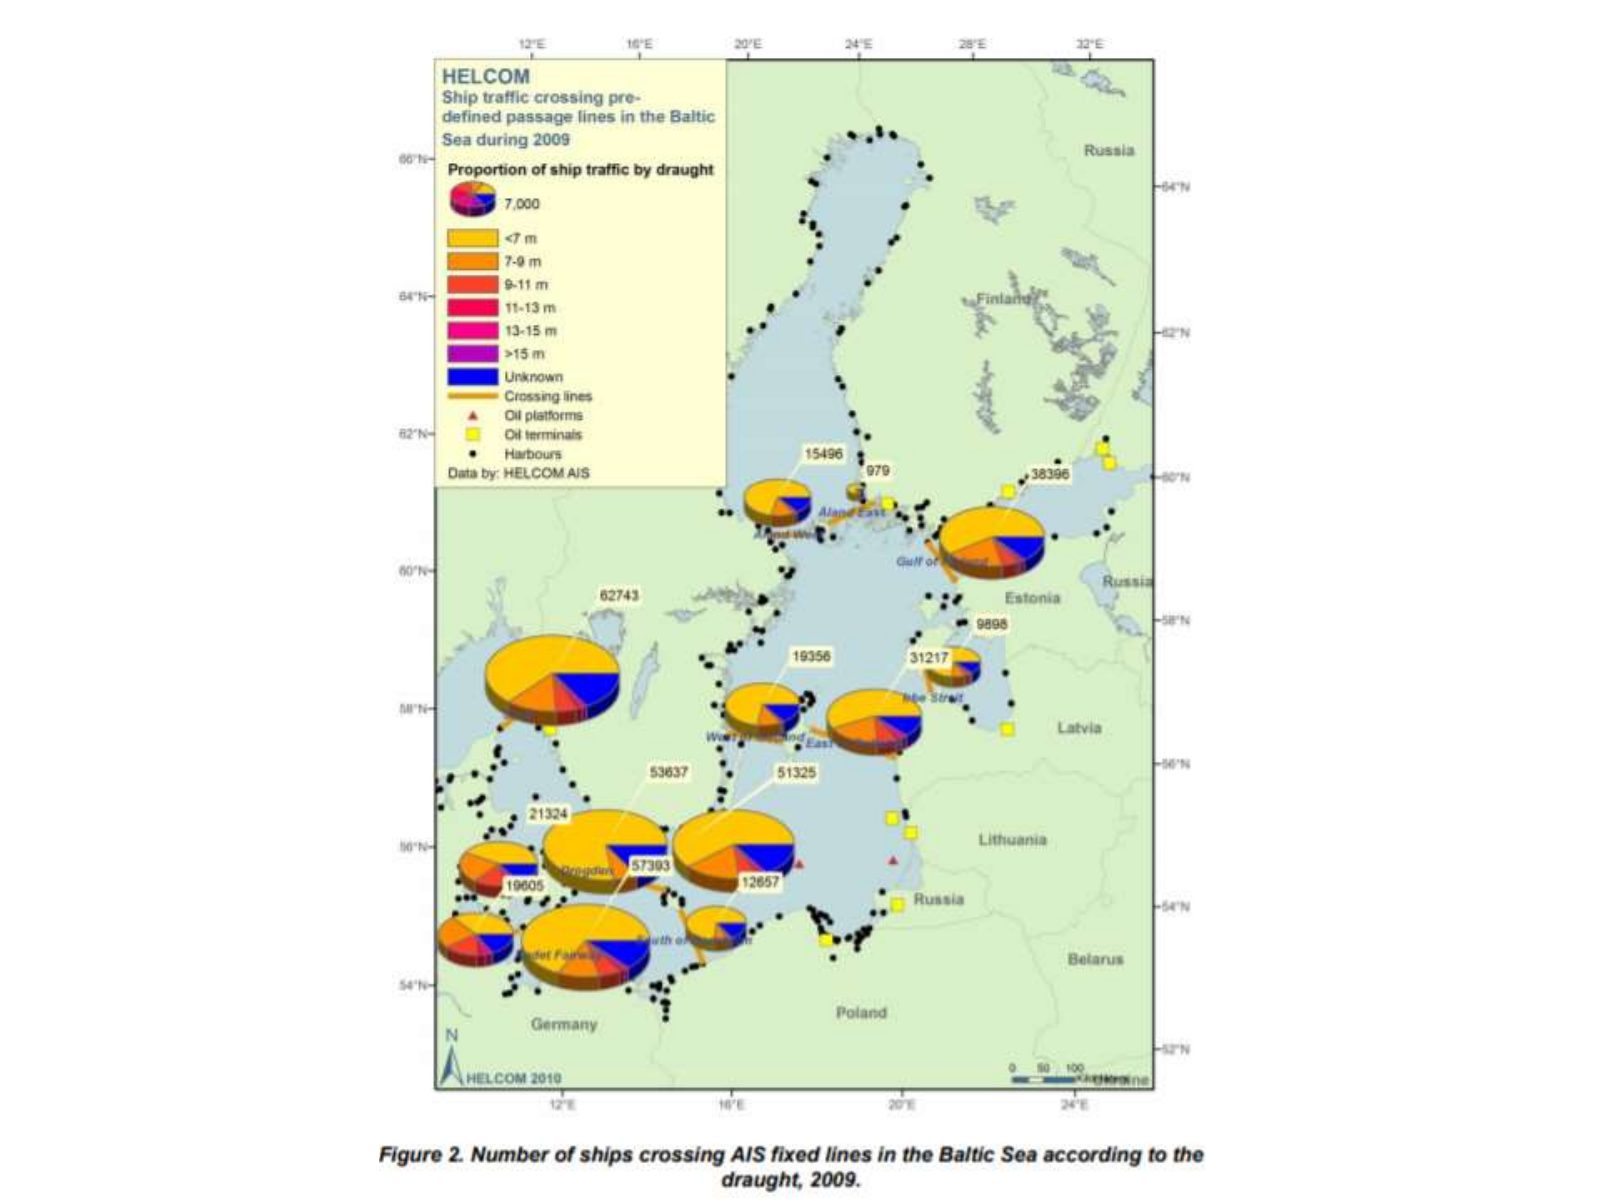
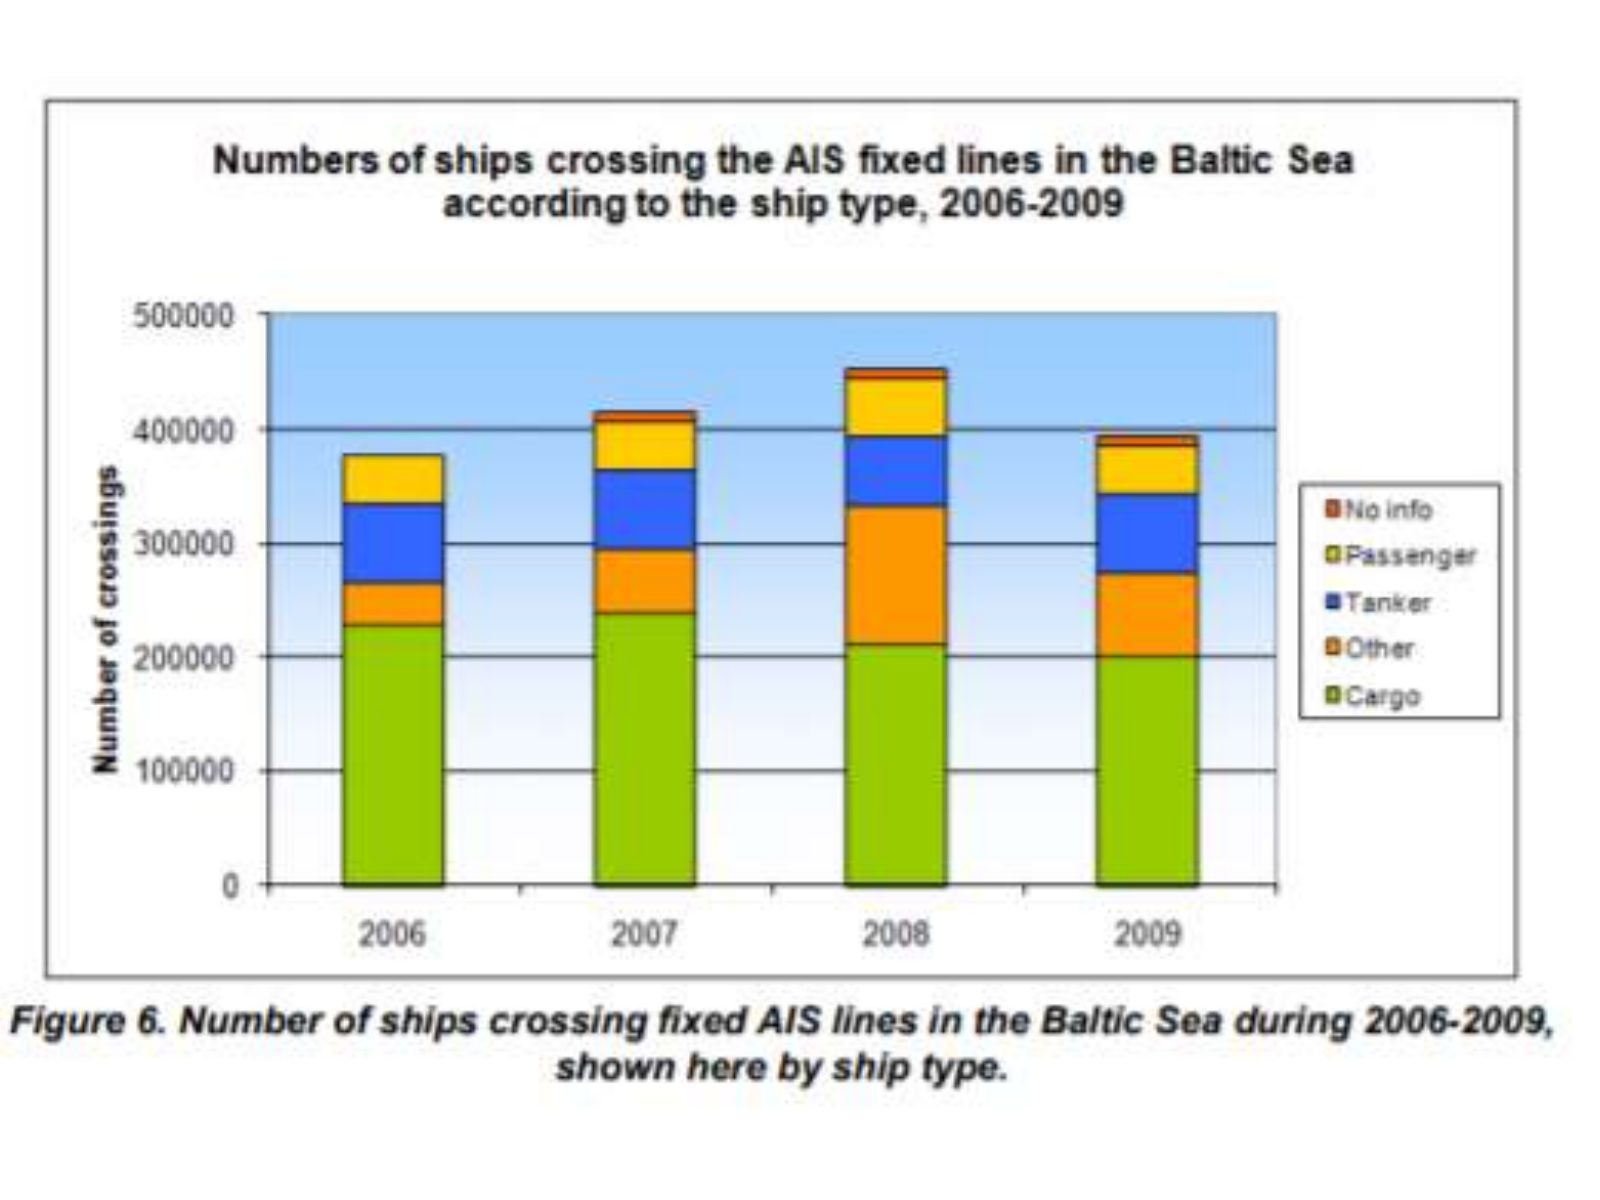
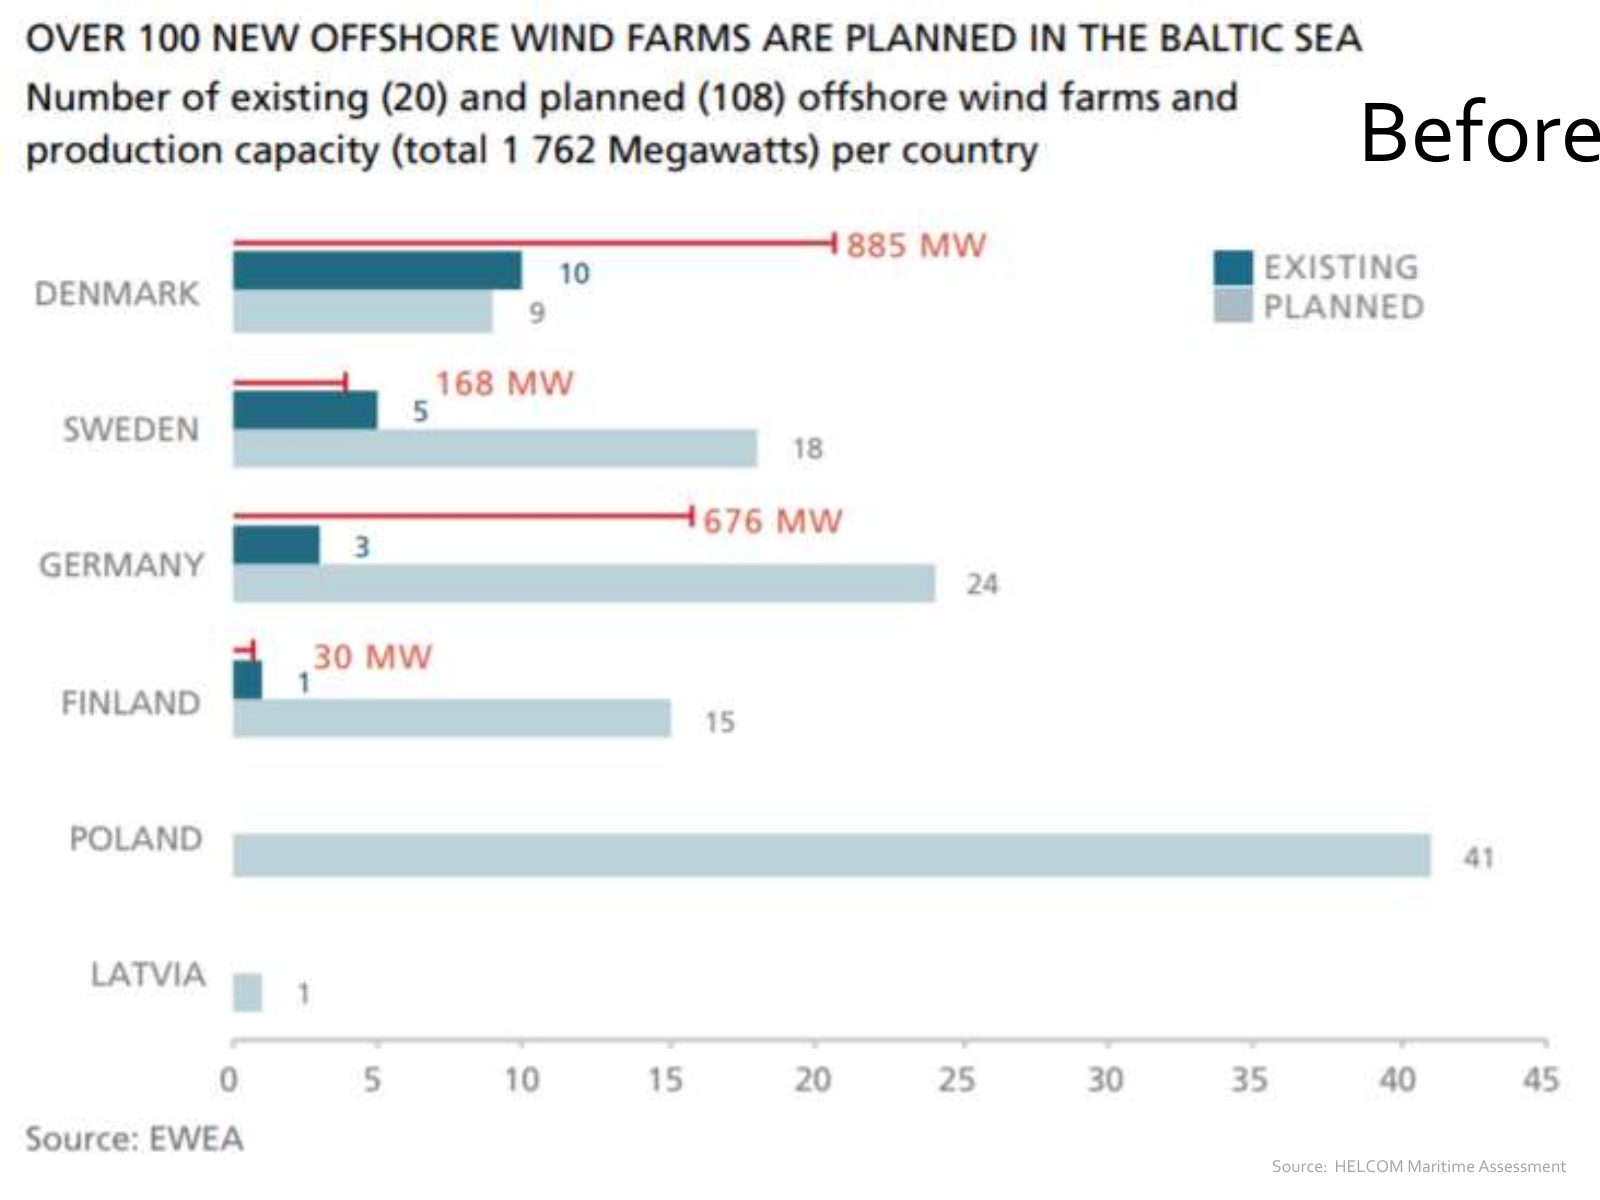
Slide 49 of 71: Before Source: HELCOM Maritime Assessment
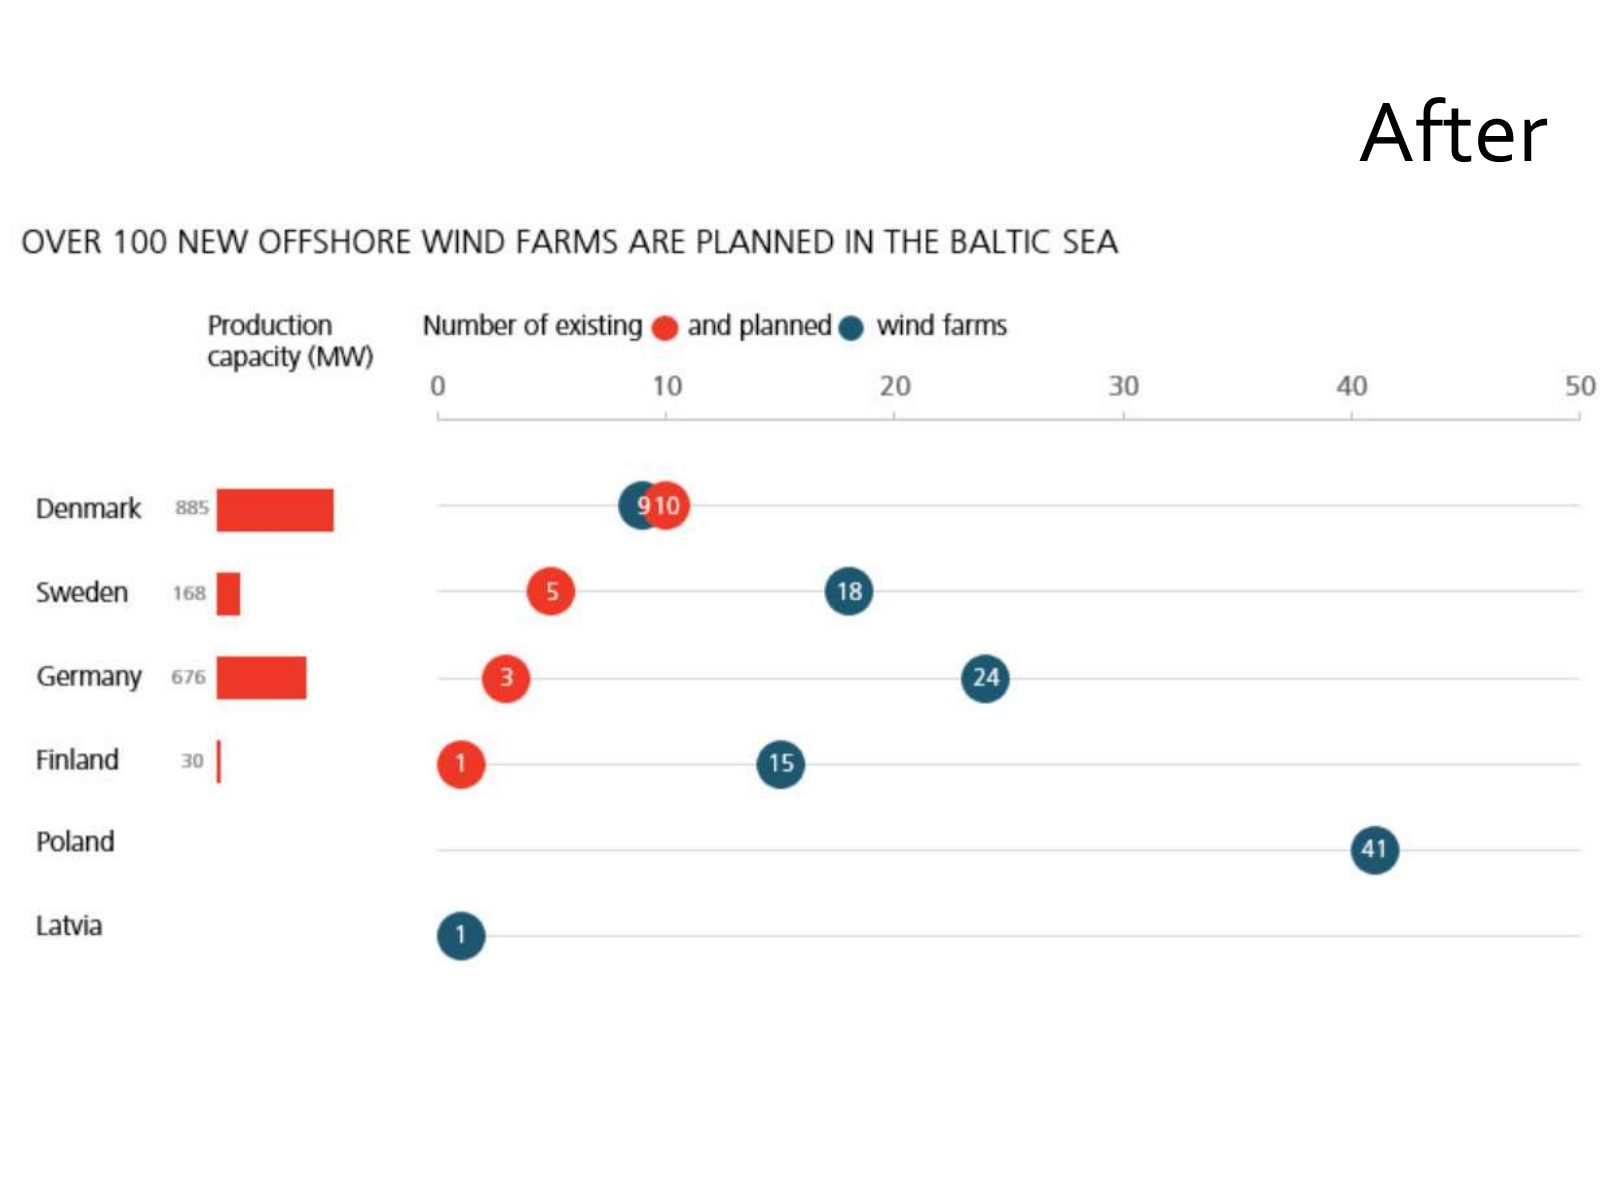
Slide 50 of 71: After
Slide 51 of 71: Chord diagram
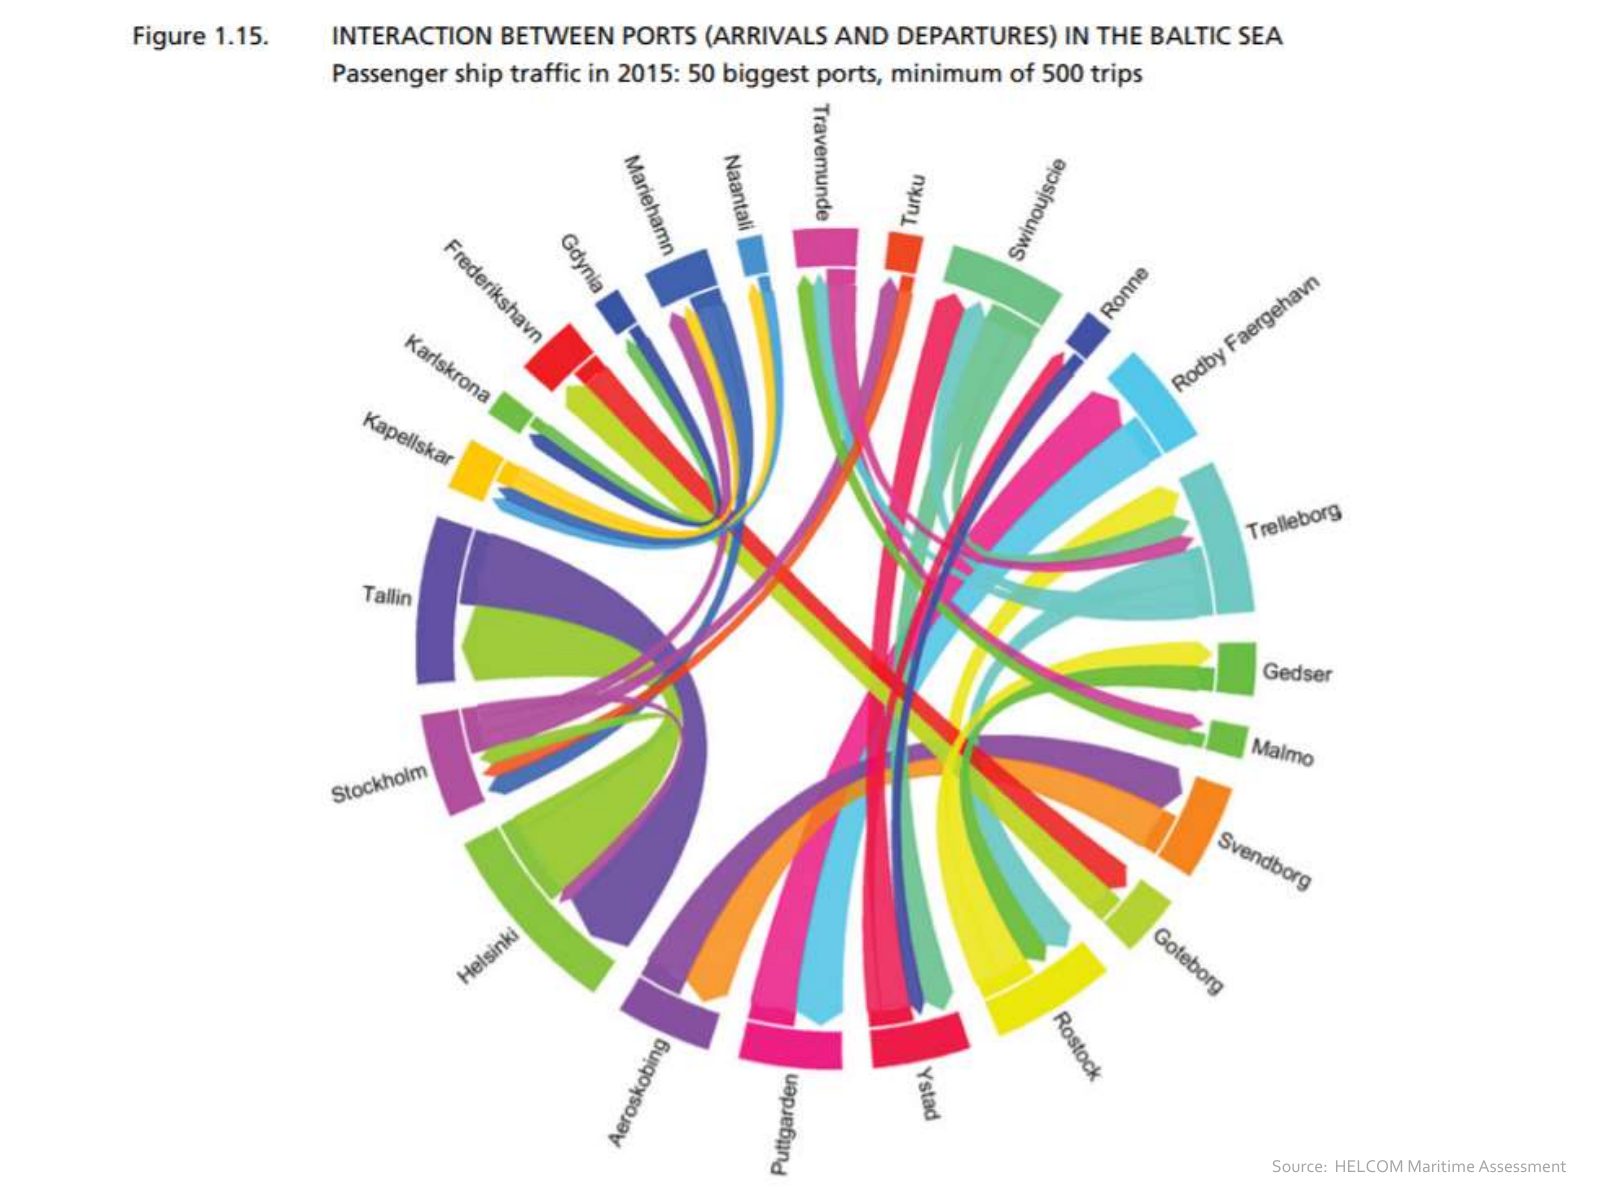
Slide 52 of 71: Source: HELCOM Maritime Assessment
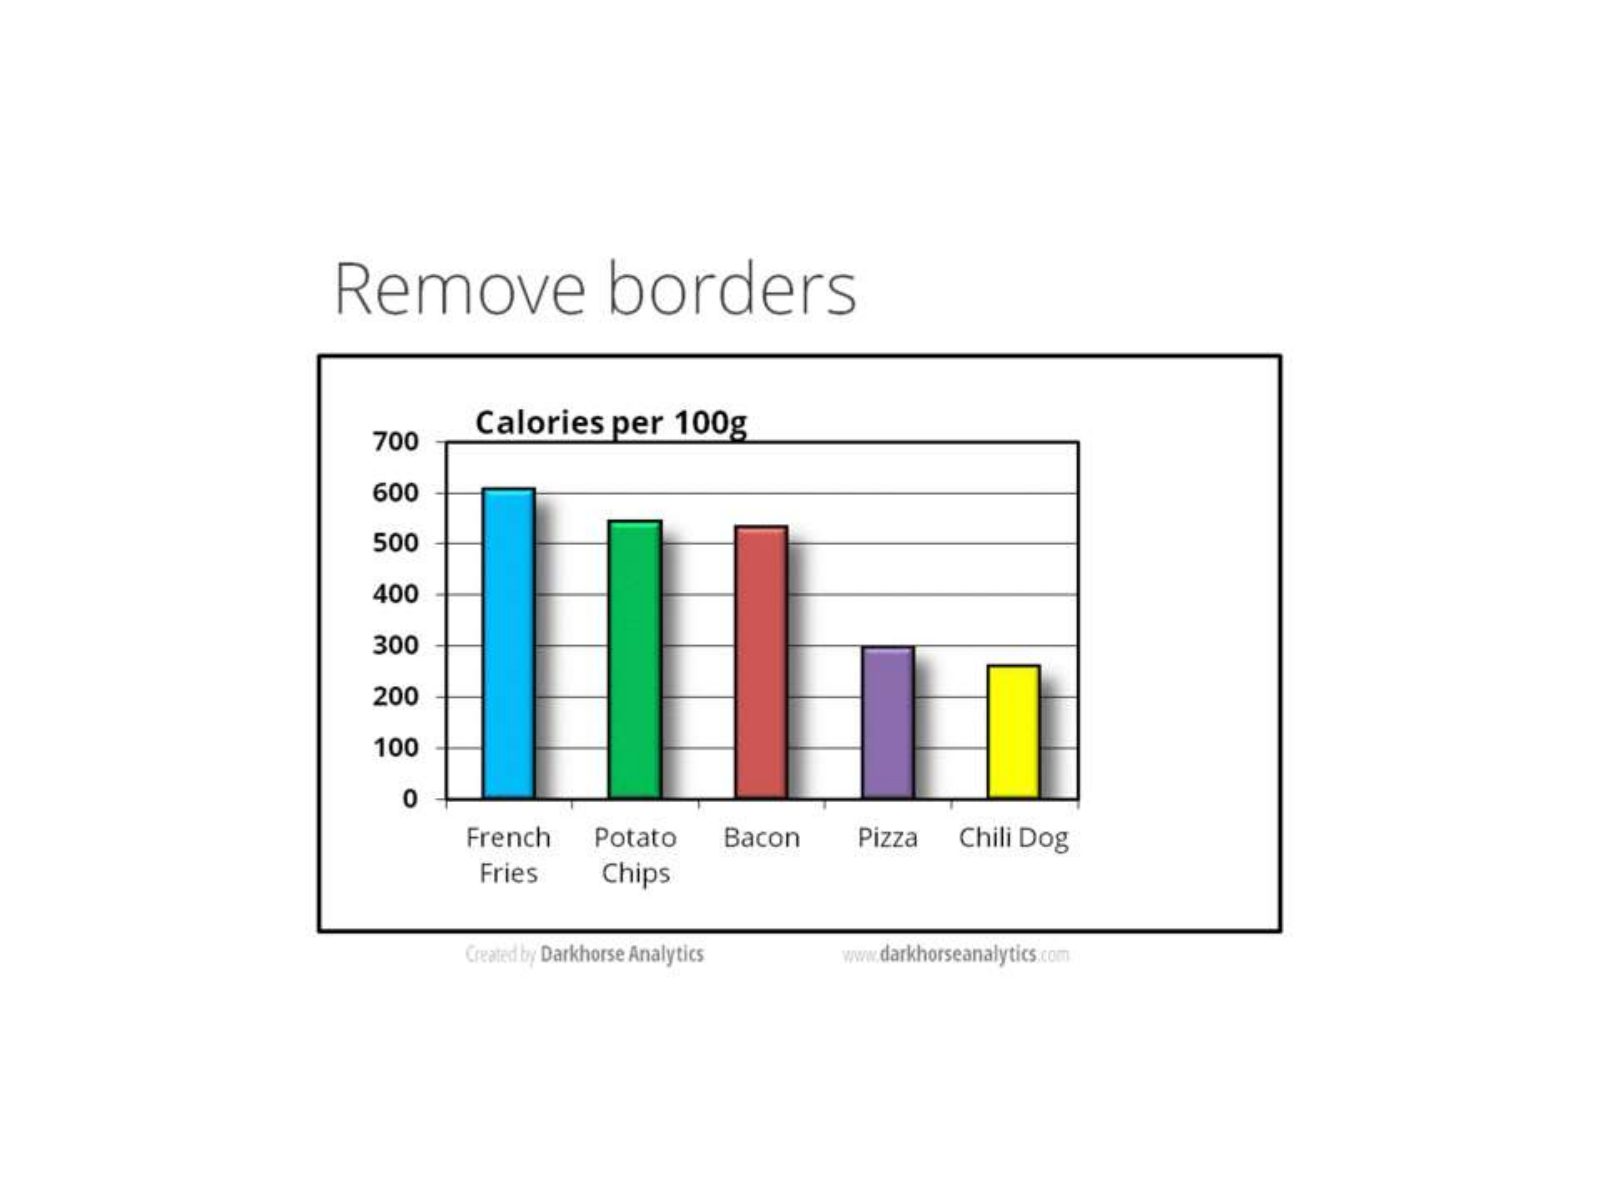
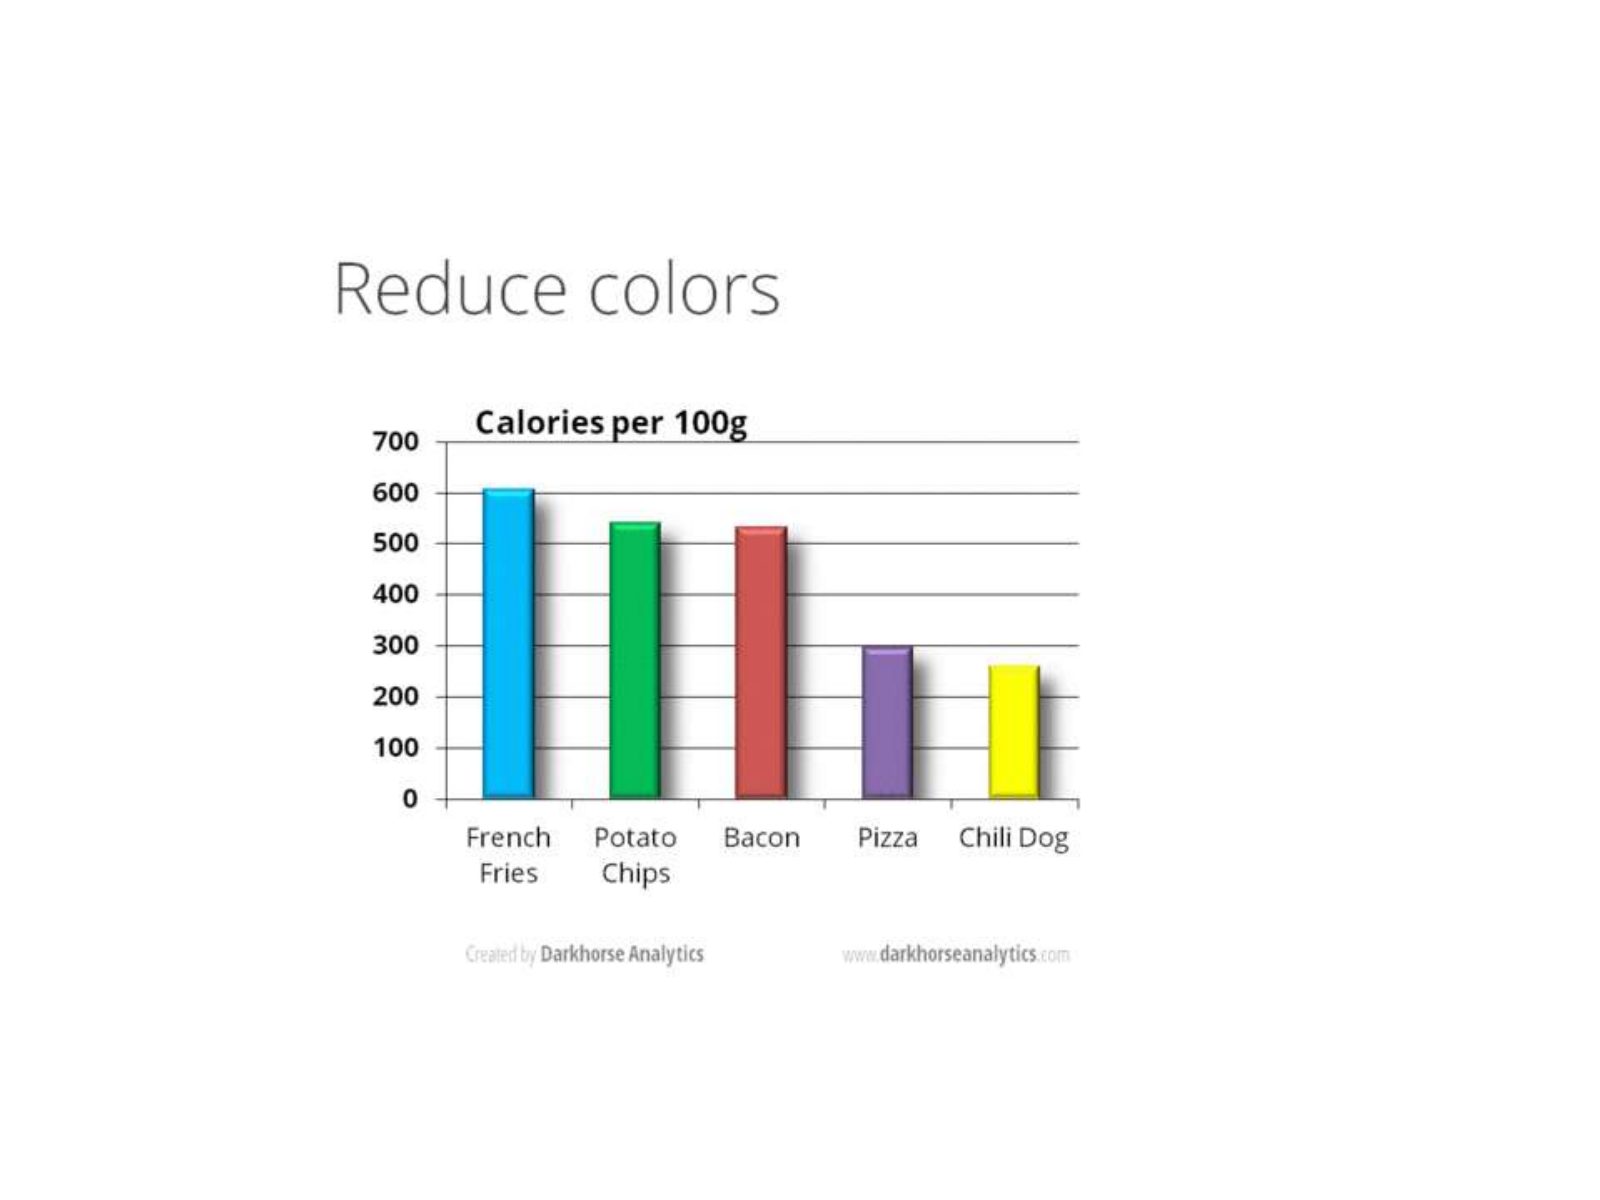
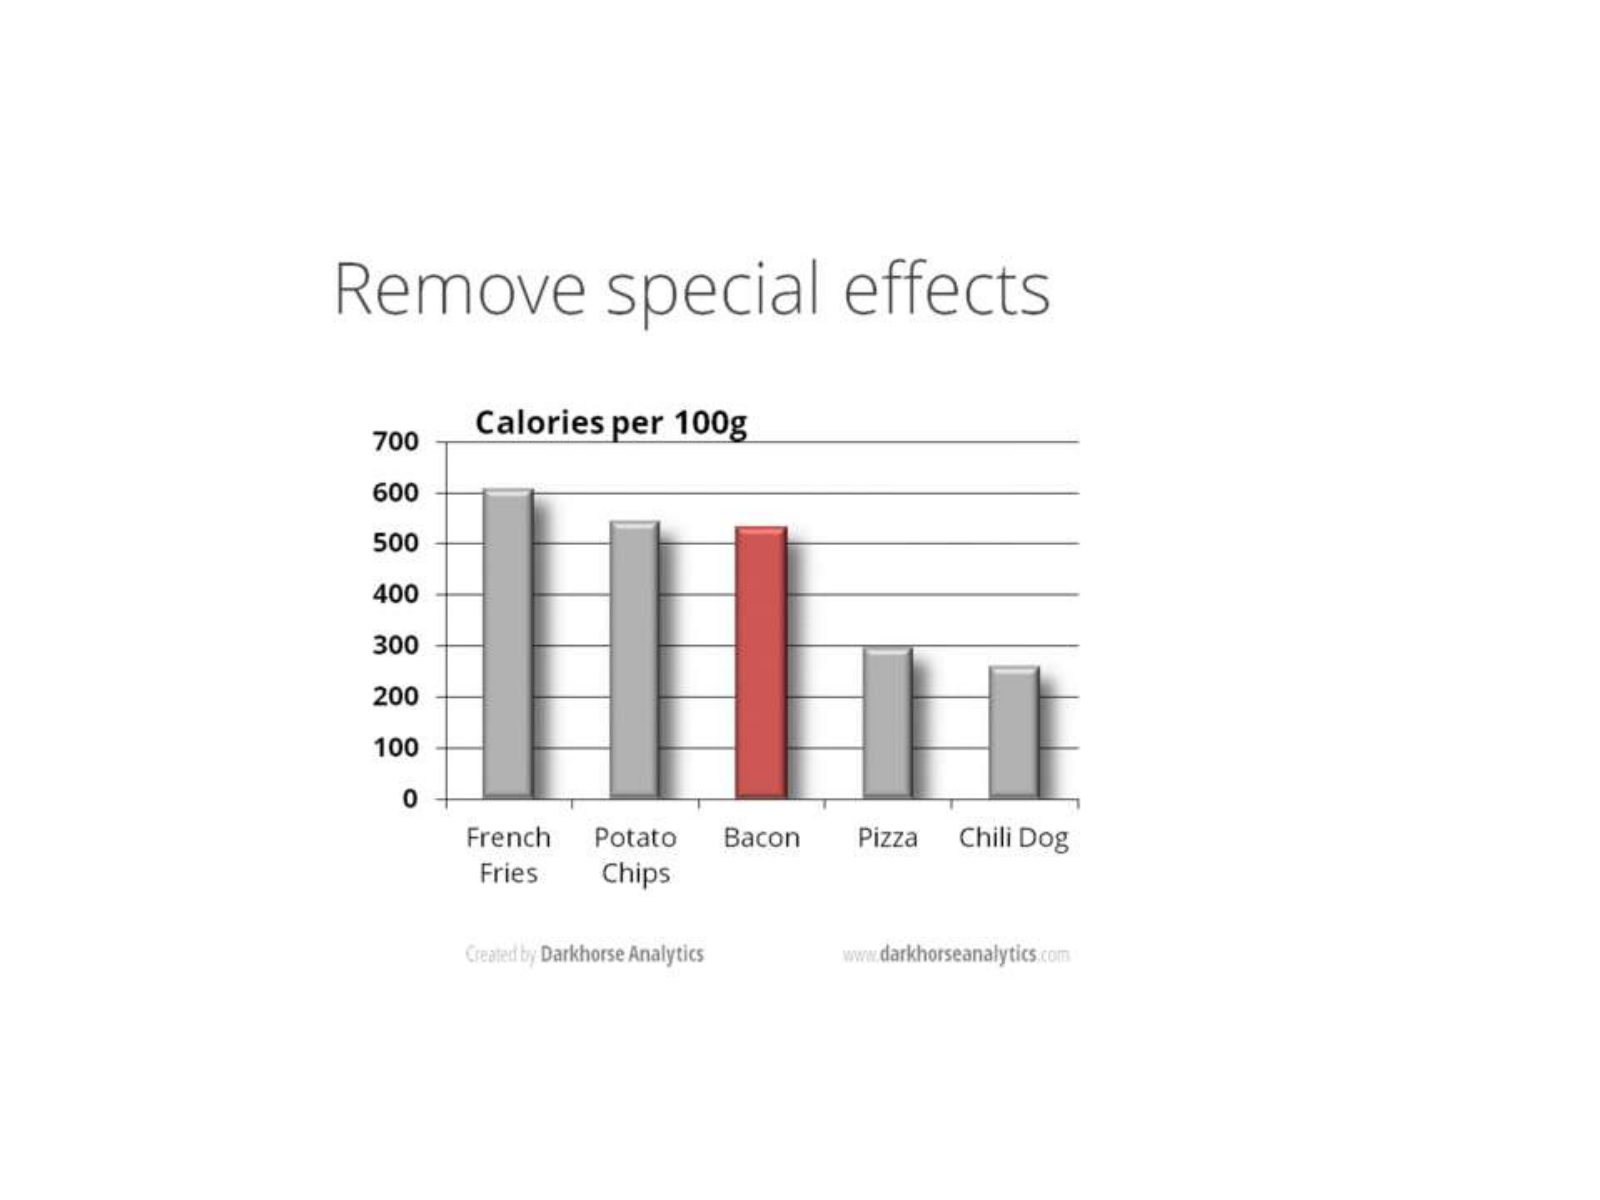
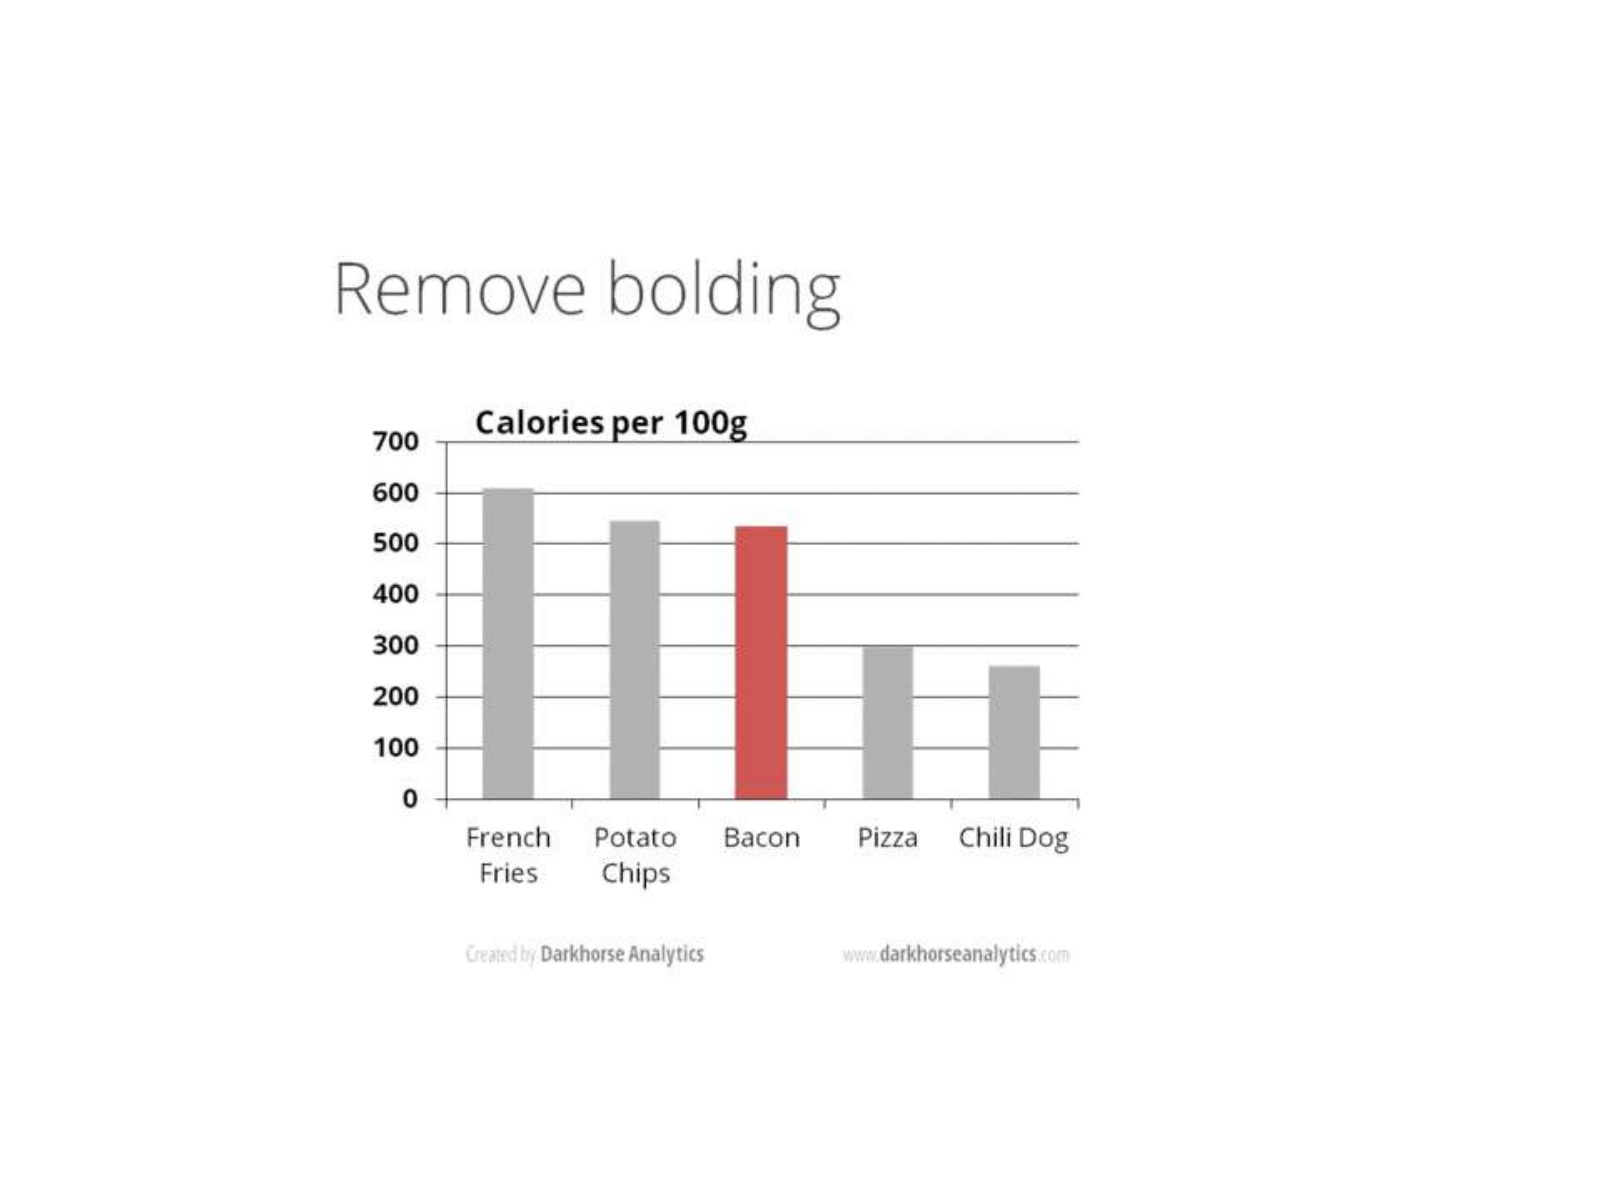
Slide 53 of 71: How can we improve the style of a graph?
Slide 54 of 71: picture slide without text
Slide 55 of 71: picture slide without text
Slide 56 of 71: picture slide without text
Slide 57 of 71: picture slide without text
Slide 58 of 71: picture slide without text
Slide 59 of 71: picture slide without text
Slide 60 of 71: picture slide without text
Slide 61 of 71: picture slide without text
Slide 62 of 71: picture slide without text
Slide 63 of 71: picture slide without text
Slide 64 of 71: picture slide without text
Slide 65 of 71: picture slide without text
Slide 66 of 71: picture slide without text
Slide 67 of 71: picture slide without text
Slide 68 of 71: Alternative tools
Slide 69 of 71: picture slide without text
Slide 70 of 71: picture slide without text
Slide 71 of 71: picture slide without text
1 / 71
Swipe, use the arrows or the keyboard arrow keys. Download the slides (PDF, 1.4 MB)

← All stories