Data visualization training session (summary)

2018 · 13 slides · Data viz & presentation

A written summary of a training session: what makes a graph effective, which graph fits which data, and how to improve its style.
Slide 1 of 13: DATA VISUALIZATION TRAINING SESSION Summary of the data visualization training session held at the HELCOM Secretariat on Organized by: 28th November 2018 11t…
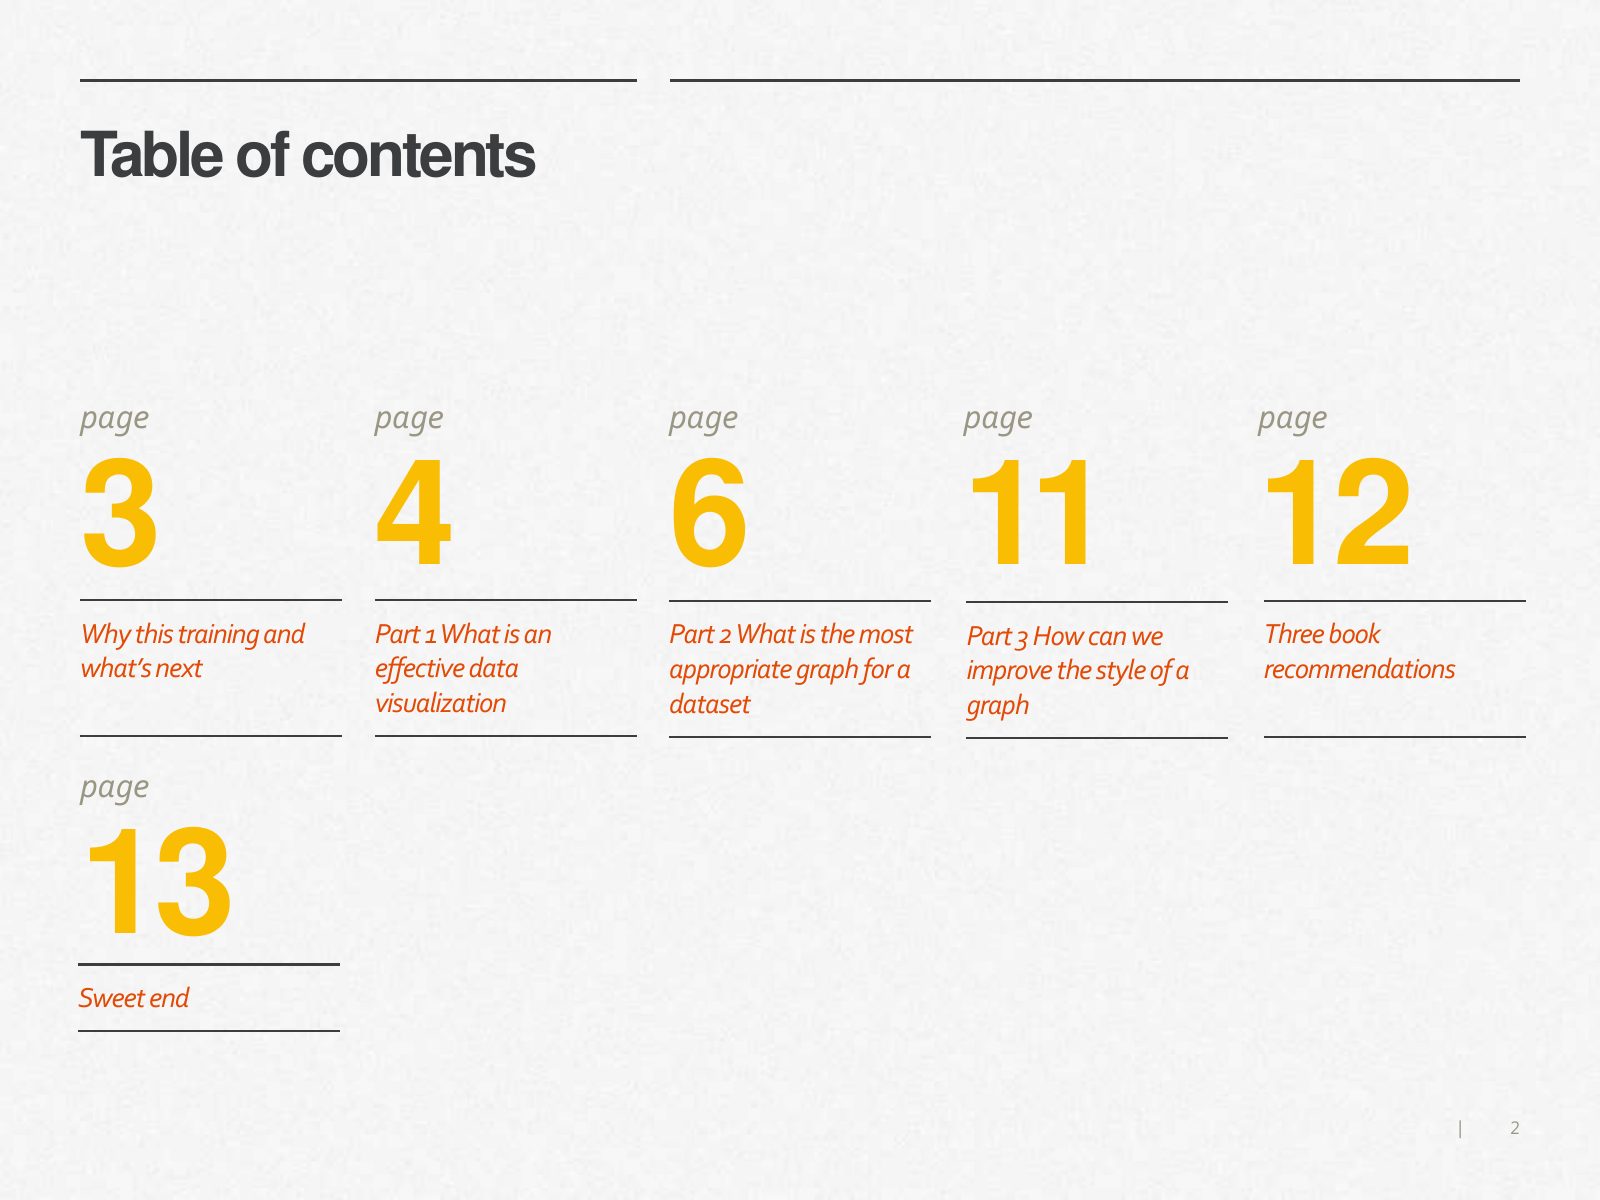
Slide 2 of 13: Table of contents page page page page page 3 4 6 11 12 Why this training and Part 1 What is an Part 2 What is the most Part 3 How can we Three book what’s ne…
Slide 3 of 13: What is an effective graph and how can we improve our data Why this training visualization skills? HELCOM publishes lots of graphs in many and what’s next re…
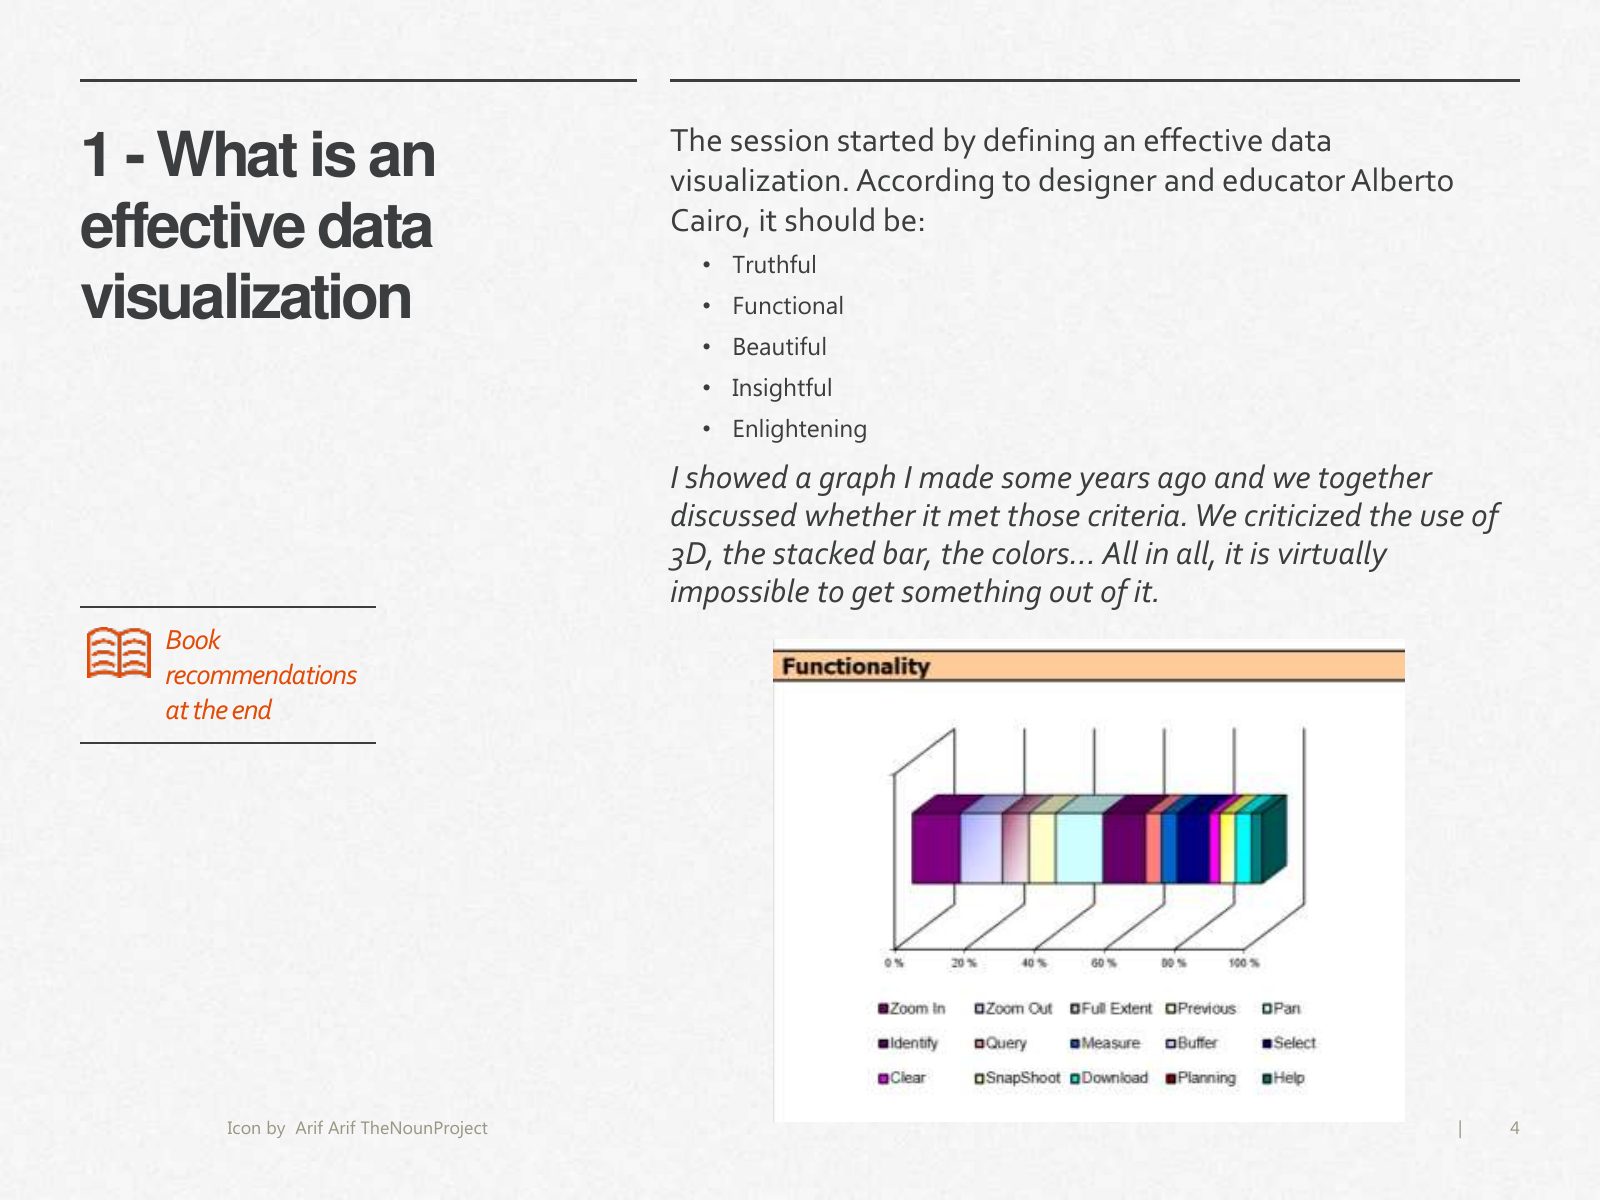
Slide 4 of 13: The session started by defining an effective data 1 - What is an visualization. According to designer and educator Alberto effective data Cairo, it should be…
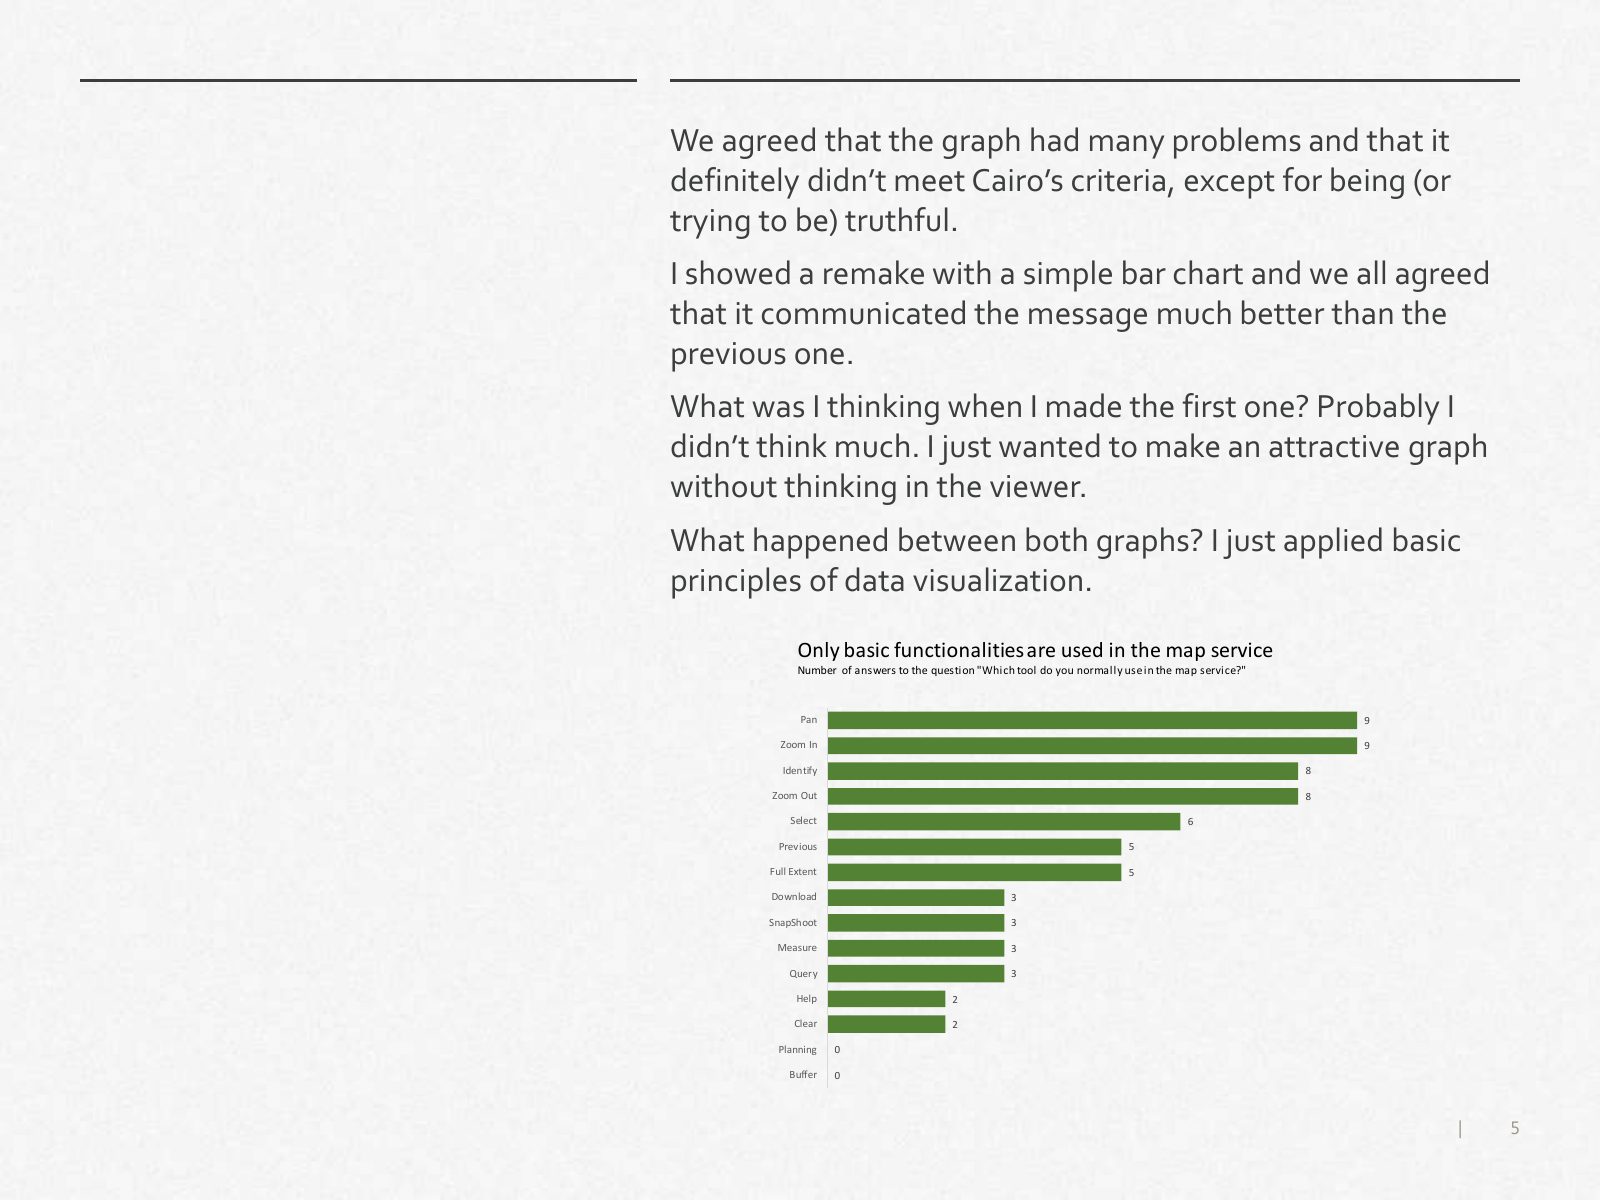
Slide 5 of 13: We agreed that the graph had many problems and that it definitely didn’t meet Cairo’s criteria, except for being (or trying to be) truthful. I showed a remak…
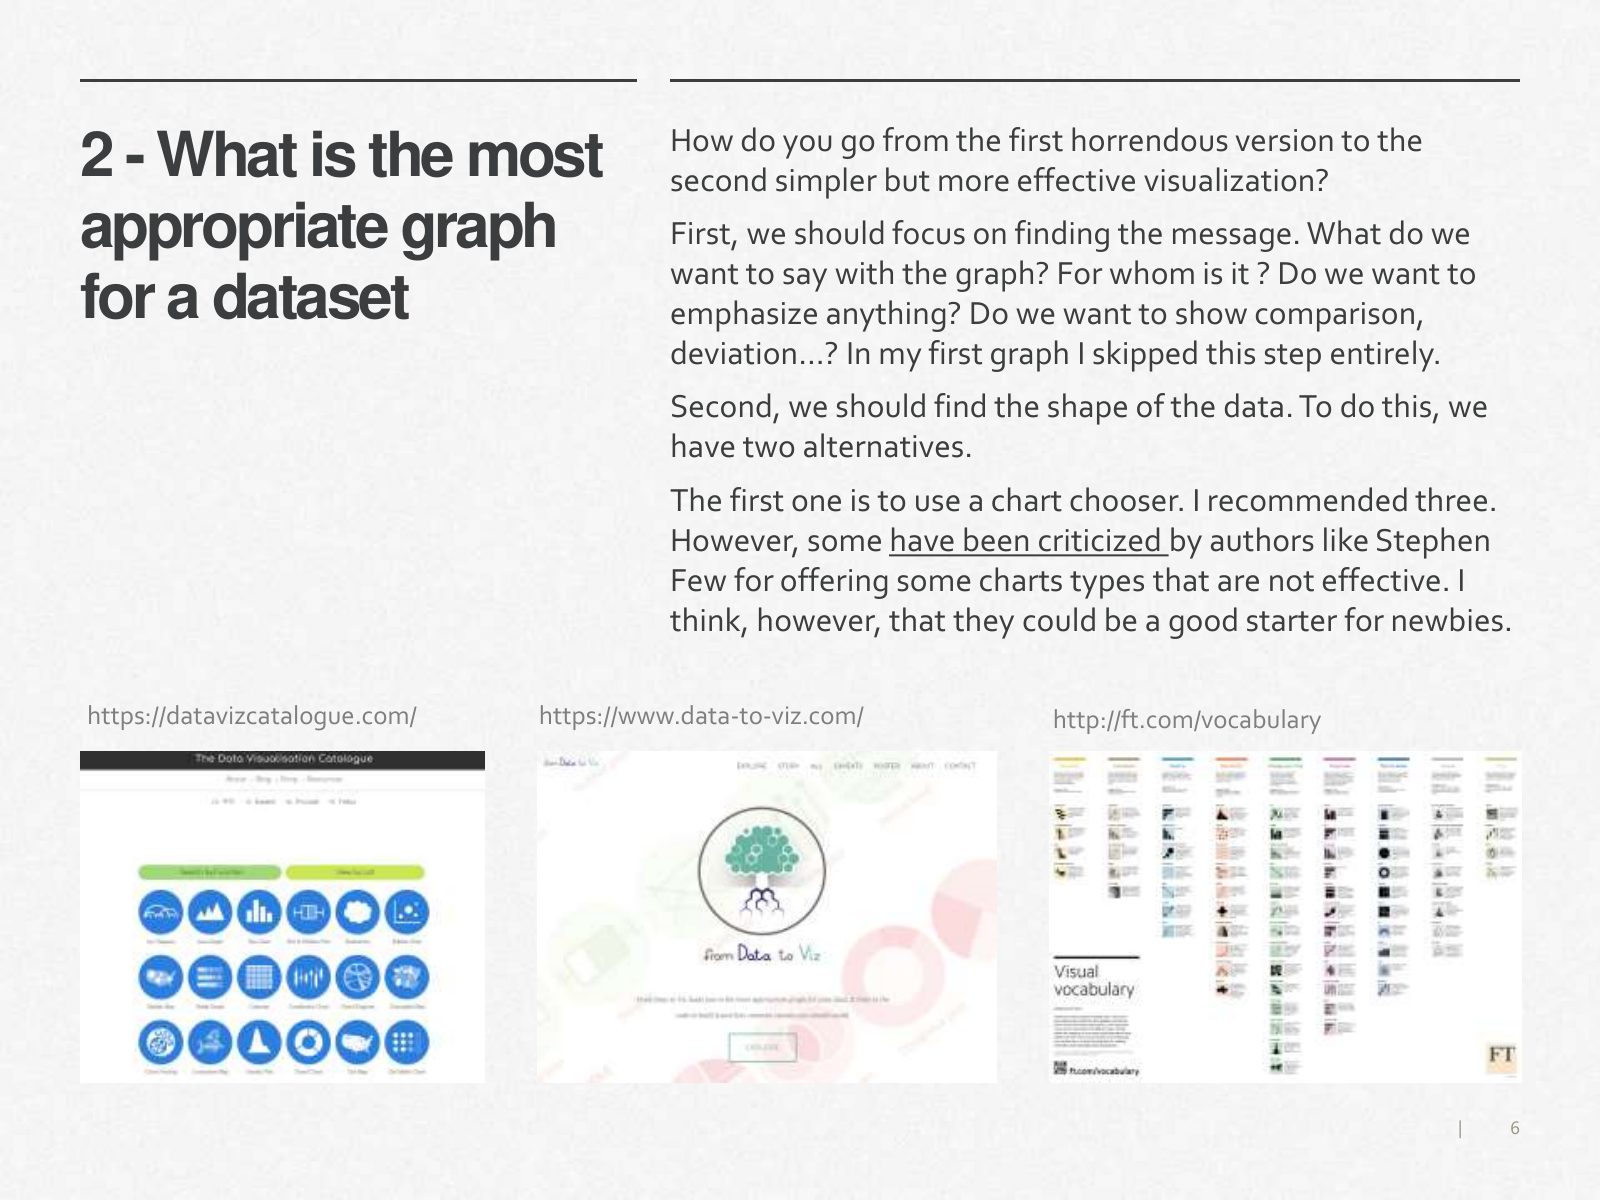
Slide 6 of 13: How do you go from the first horrendous version to the 2 - What is the most second simpler but more effective visualization? appropriate graph First, we shou…
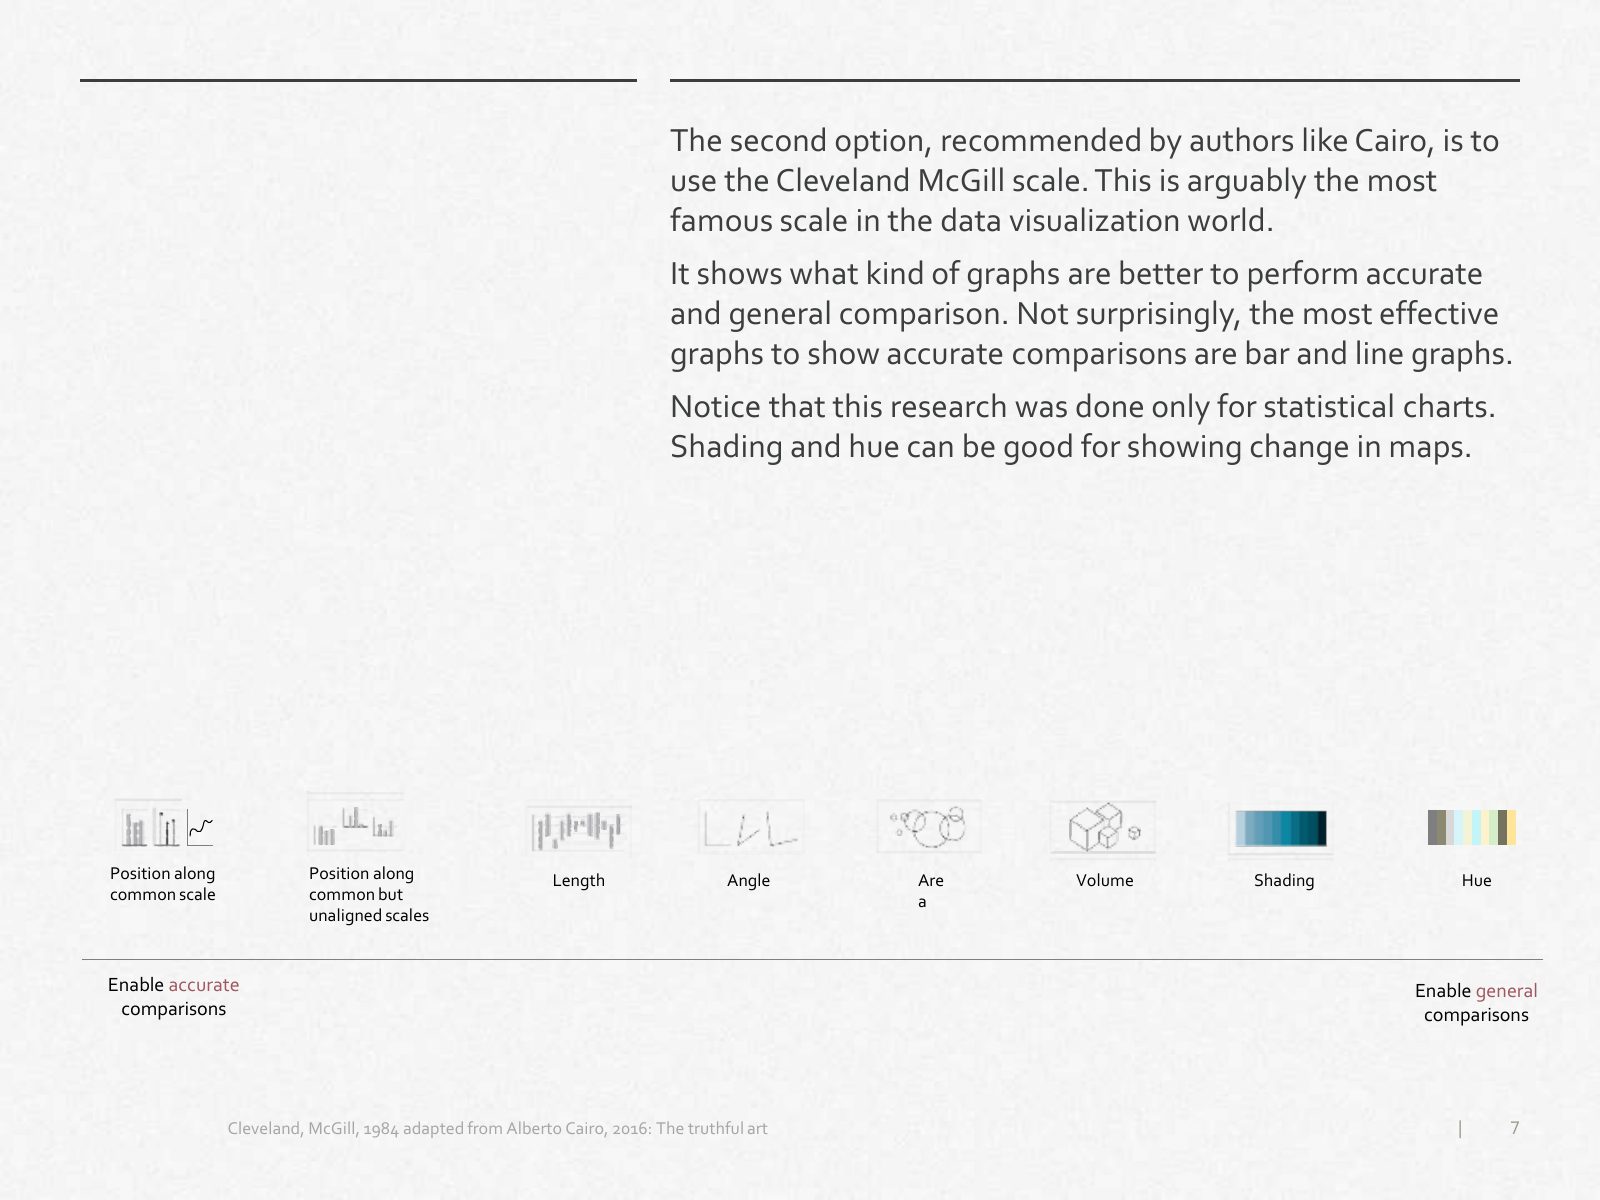
Slide 7 of 13: The second option, recommended by authors like Cairo, is to use the Cleveland McGill scale. This is arguably the most famous scale in the data visualization…
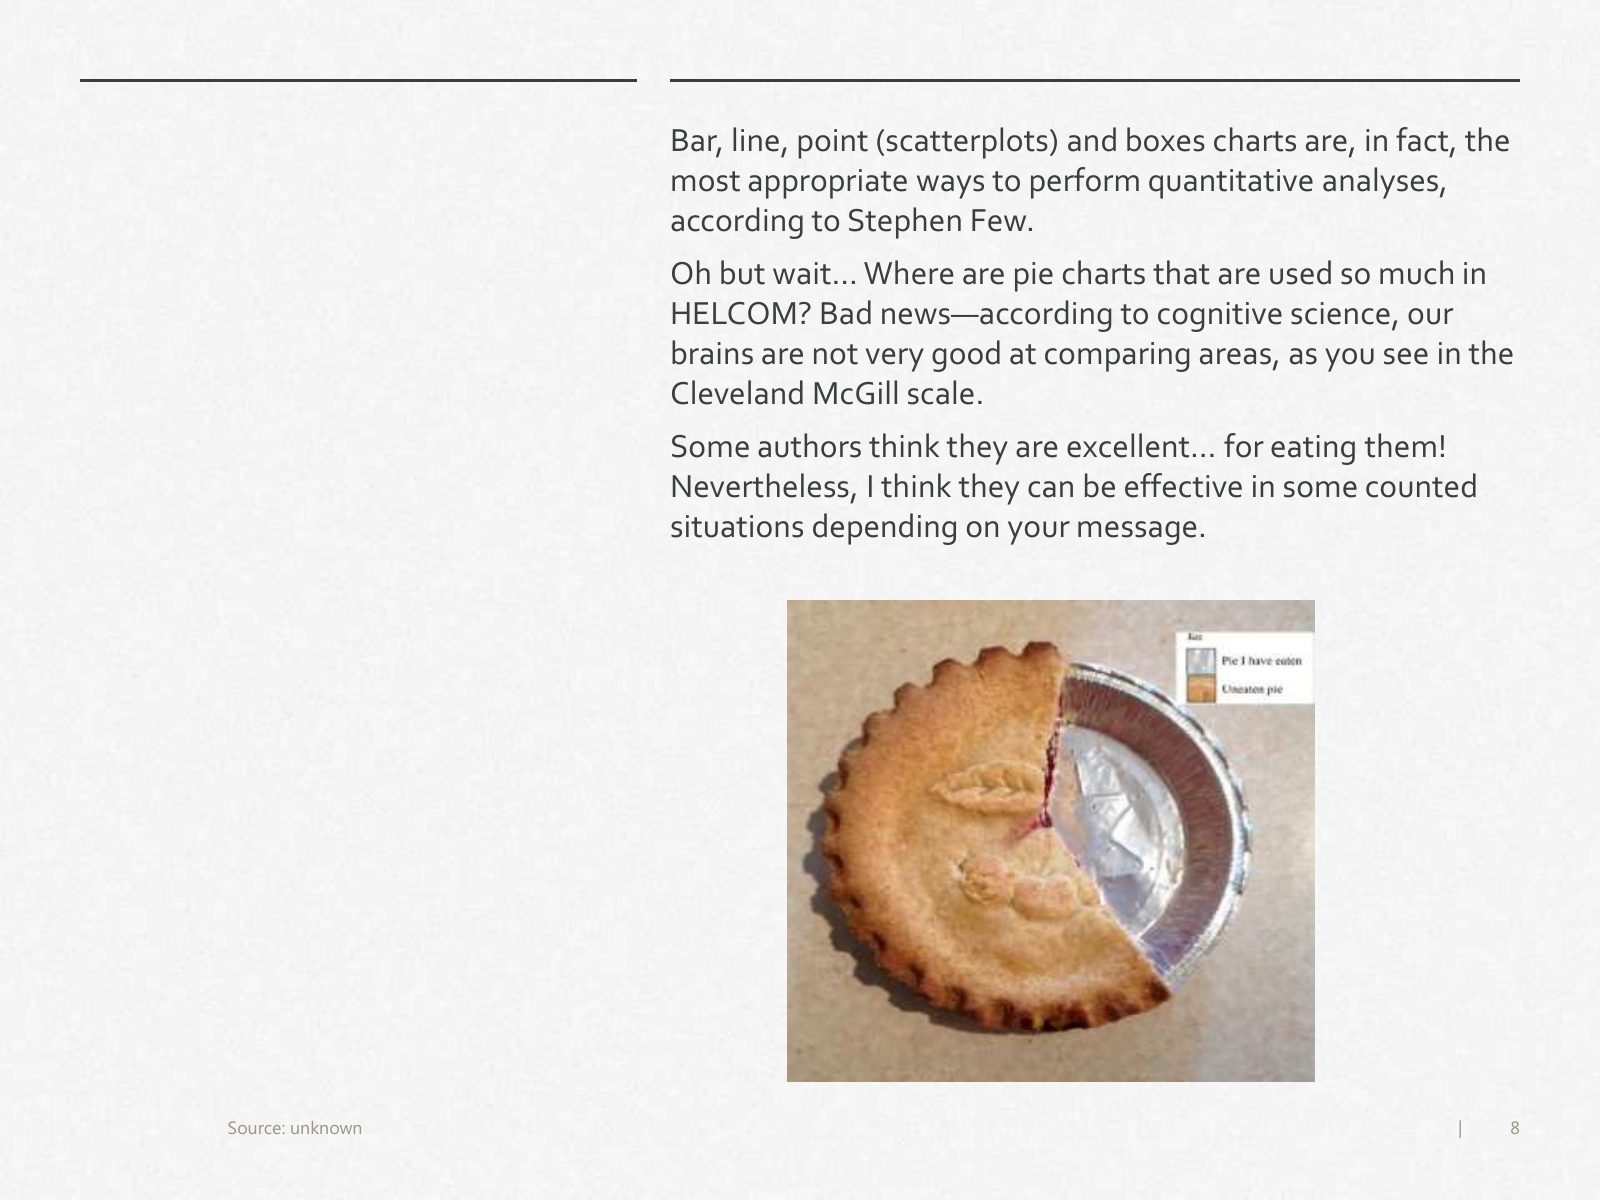
Slide 8 of 13: Bar, line, point (scatterplots) and boxes charts are, in fact, the most appropriate ways to perform quantitative analyses, according to Stephen Few. Oh but w…
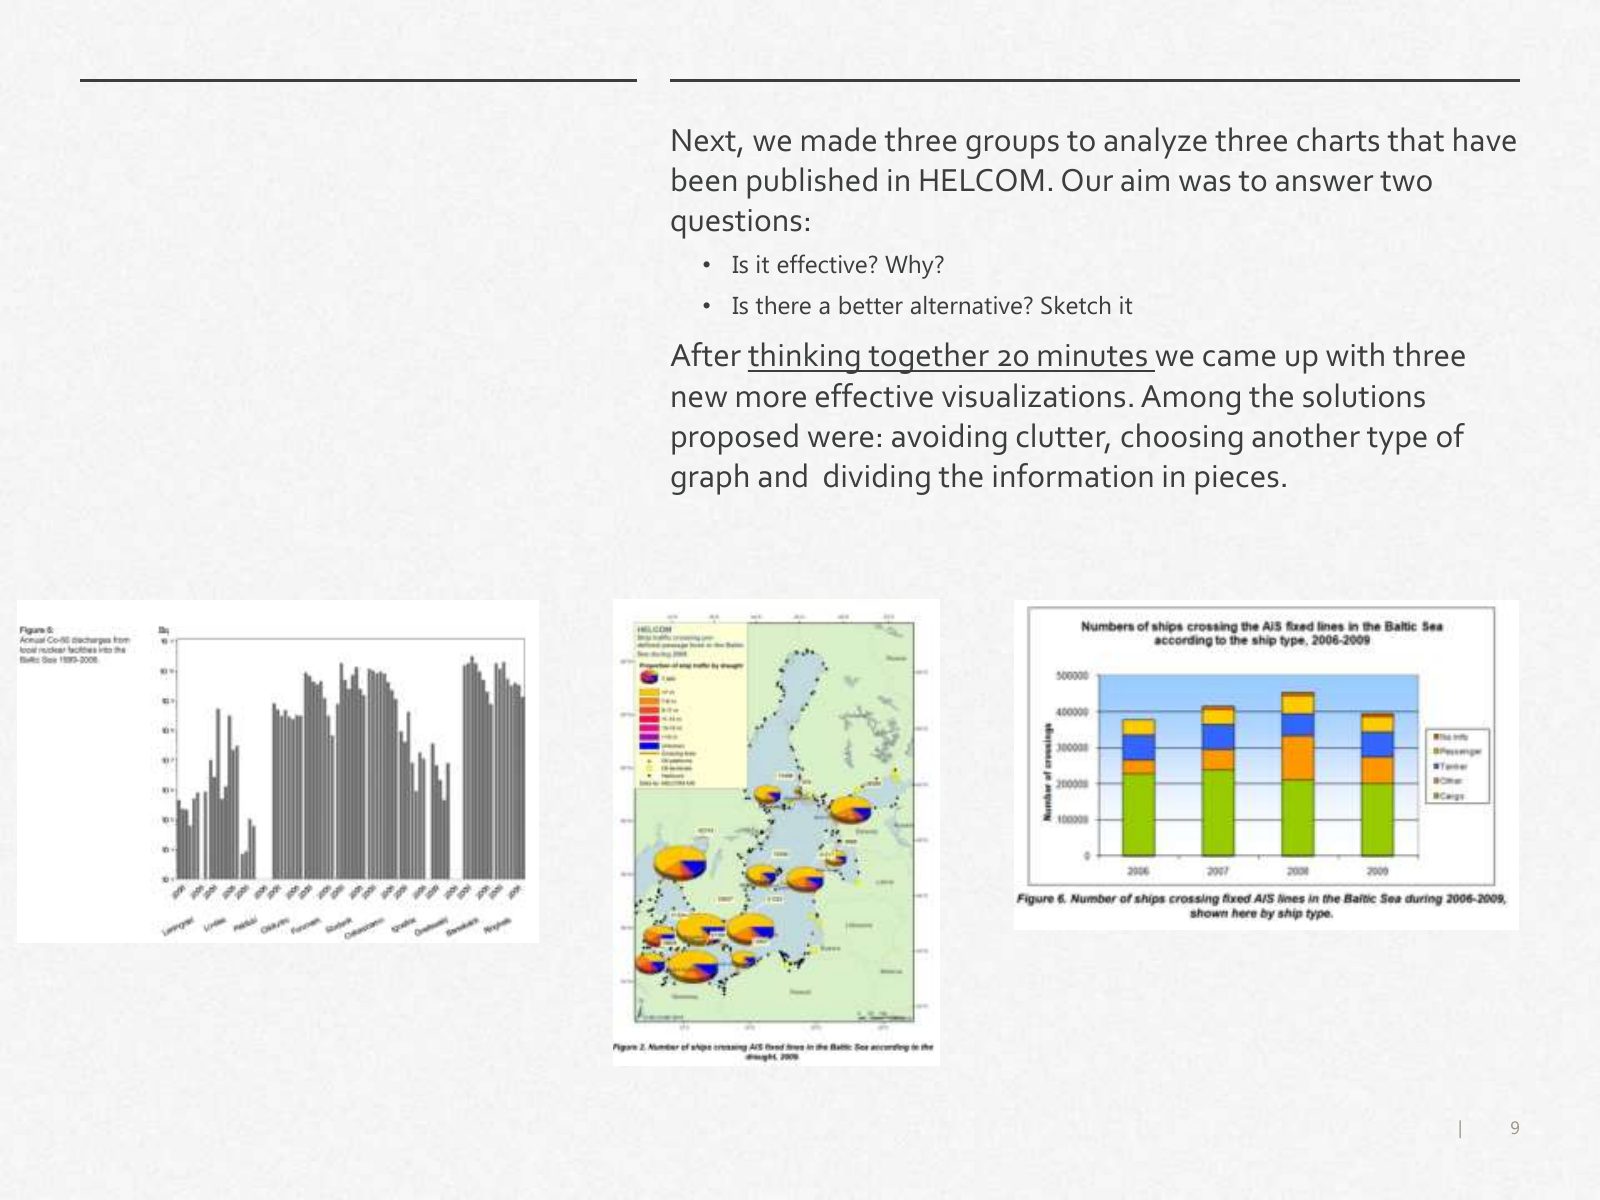
Slide 9 of 13: Next, we made three groups to analyze three charts that have been published in HELCOM. Our aim was to answer two questions: • Is it effective? Why? • Is ther…
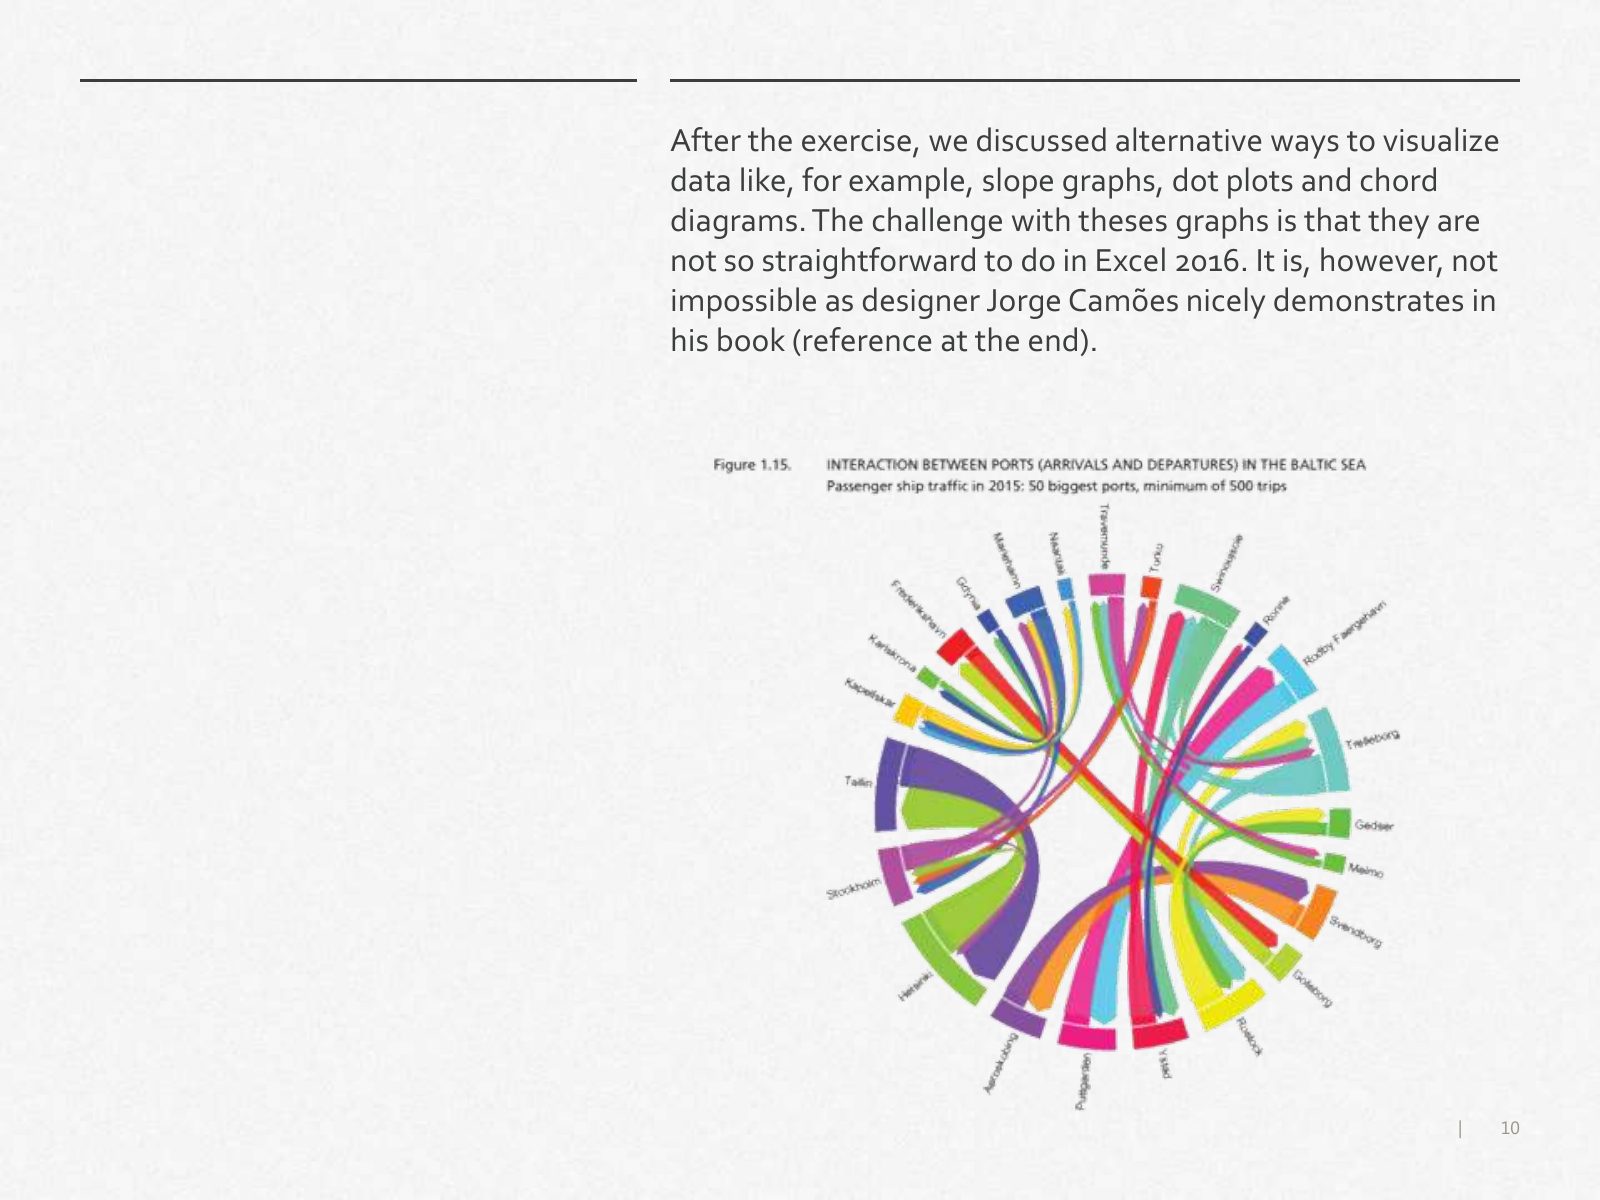
Slide 10 of 13: After the exercise, we discussed alternative ways to visualize data like, for example, slope graphs, dot plots and chord diagrams. The challenge with theses…
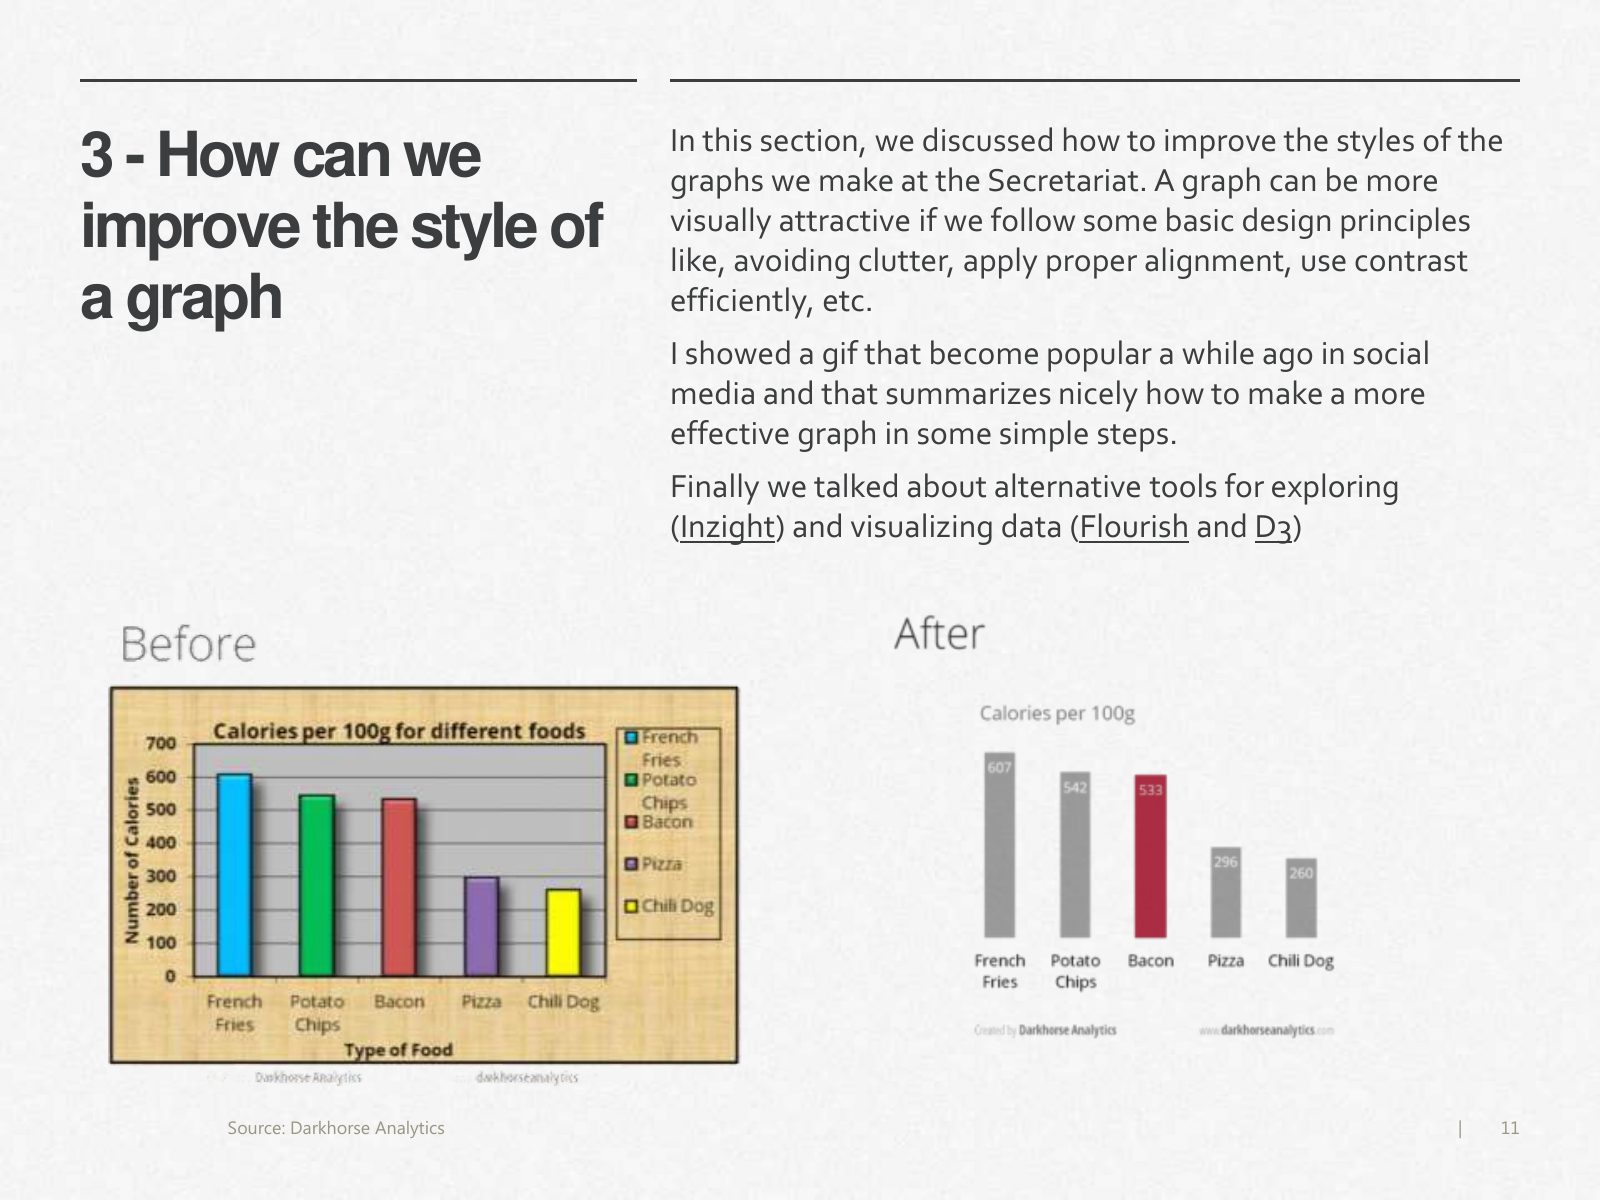
Slide 11 of 13: In this section, we discussed how to improve the styles of the 3 - How can we graphs we make at the Secretariat. A graph can be more improve the style of vis…
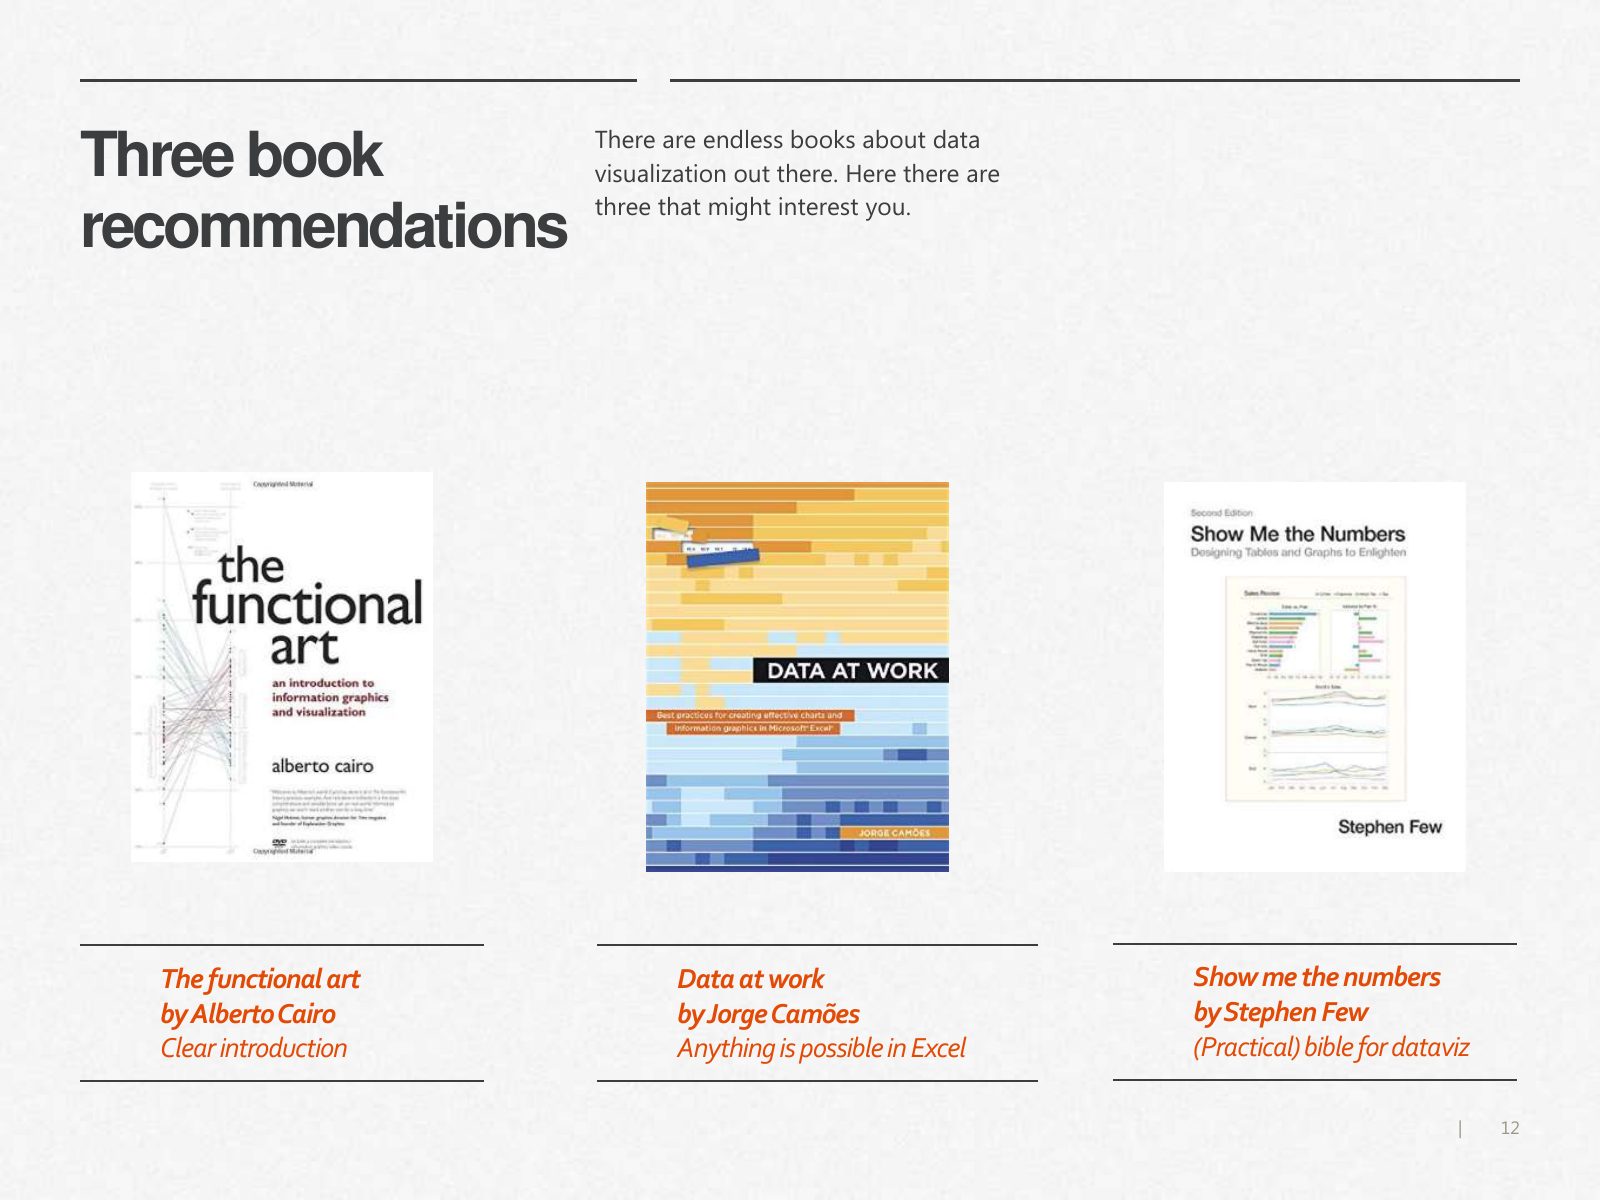
Slide 12 of 13: There are endless books about data Three book visualization out there. Here there are three that might interest you. recommendations The functional art Data…
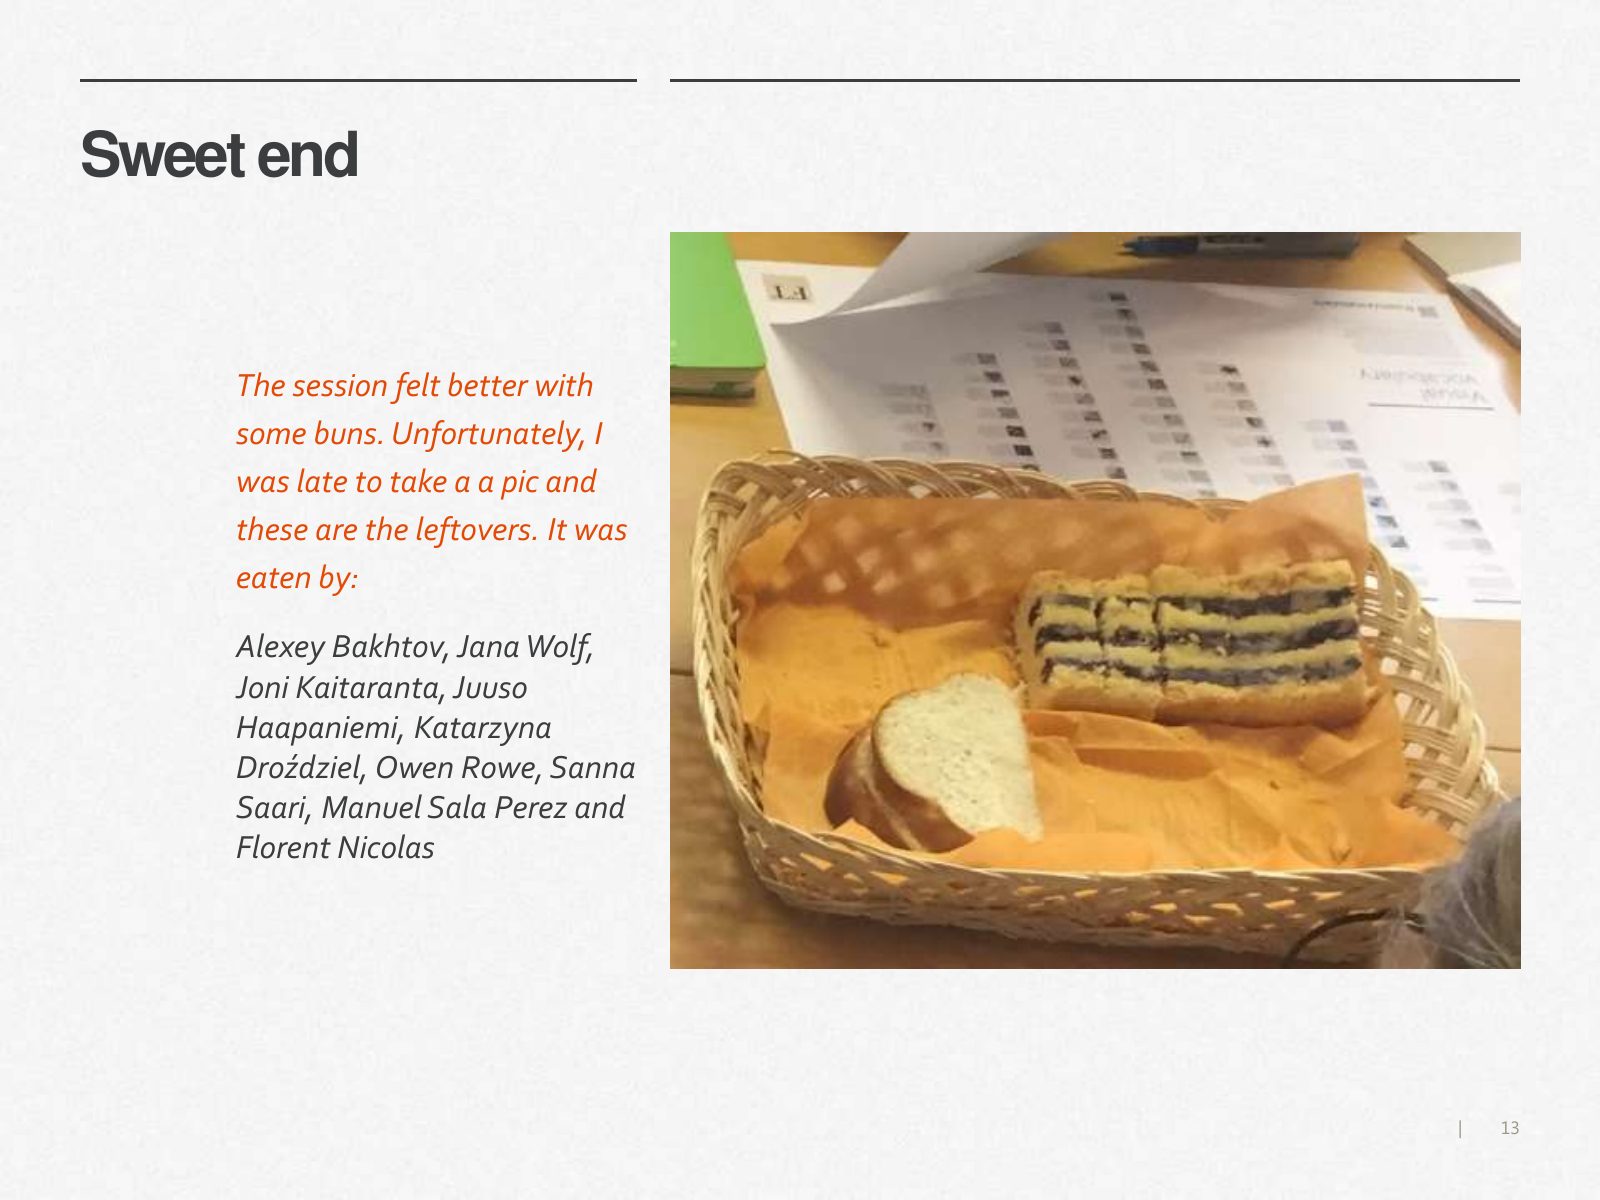
Slide 13 of 13: Sweet end The session felt better with some buns. Unfortunately, I was late to take a a pic and these are the leftovers. It was eaten by: Alexey Bakhtov, Jan…
1 / 13
Swipe, use the arrows or the keyboard arrow keys. Download the slides (PDF, 0.7 MB)

← All stories