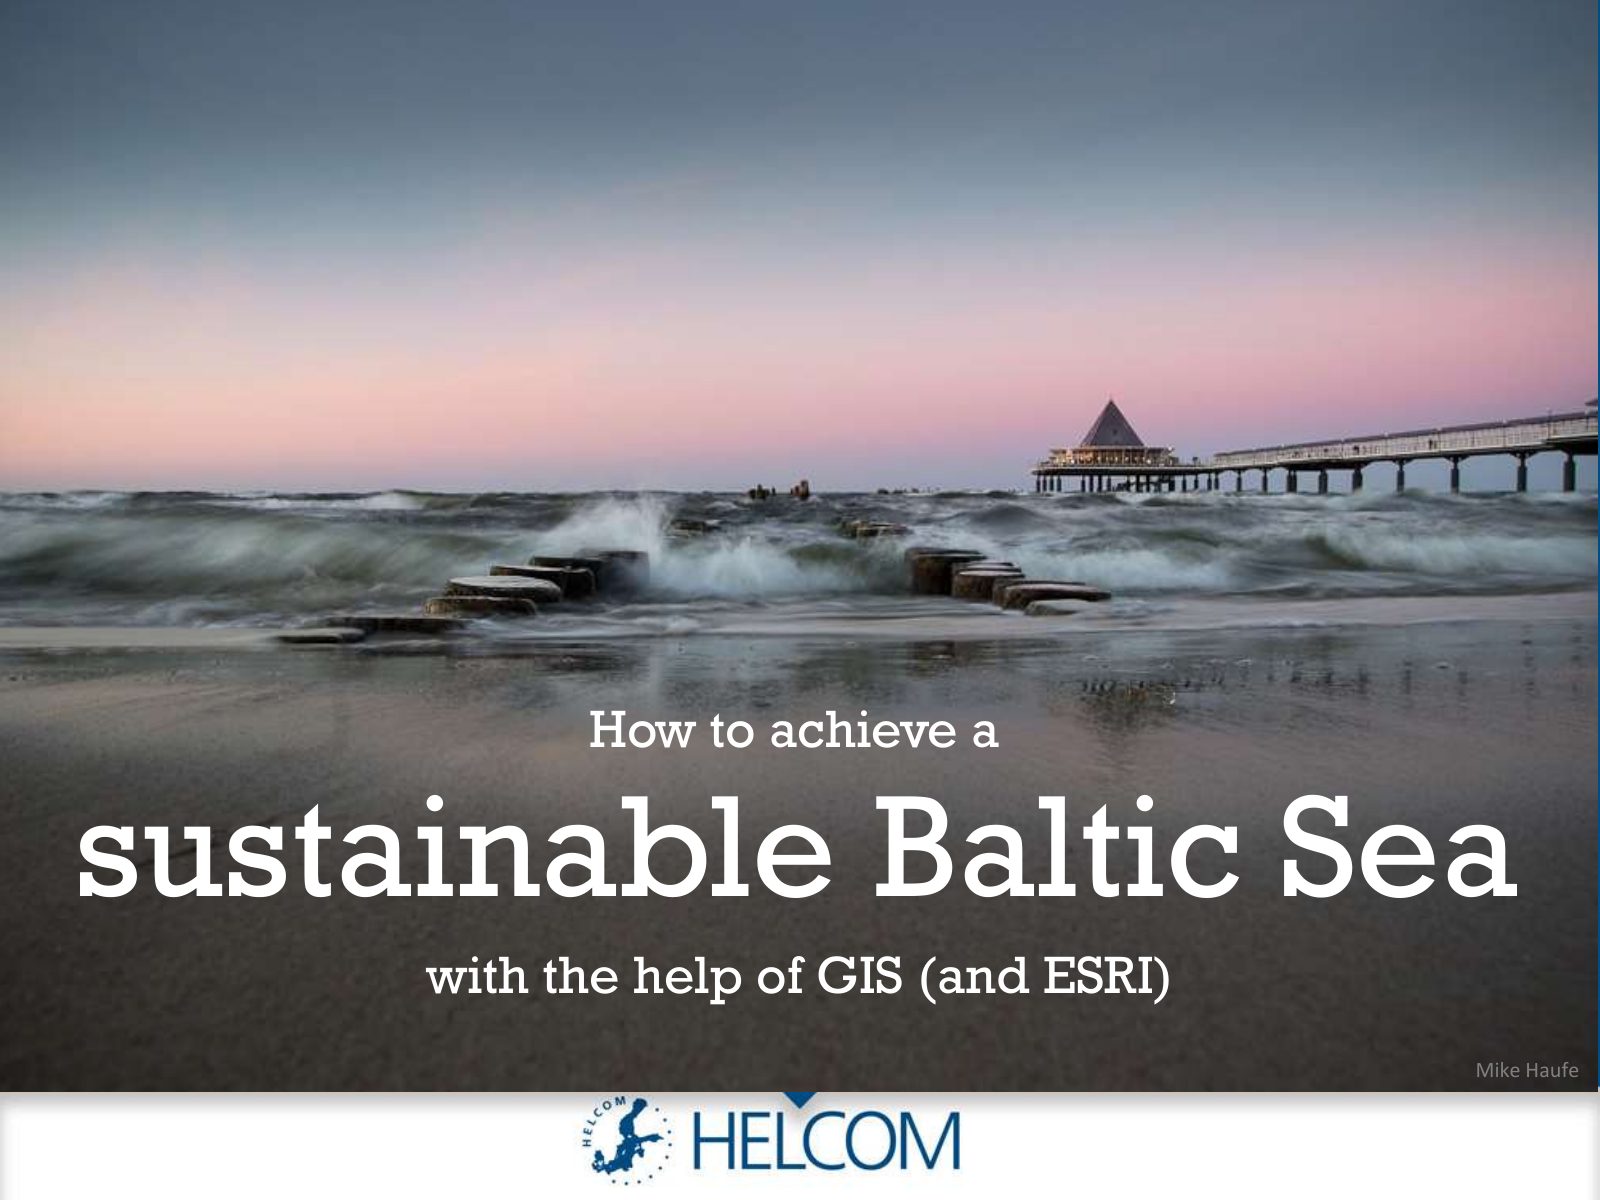
How to achieve a sustainable Baltic Sea with the help of GIS (and Esri)

2018 · 95 slides · HELCOM data & GIS

A light-hearted double act on how GIS helps HELCOM look after the Baltic Sea.

Slide 1 of 95: How to achieve a sustainable Baltic Sea with the help of GIS (and ESRI) Mike Haufe
Slide 2 of 95: Hello! I am Manuel Frias. I dare to say that after this presentation you’ll be a lot wiser. Isn’t it so, Joni?
Slide 3 of 95: True, Manuel! Hello, I am Joni Kaitaranta and among other things you will know that the Baltic Sea is fragile…
Slide 4 of 95: …and that it’s is not feeling good…
Slide 5 of 95: …and that there is a thing called HELCOM who is a kind of a doctor of the Baltic Sea…
Slide 6 of 95: …and that there is a medicine called Geographical Information System (GIS)…
Slide 7 of 95: Exactly! But let’s stop talking. Shall we start?
Slide 8 of 95: Yes! Let’s go!
Slide 9 of 95: The Baltic Sea is unique and fragile
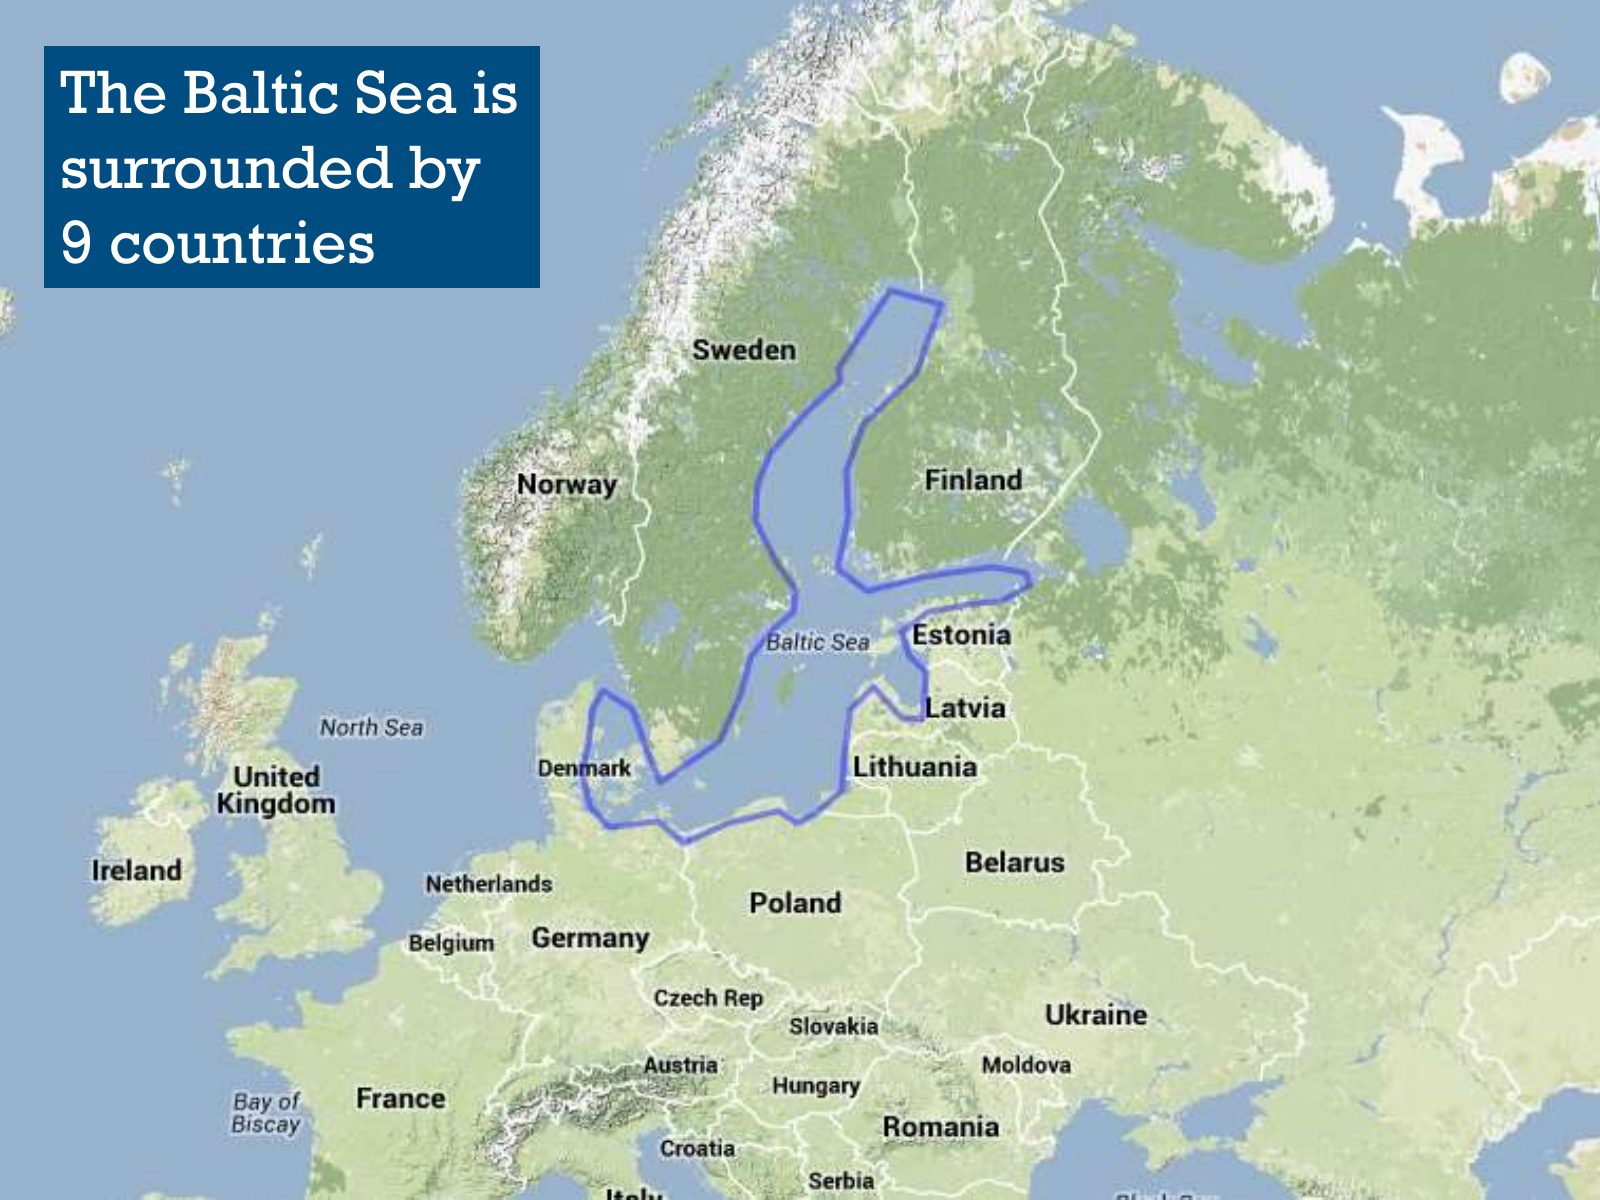
Slide 10 of 95: The Baltic Sea is surrounded by 9 countries
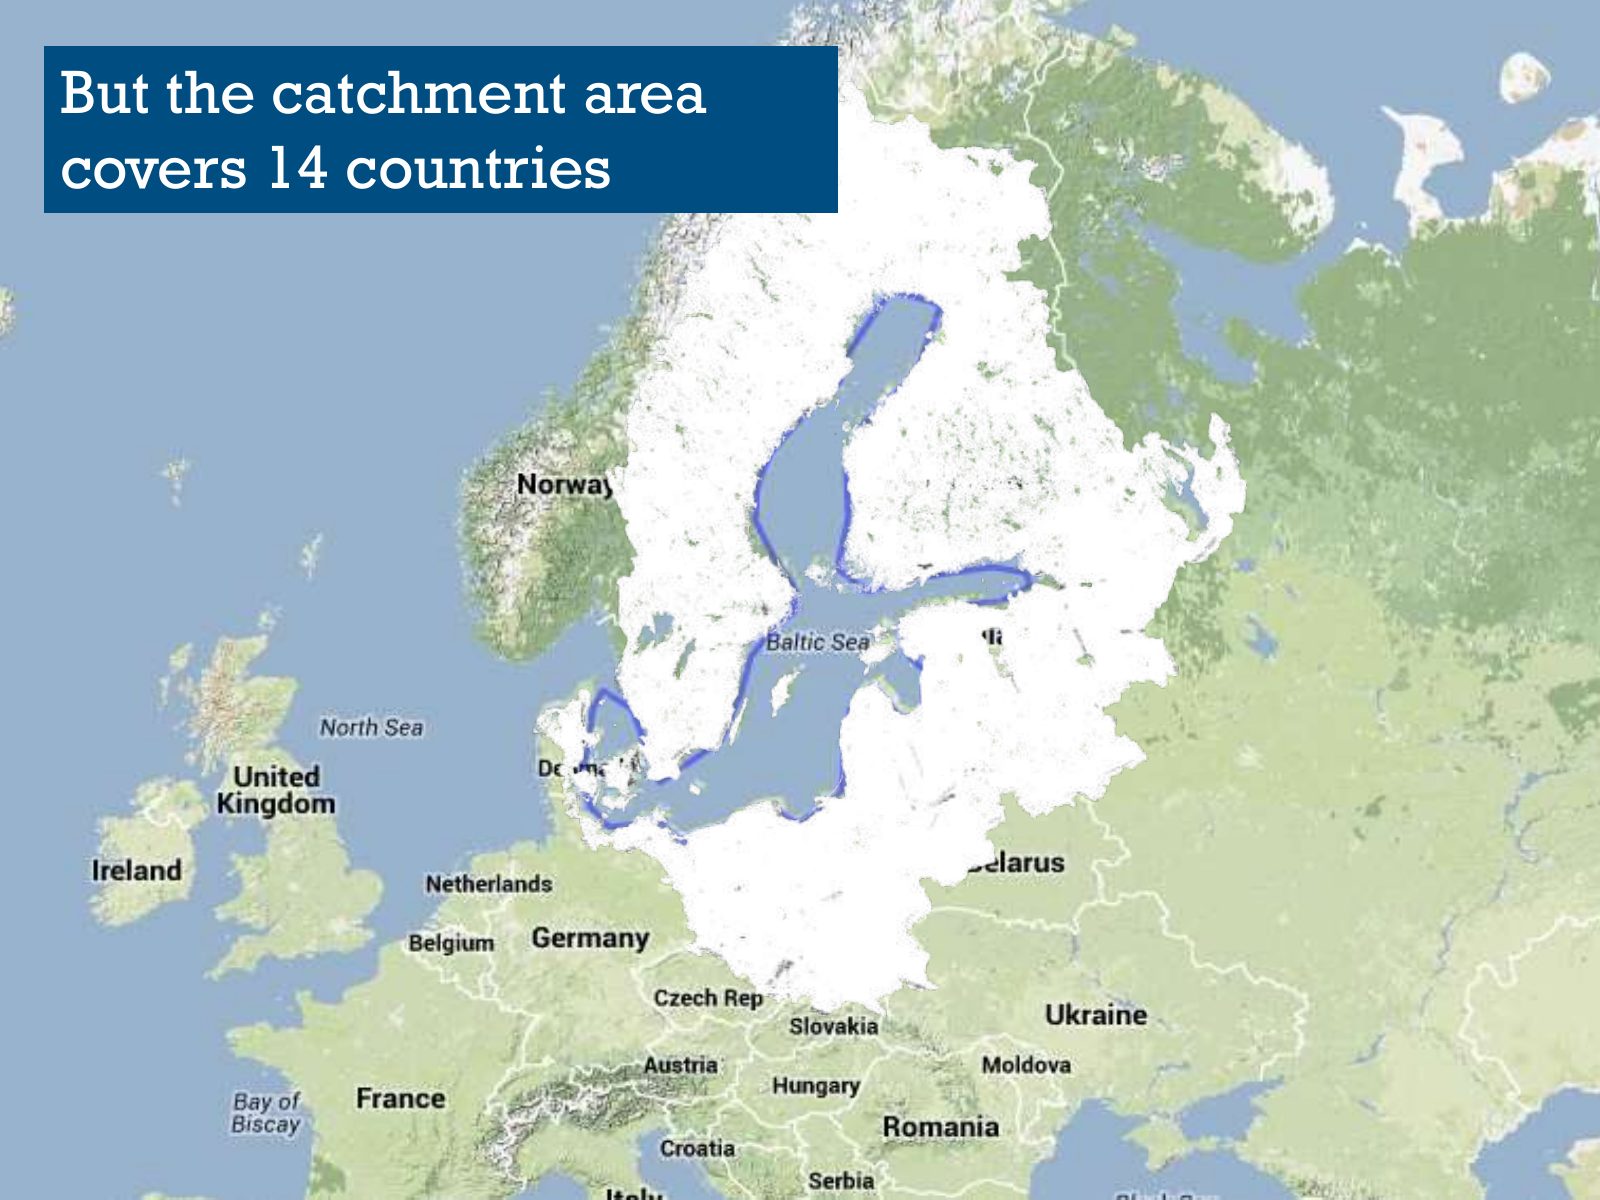
Slide 11 of 95: But the catchment area covers 14 countries
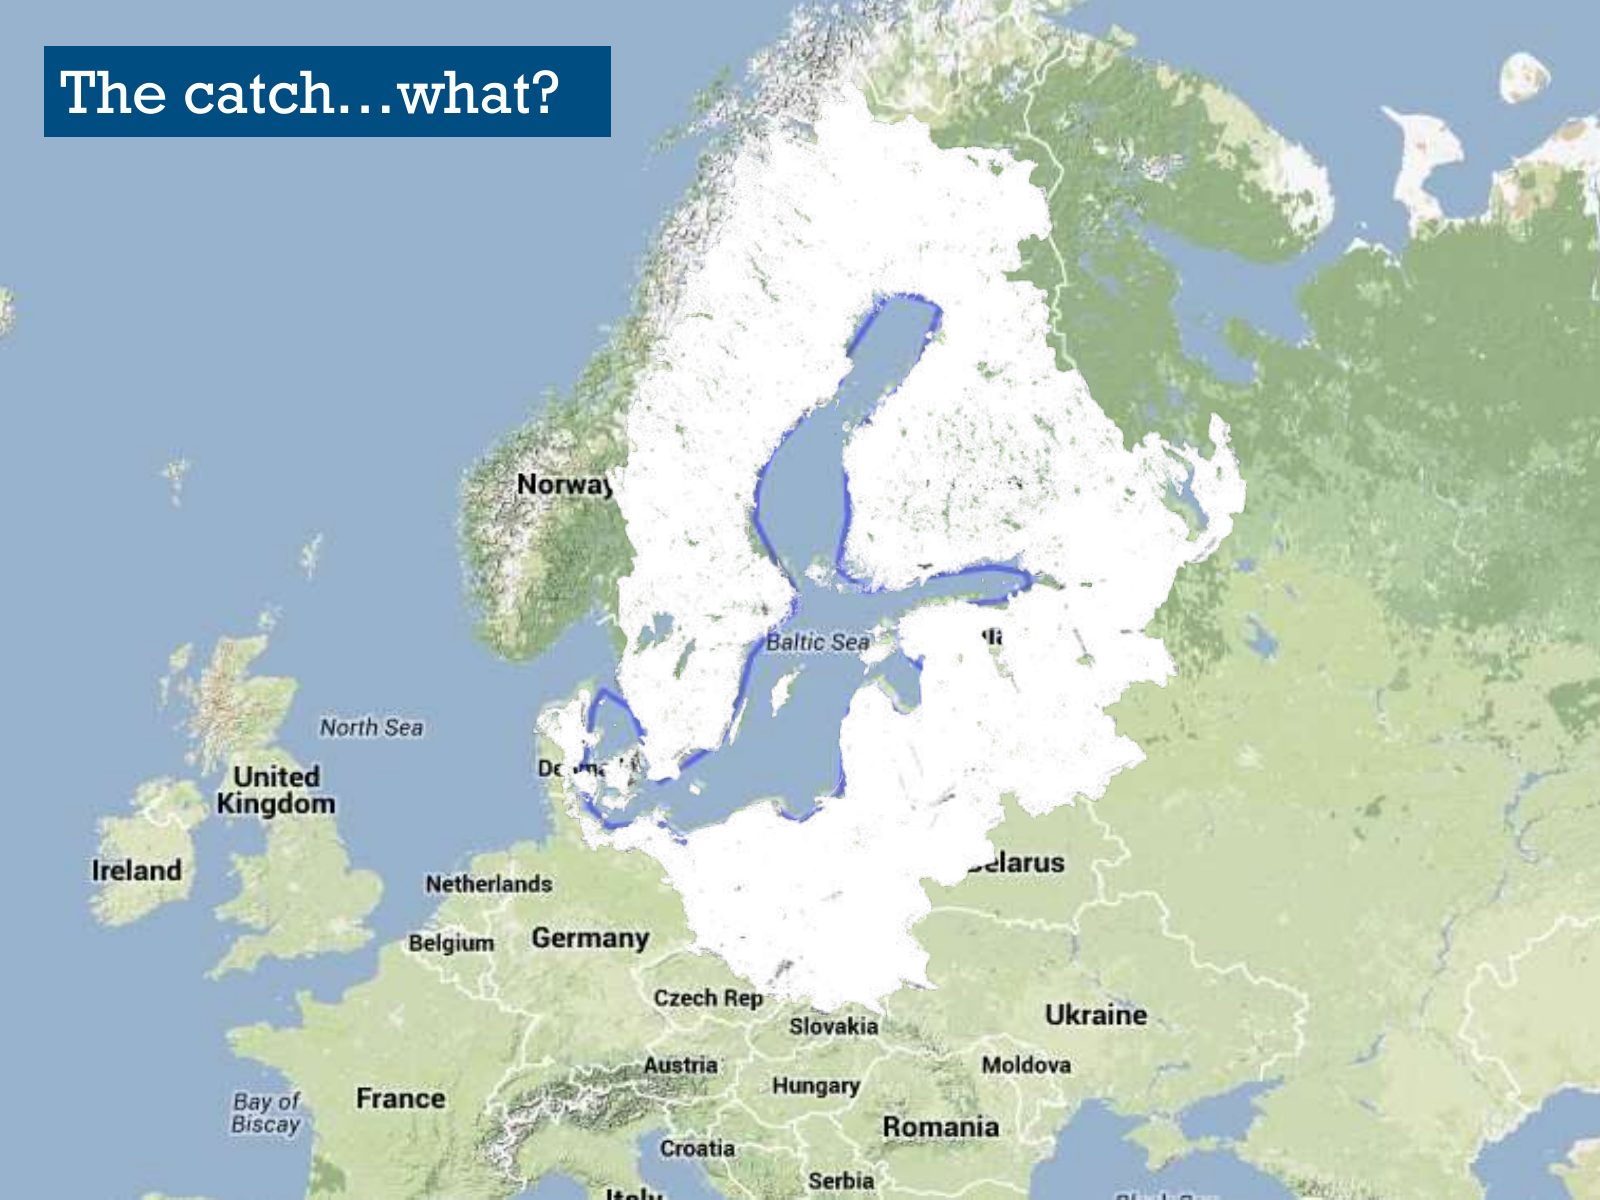
Slide 12 of 95: The catch…what?
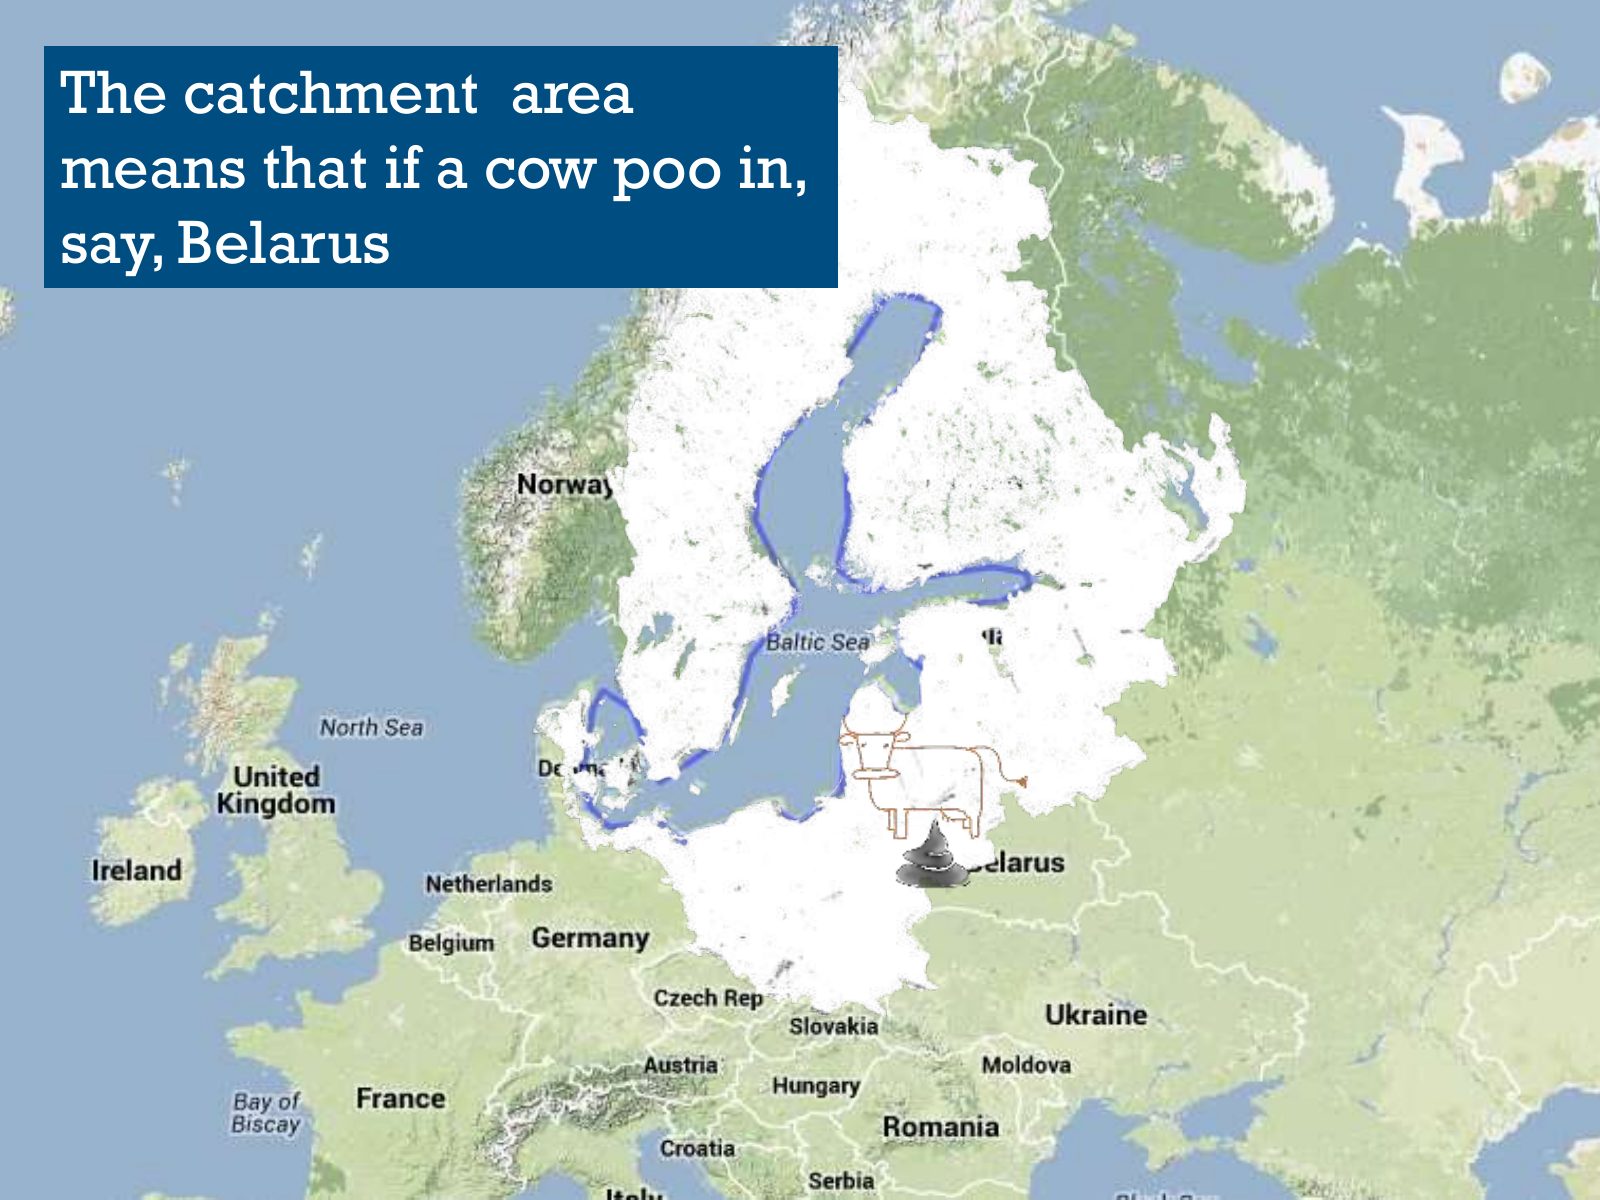
Slide 13 of 95: The catchment area means that if a cow poo in, say, Belarus
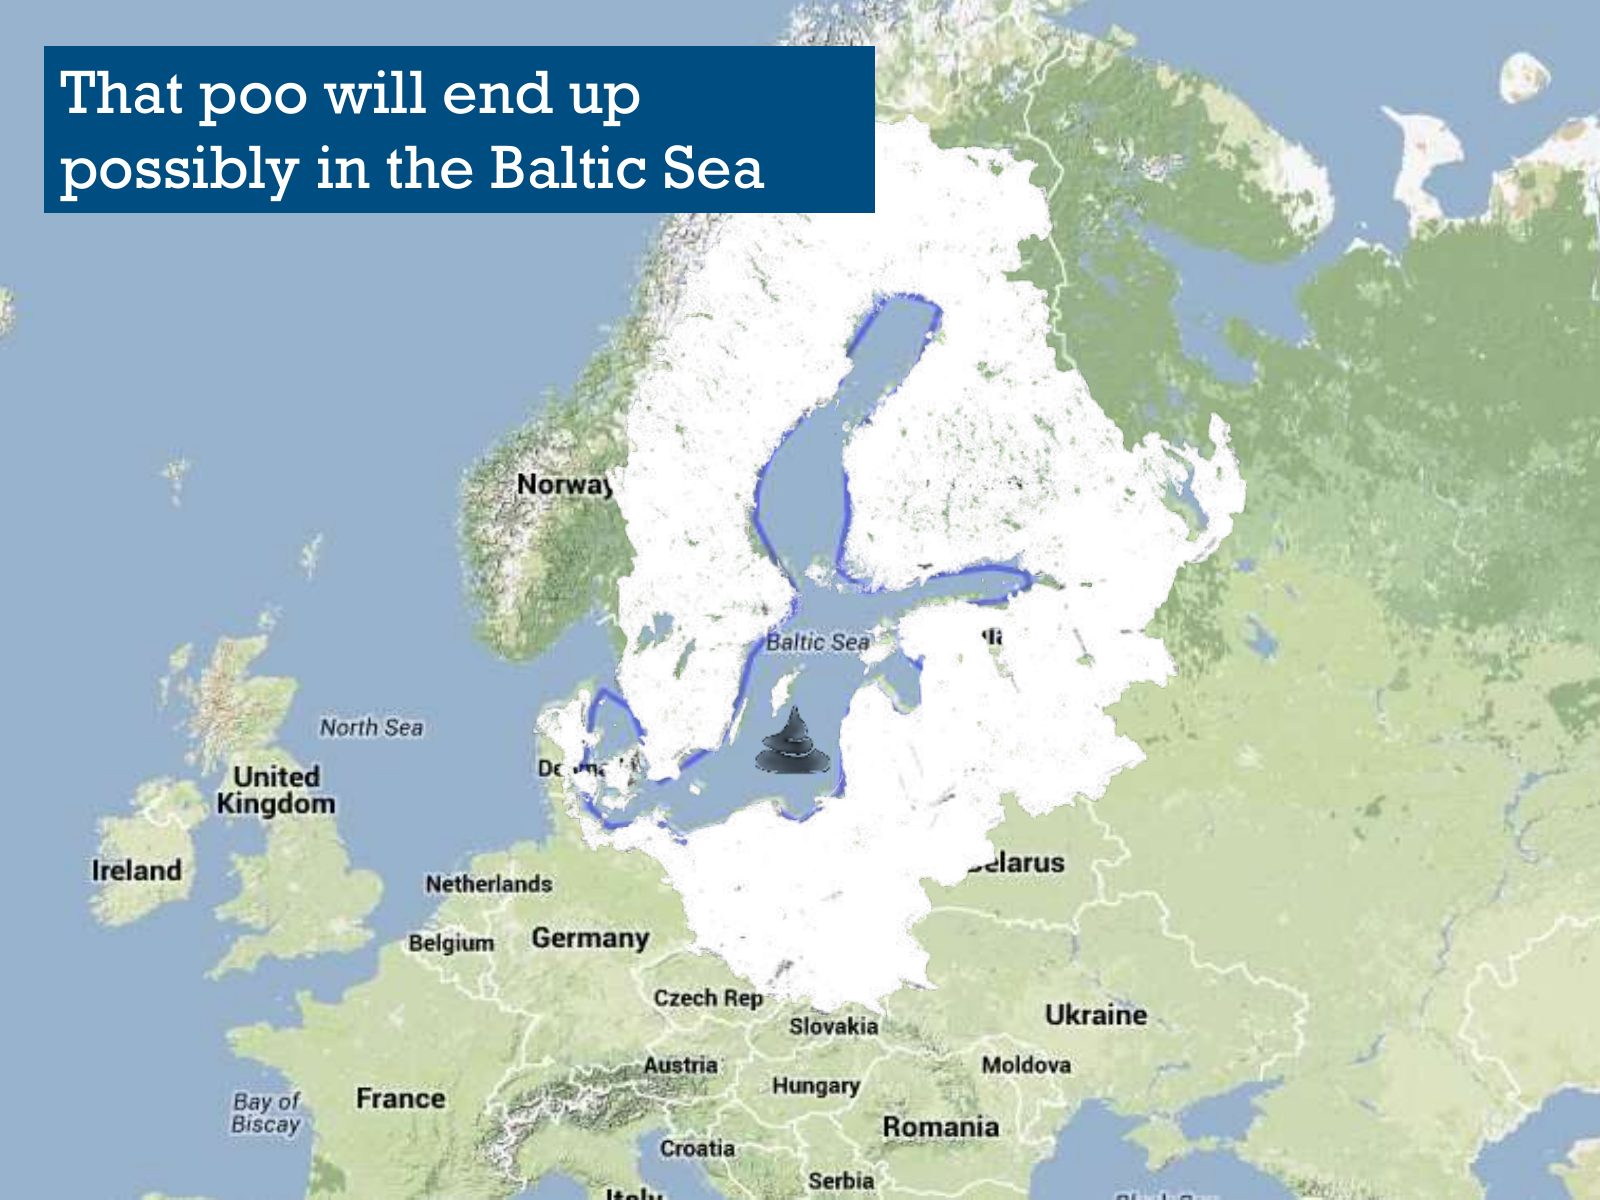
Slide 14 of 95: That poo will end up possibly in the Baltic Sea
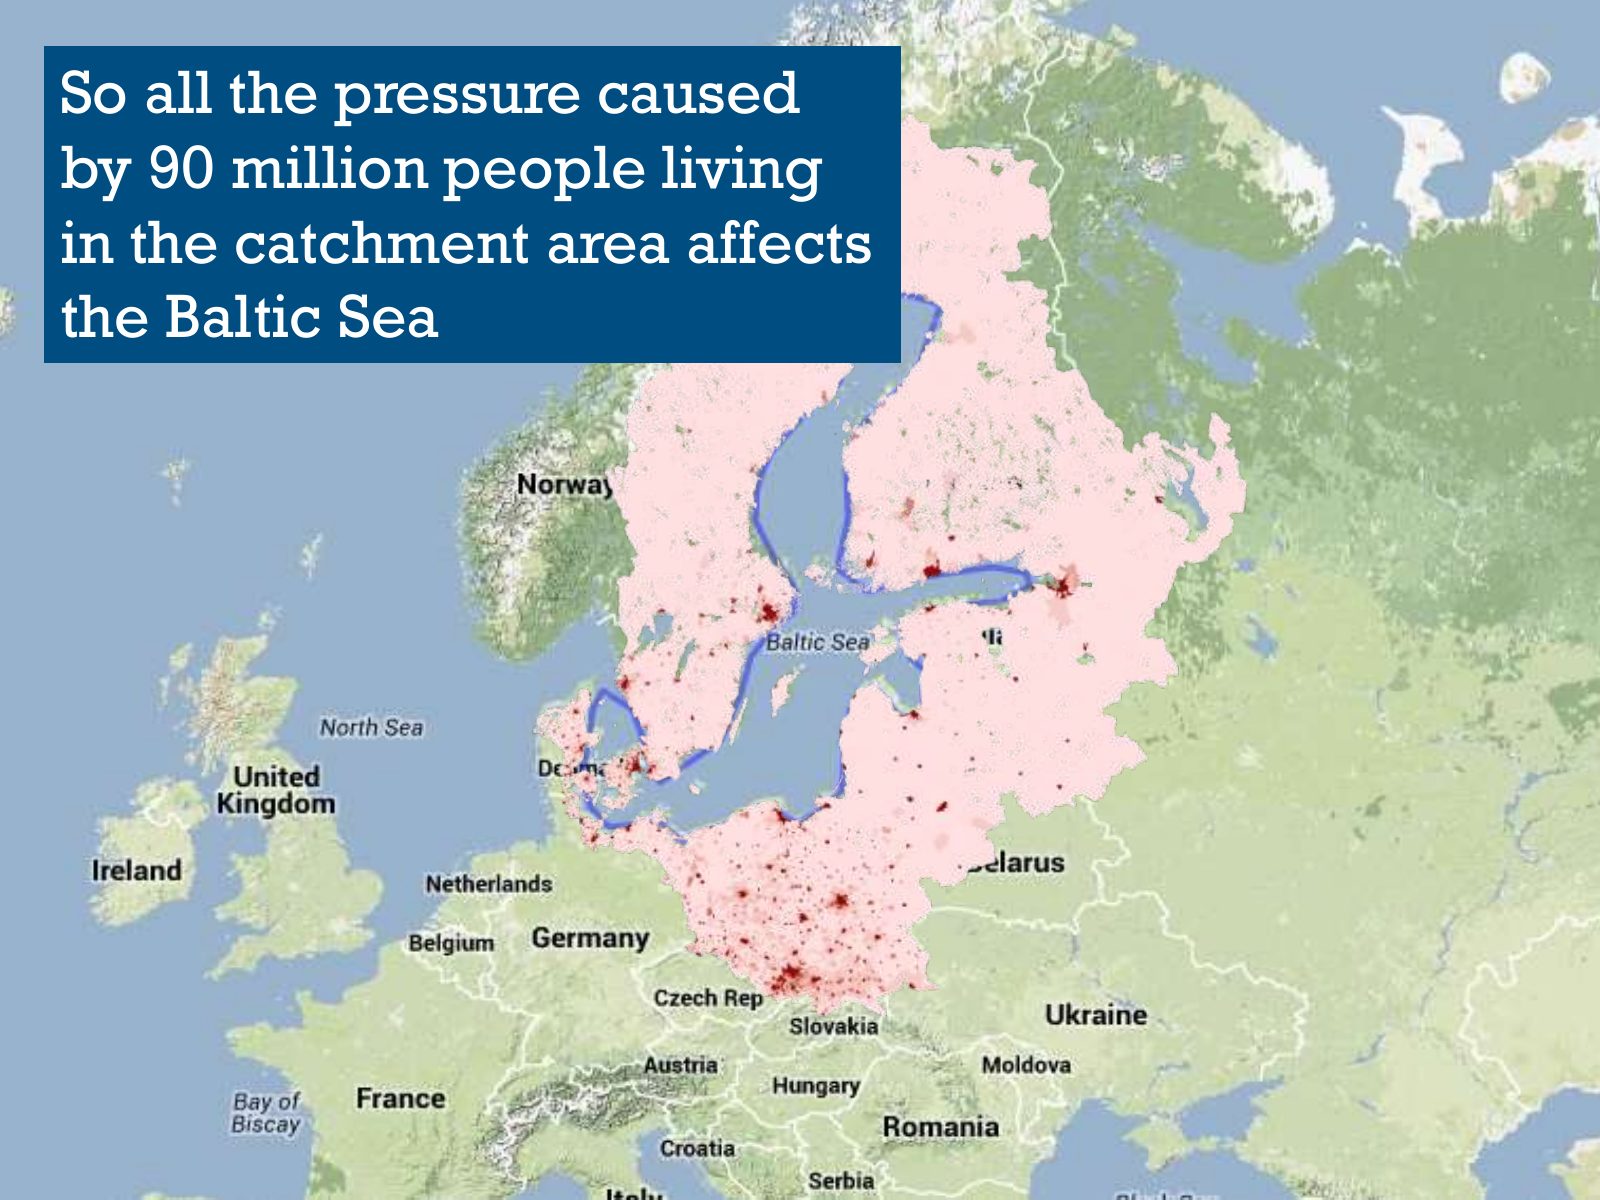
Slide 15 of 95: So all the pressure caused by 90 million people living in the catchment area affects the Baltic Sea
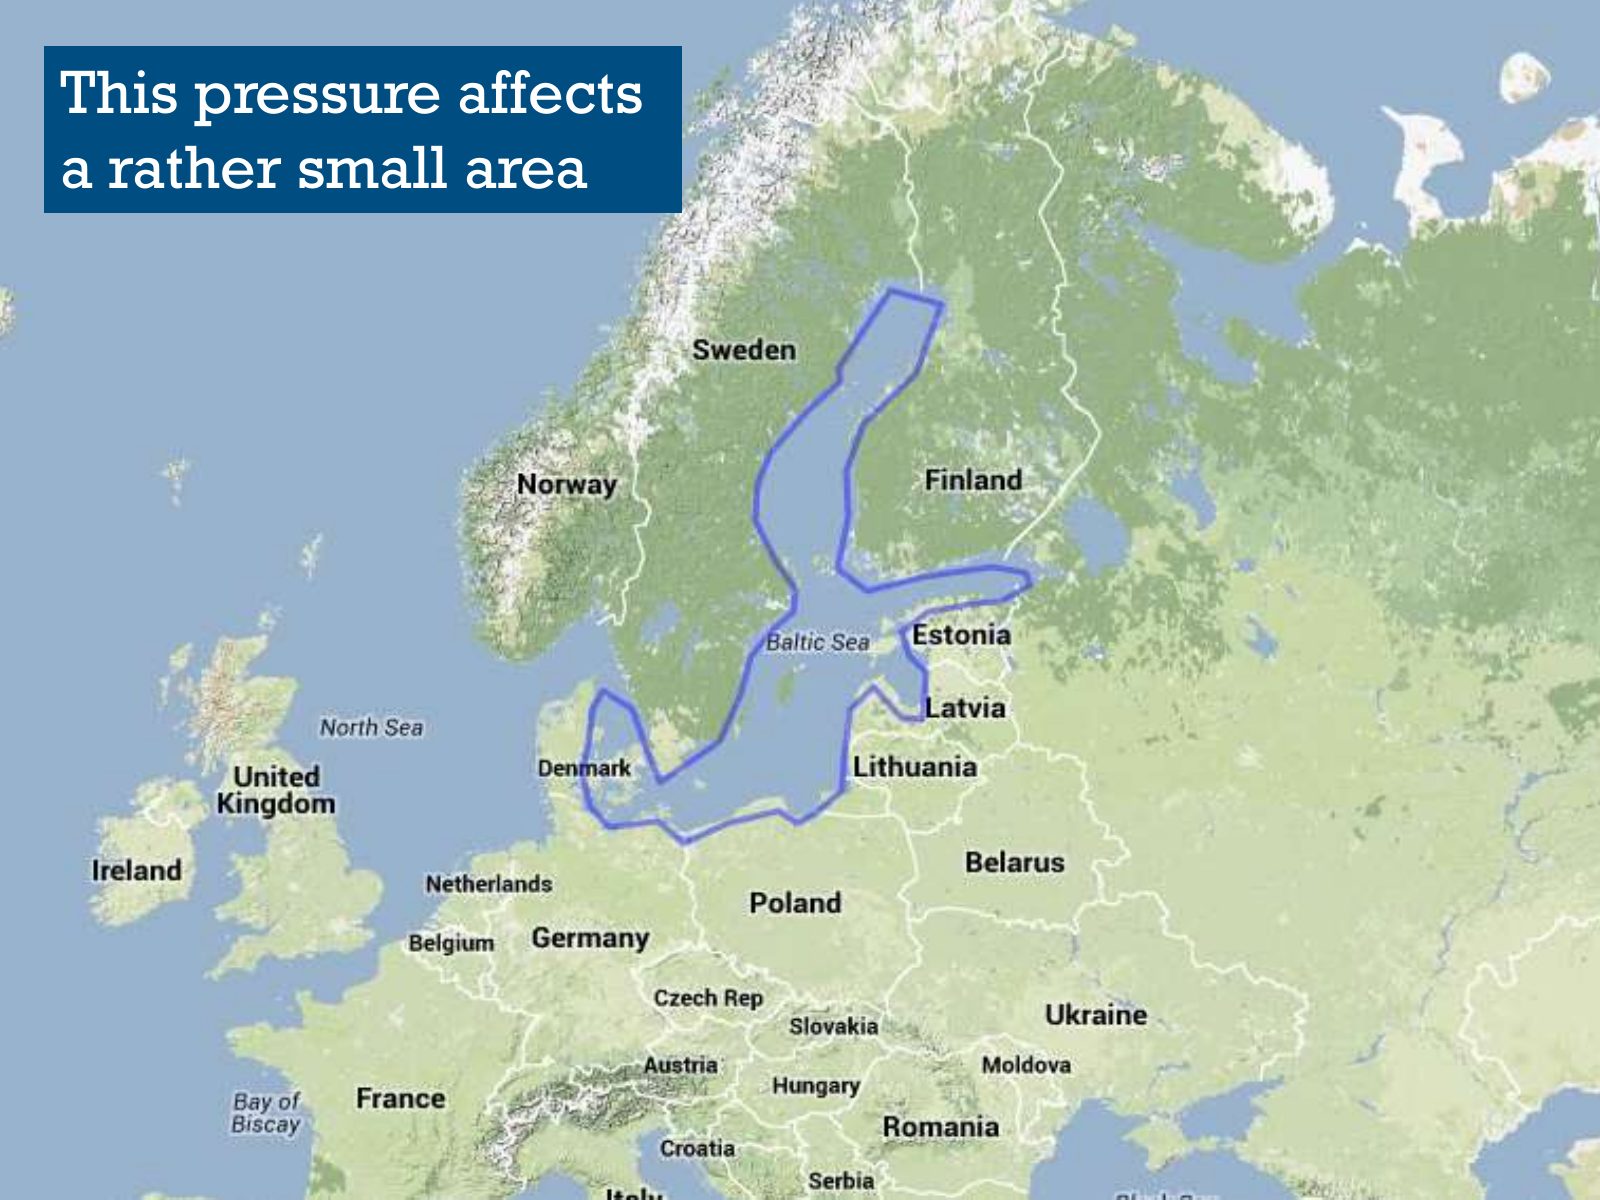
Slide 16 of 95: This pressure affects a rather small area
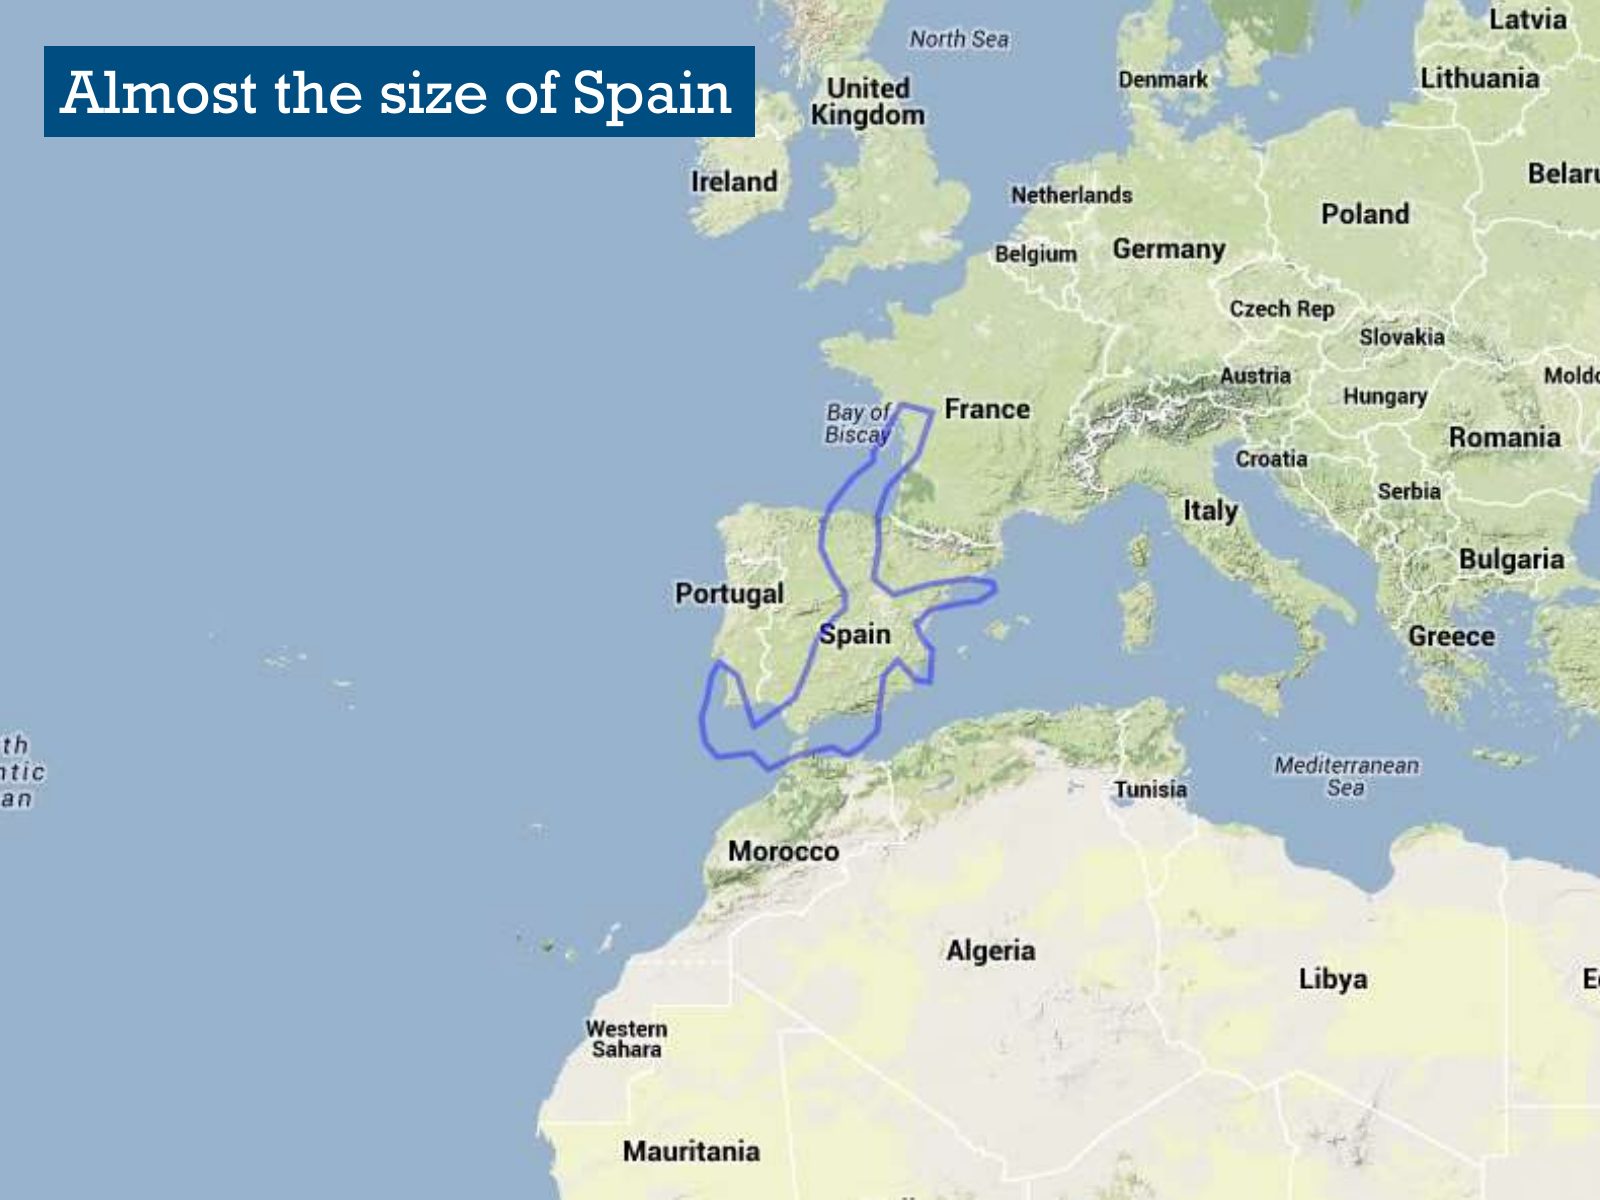
Slide 17 of 95: Almost the size of Spain
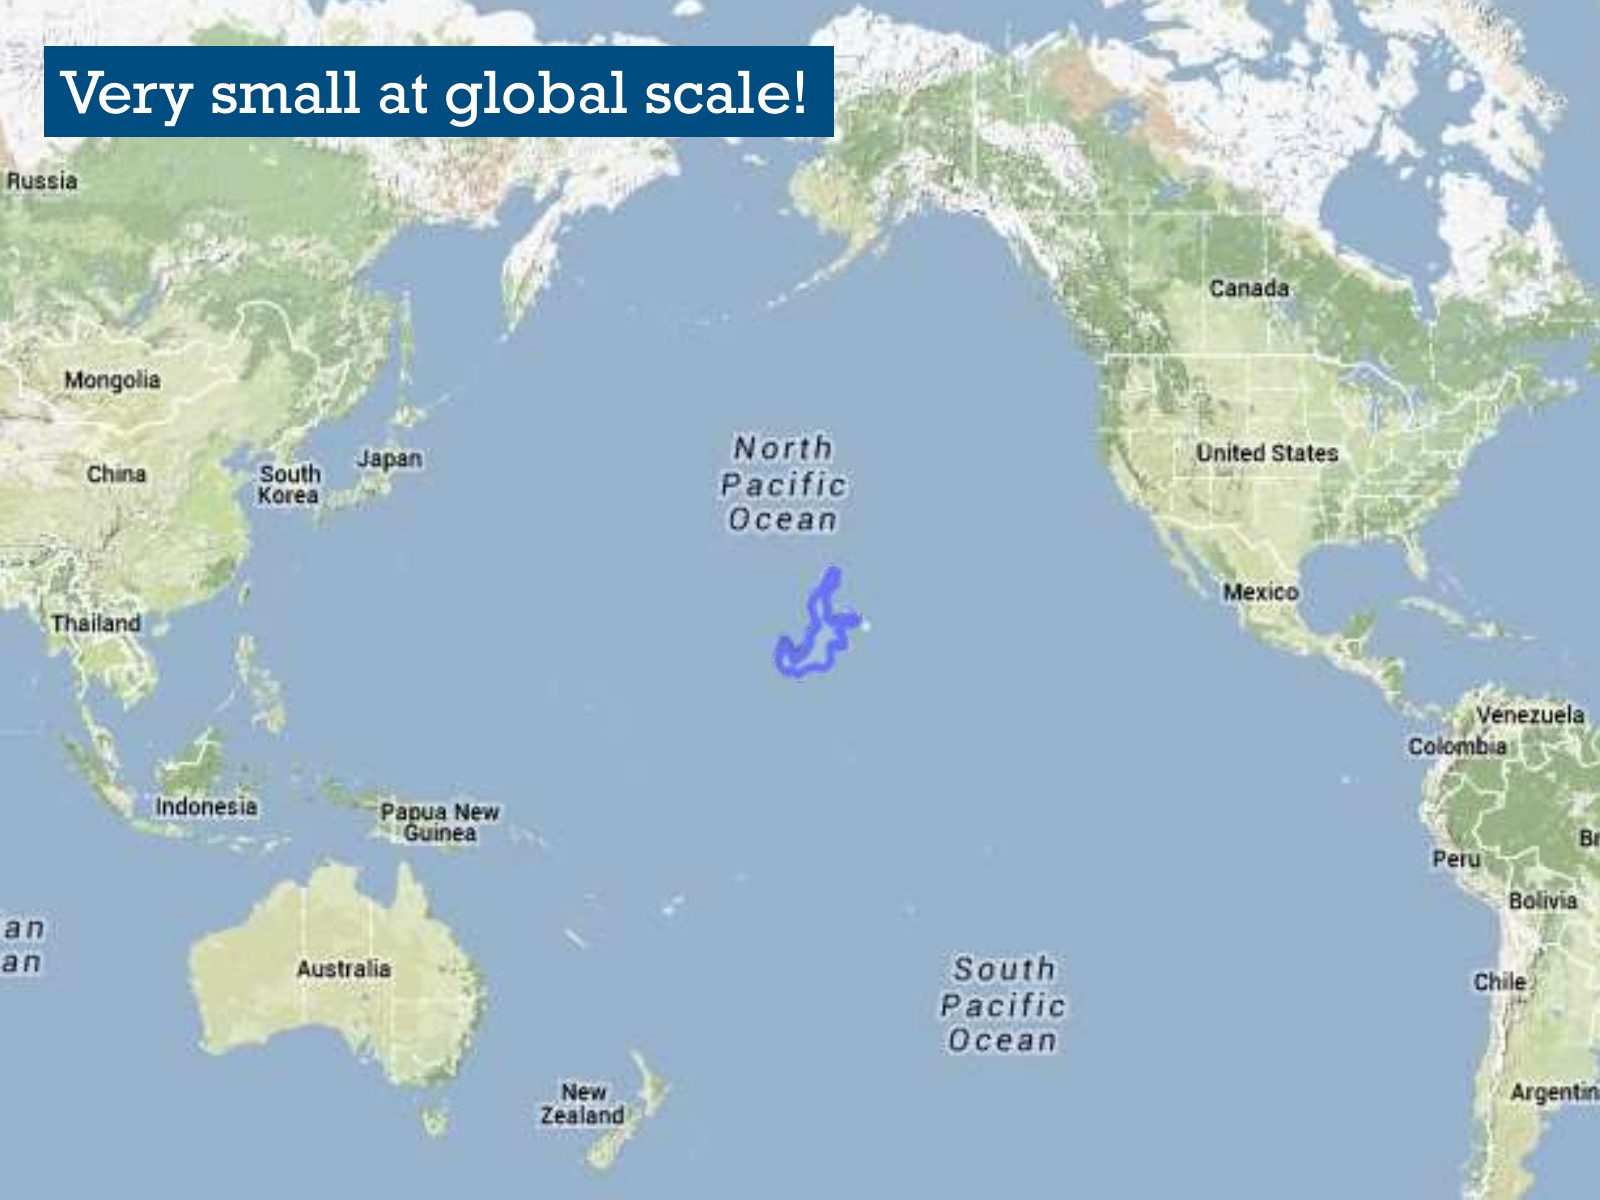
Slide 18 of 95: Very small at global scale!
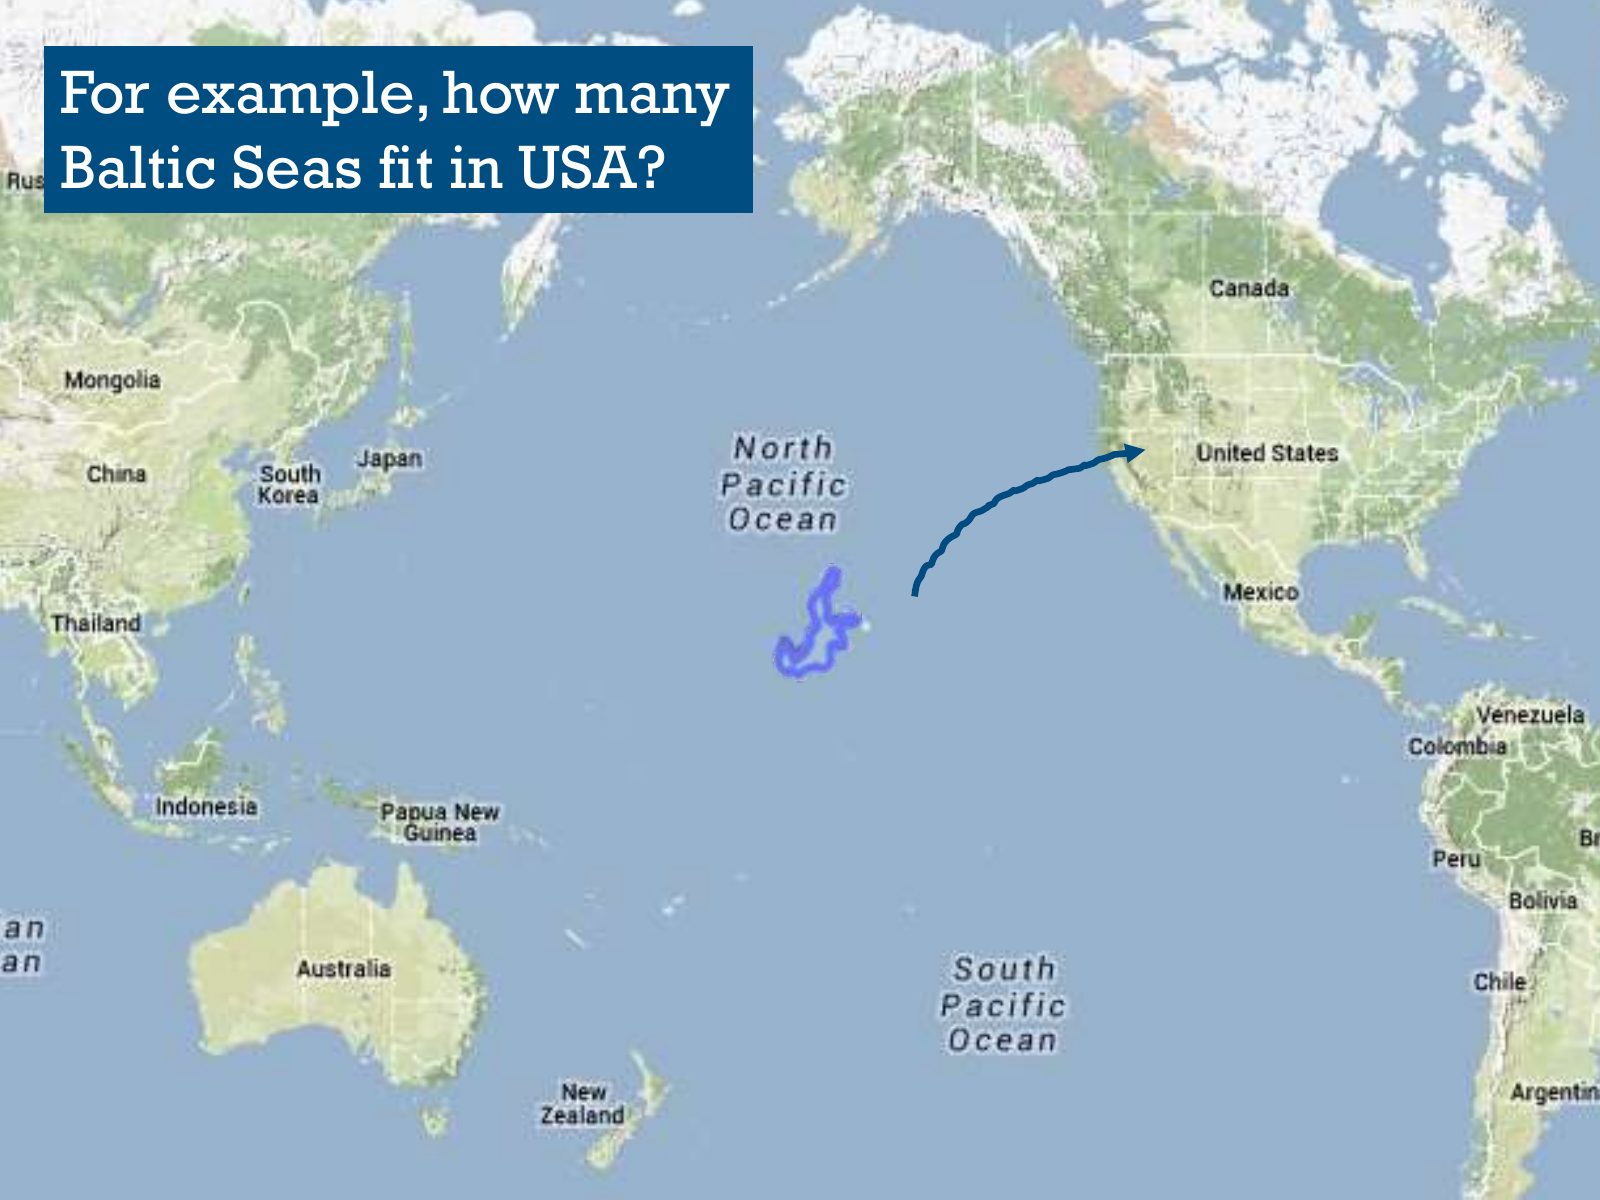
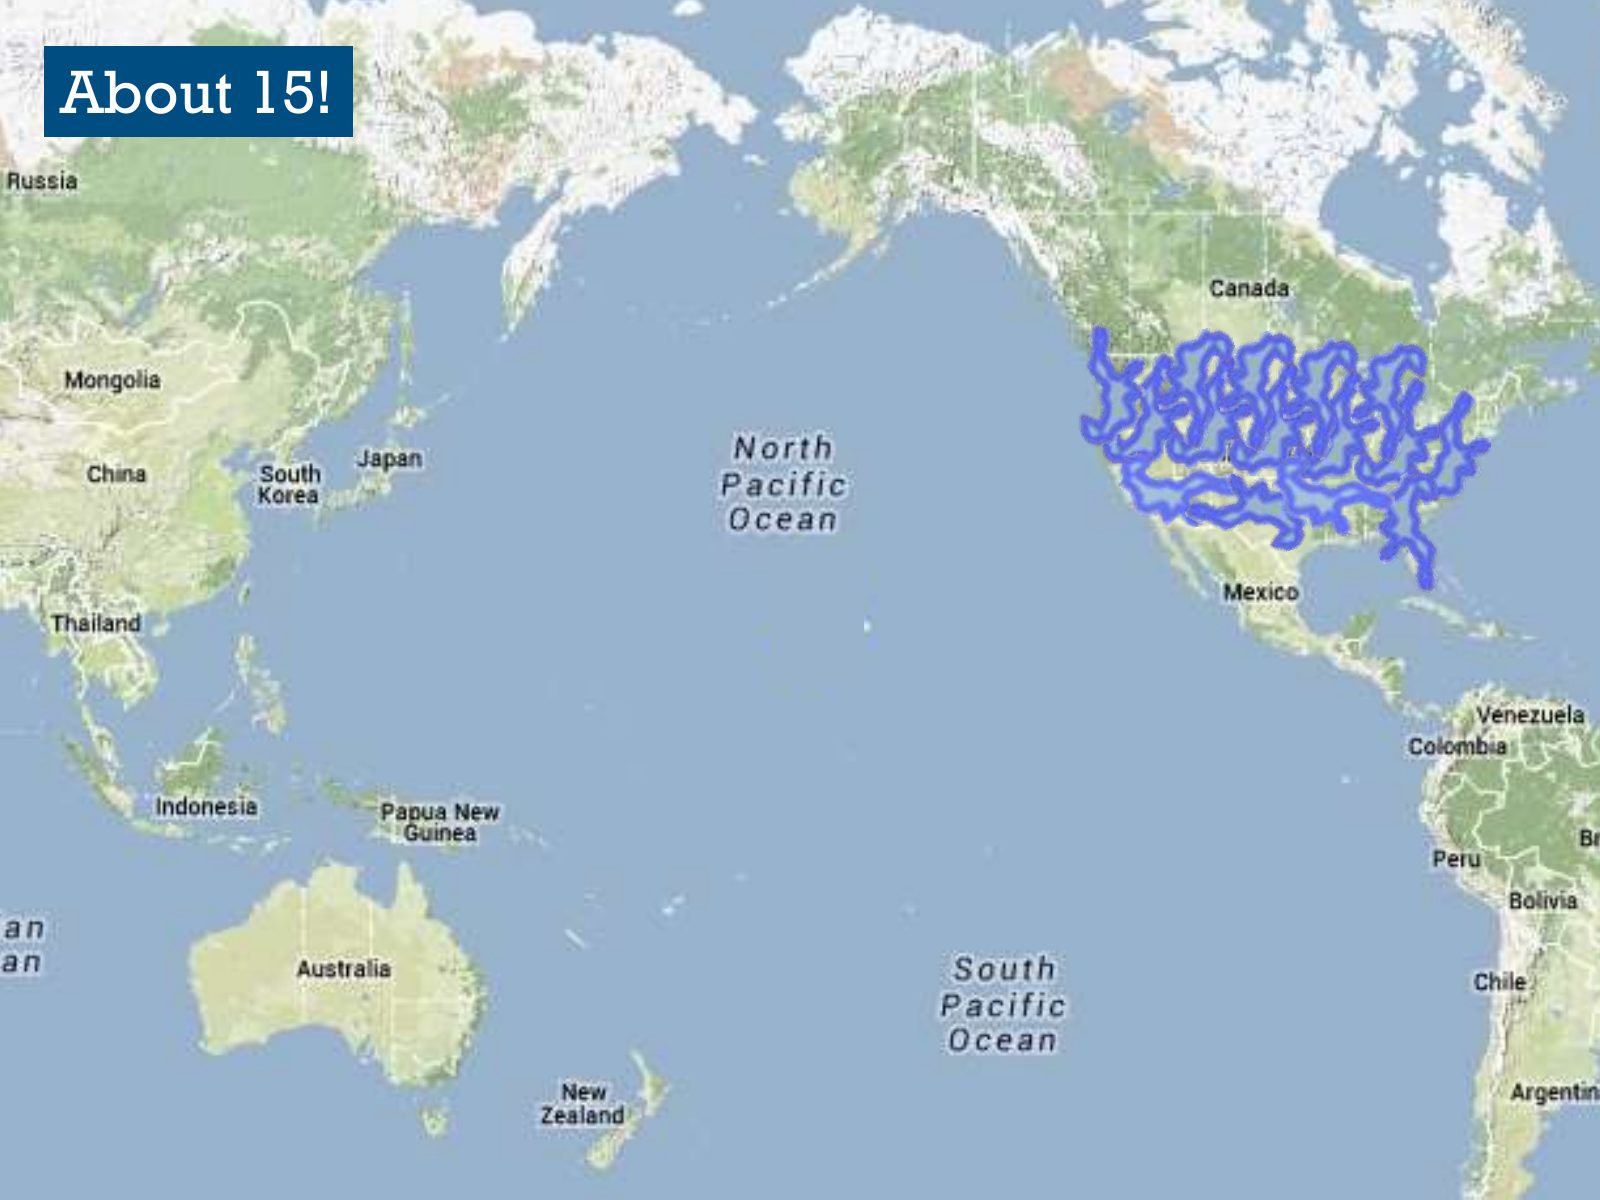
Slide 19 of 95: For example, how many Baltic Seas fit in USA?
Slide 20 of 95: About 15!
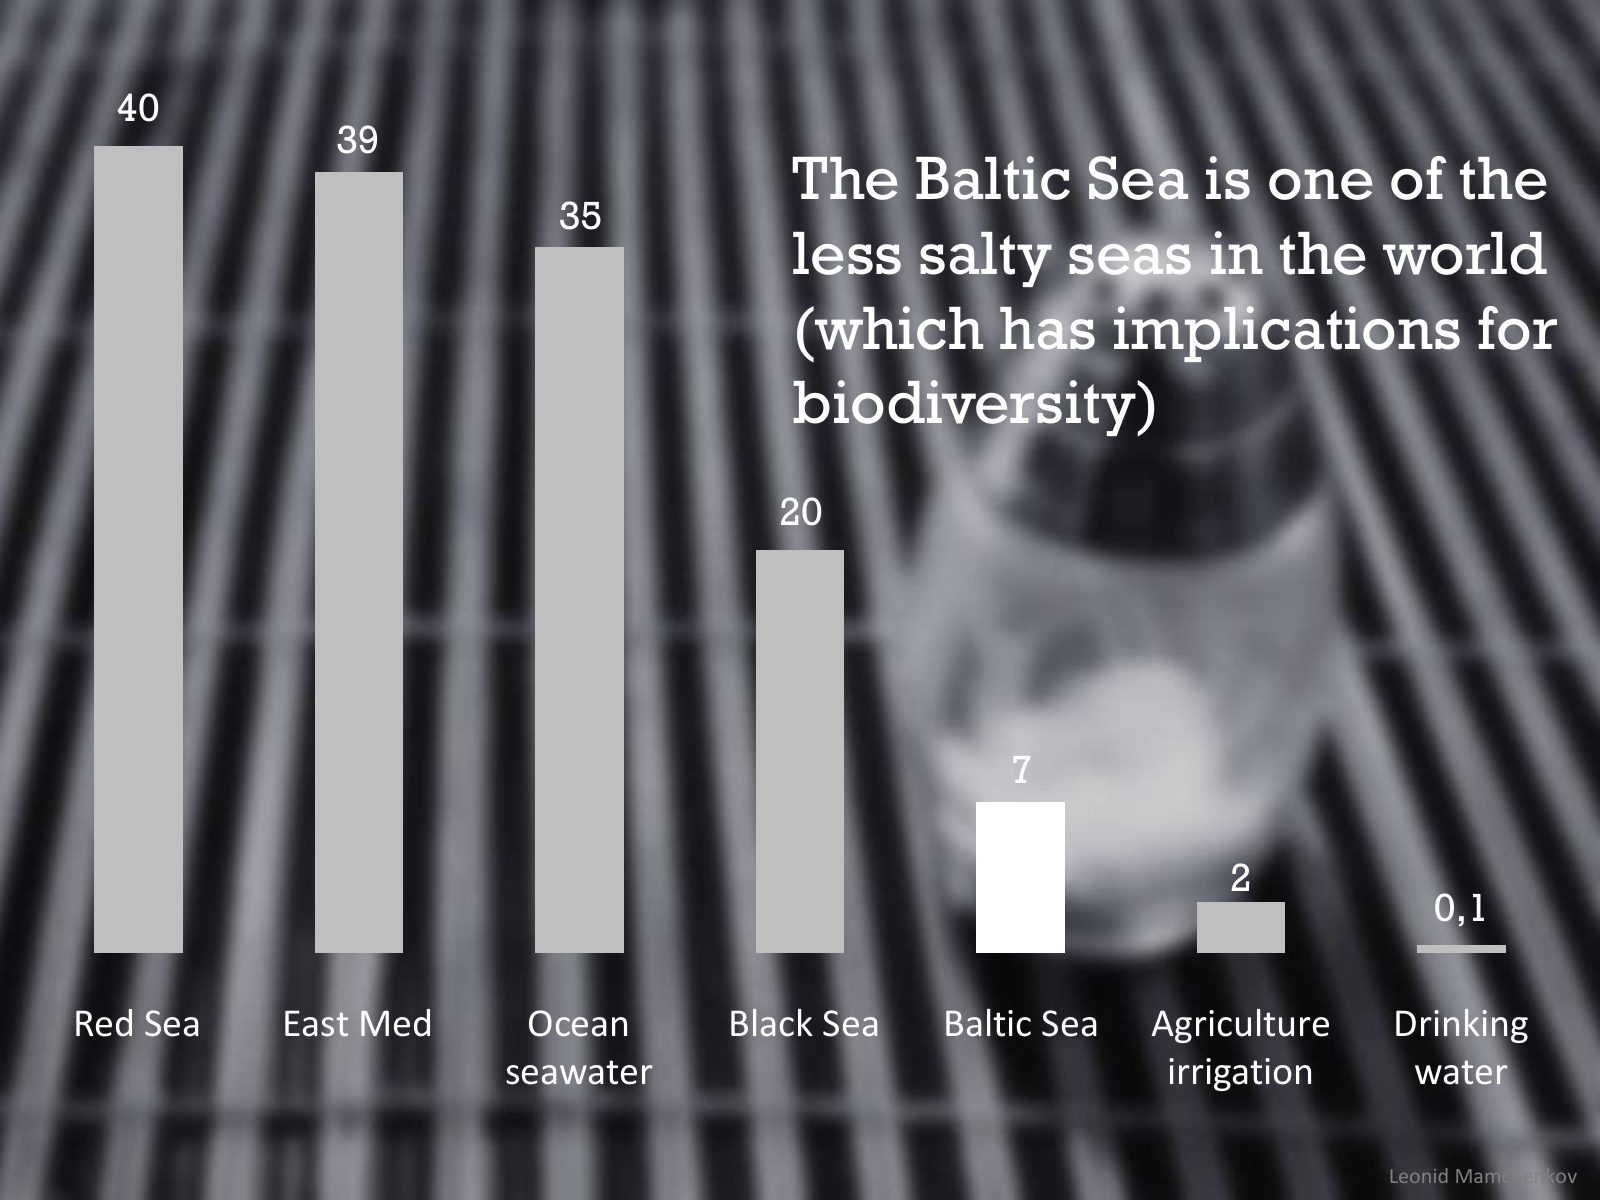
Slide 21 of 95: 40 39 35 The Baltic Sea is one of the less salty seas in the world (which has implications for biodiversity) 20 7 2 0,1 Red Sea East Med Ocean Black Sea Balt…
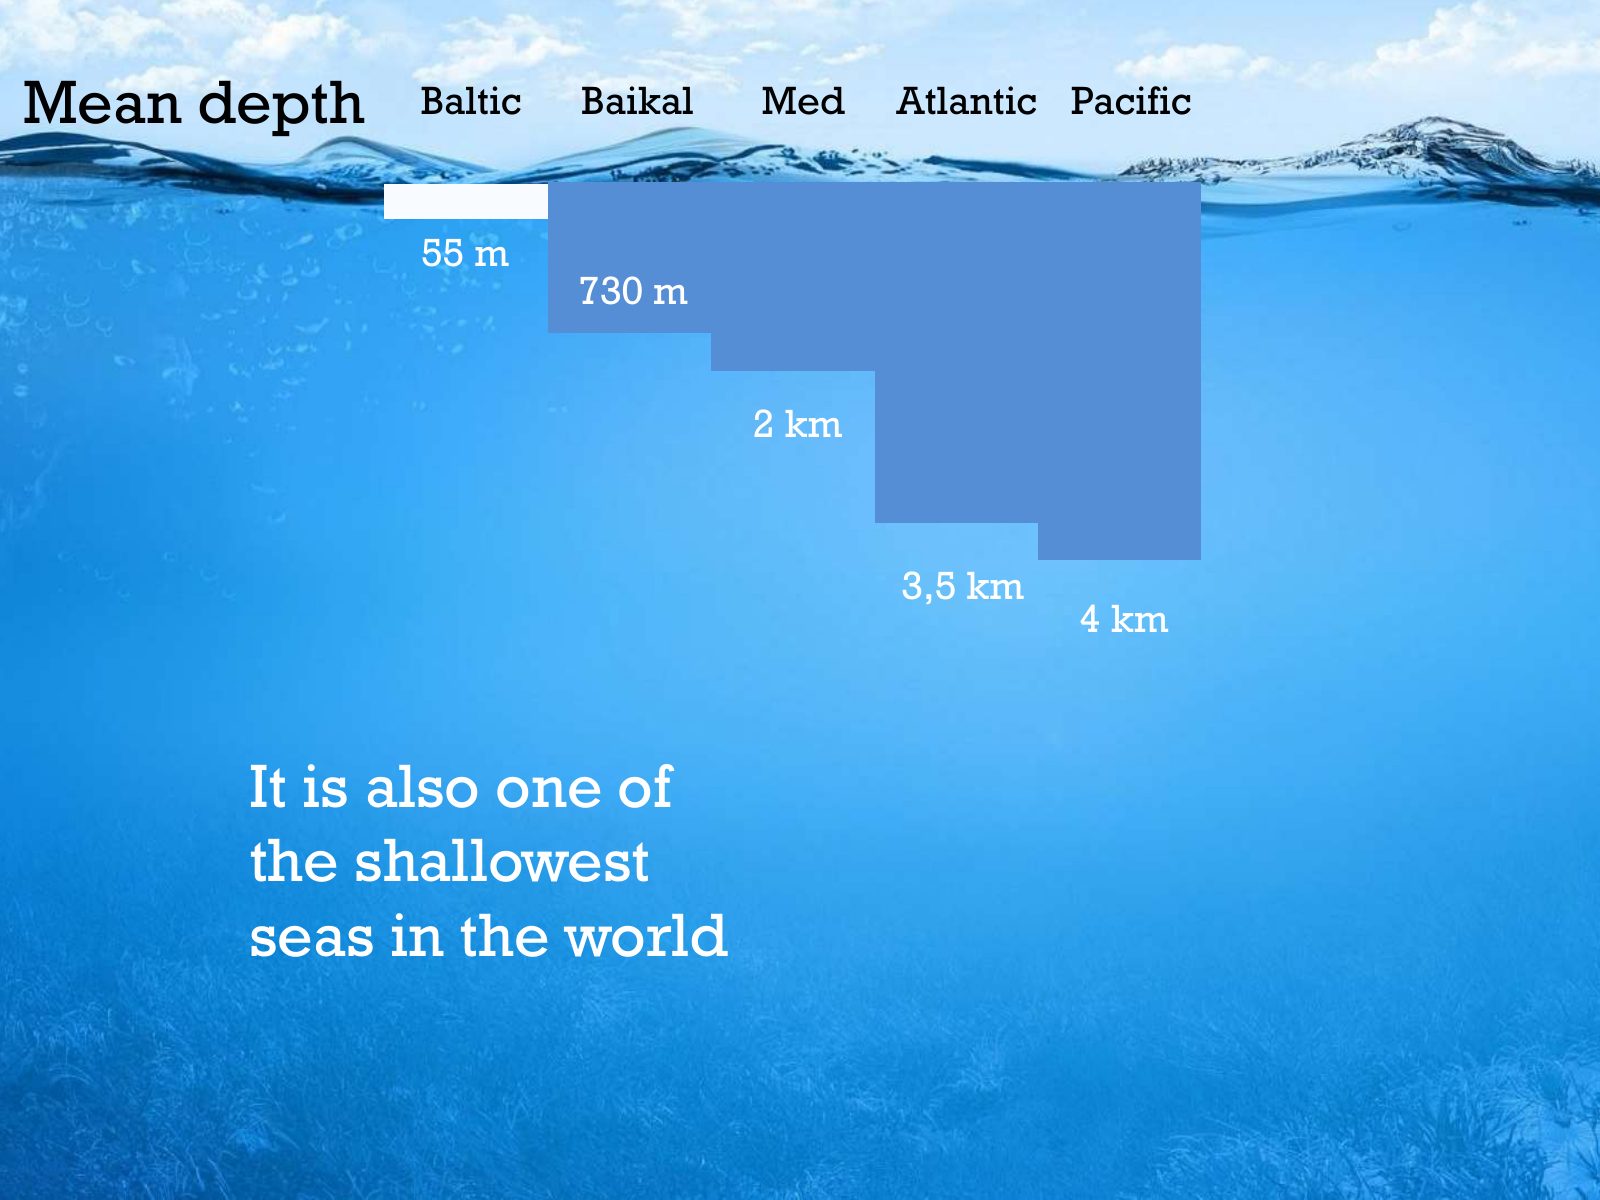
Slide 22 of 95: Mean depth Baltic Baikal Med Atlantic Pacific 55 m 730 m 2 km 3,5 km 4 km It is also one of the shallowest seas in the world
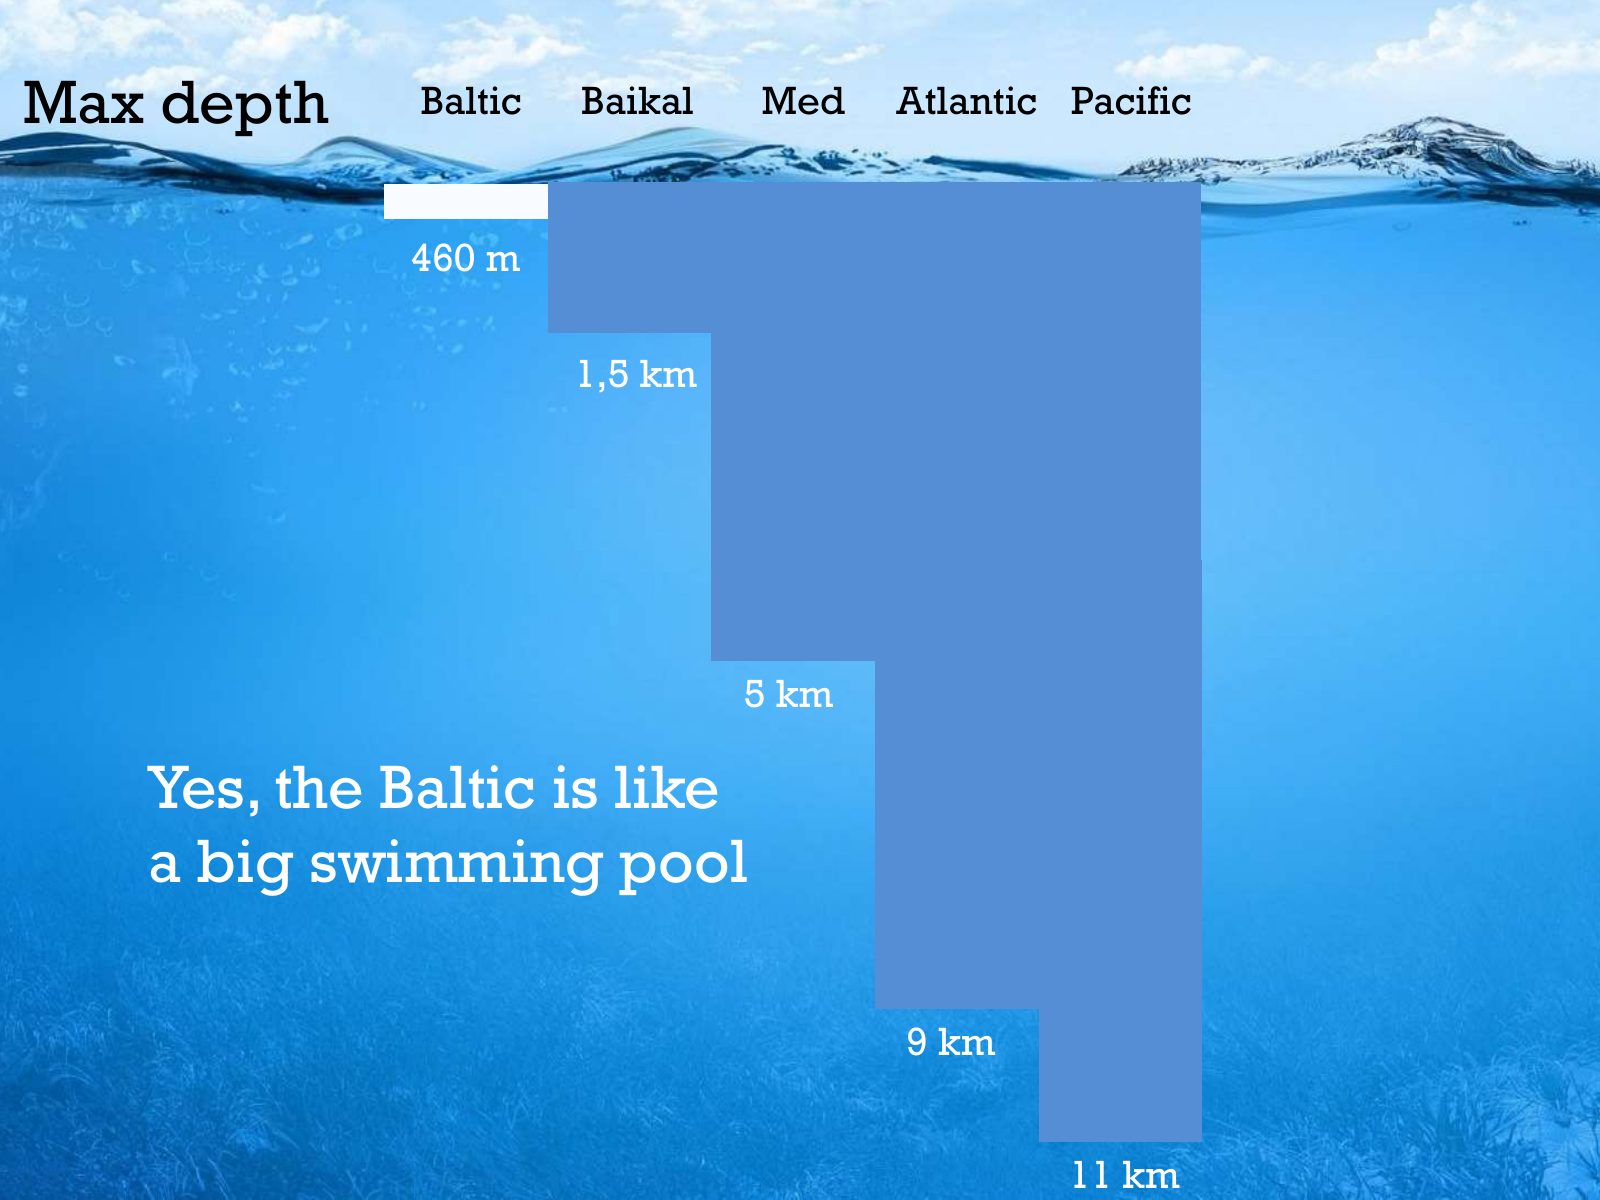
Slide 23 of 95: Max depth Baltic Baikal Med Atlantic Pacific 460 m 1,5 km 5 km Yes, the Baltic is like a big swimming pool 9 km 11 km
Slide 24 of 95: The Baltic Sea is unique. These special characteristics make it very fragile…
Slide 25 of 95: Our dear sea has been so sick... and still is! That’s why HELCOM exists.
Slide 26 of 95: HELCOM? What’s that?
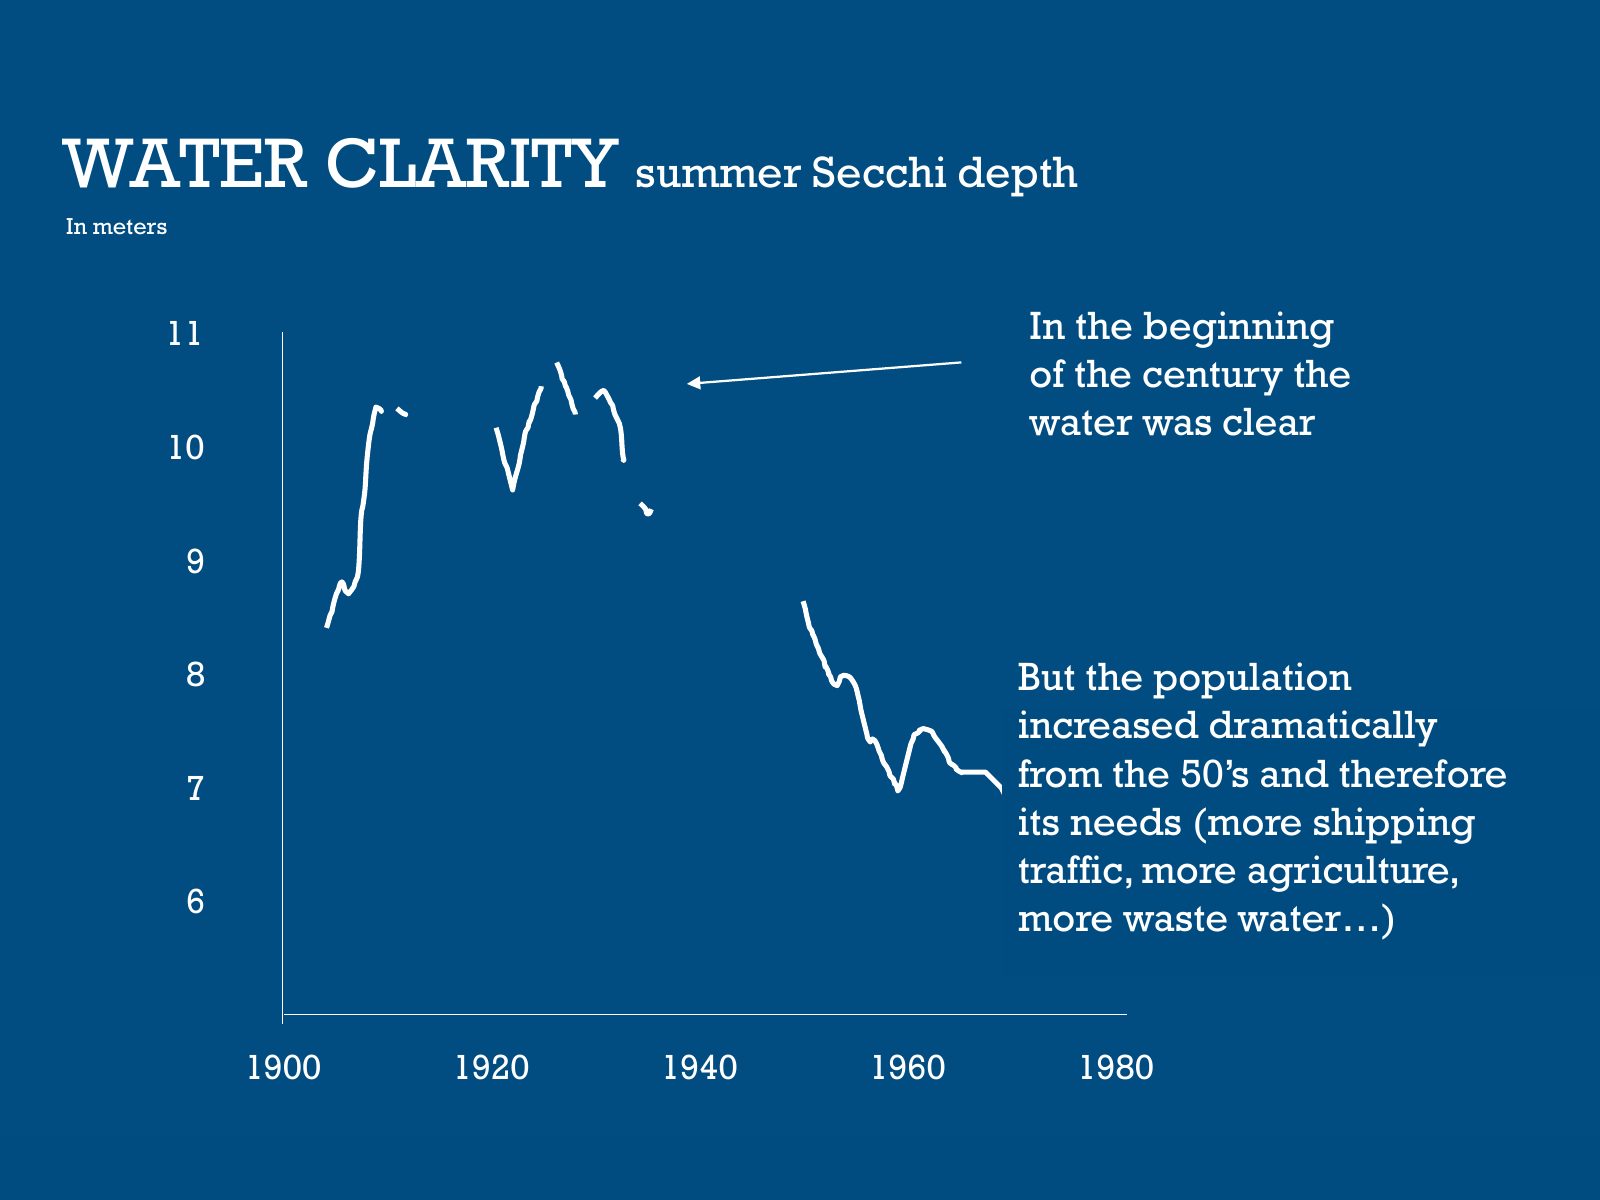
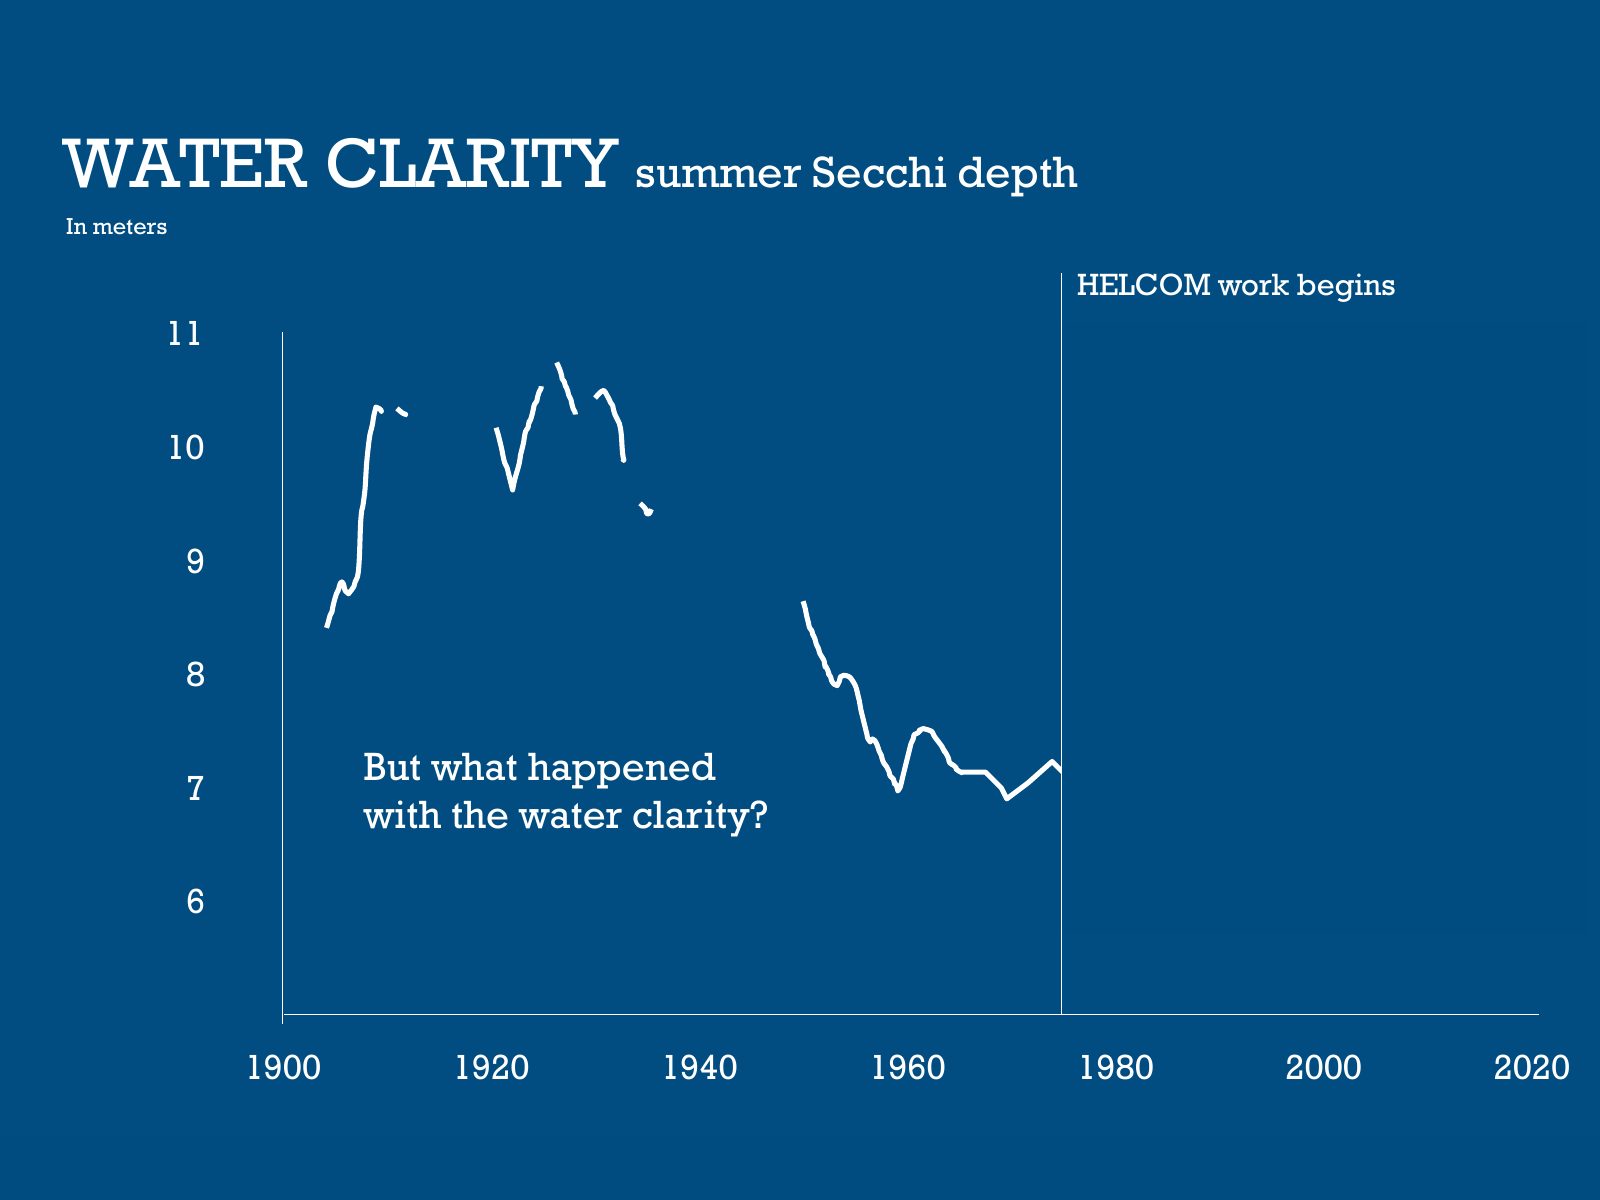
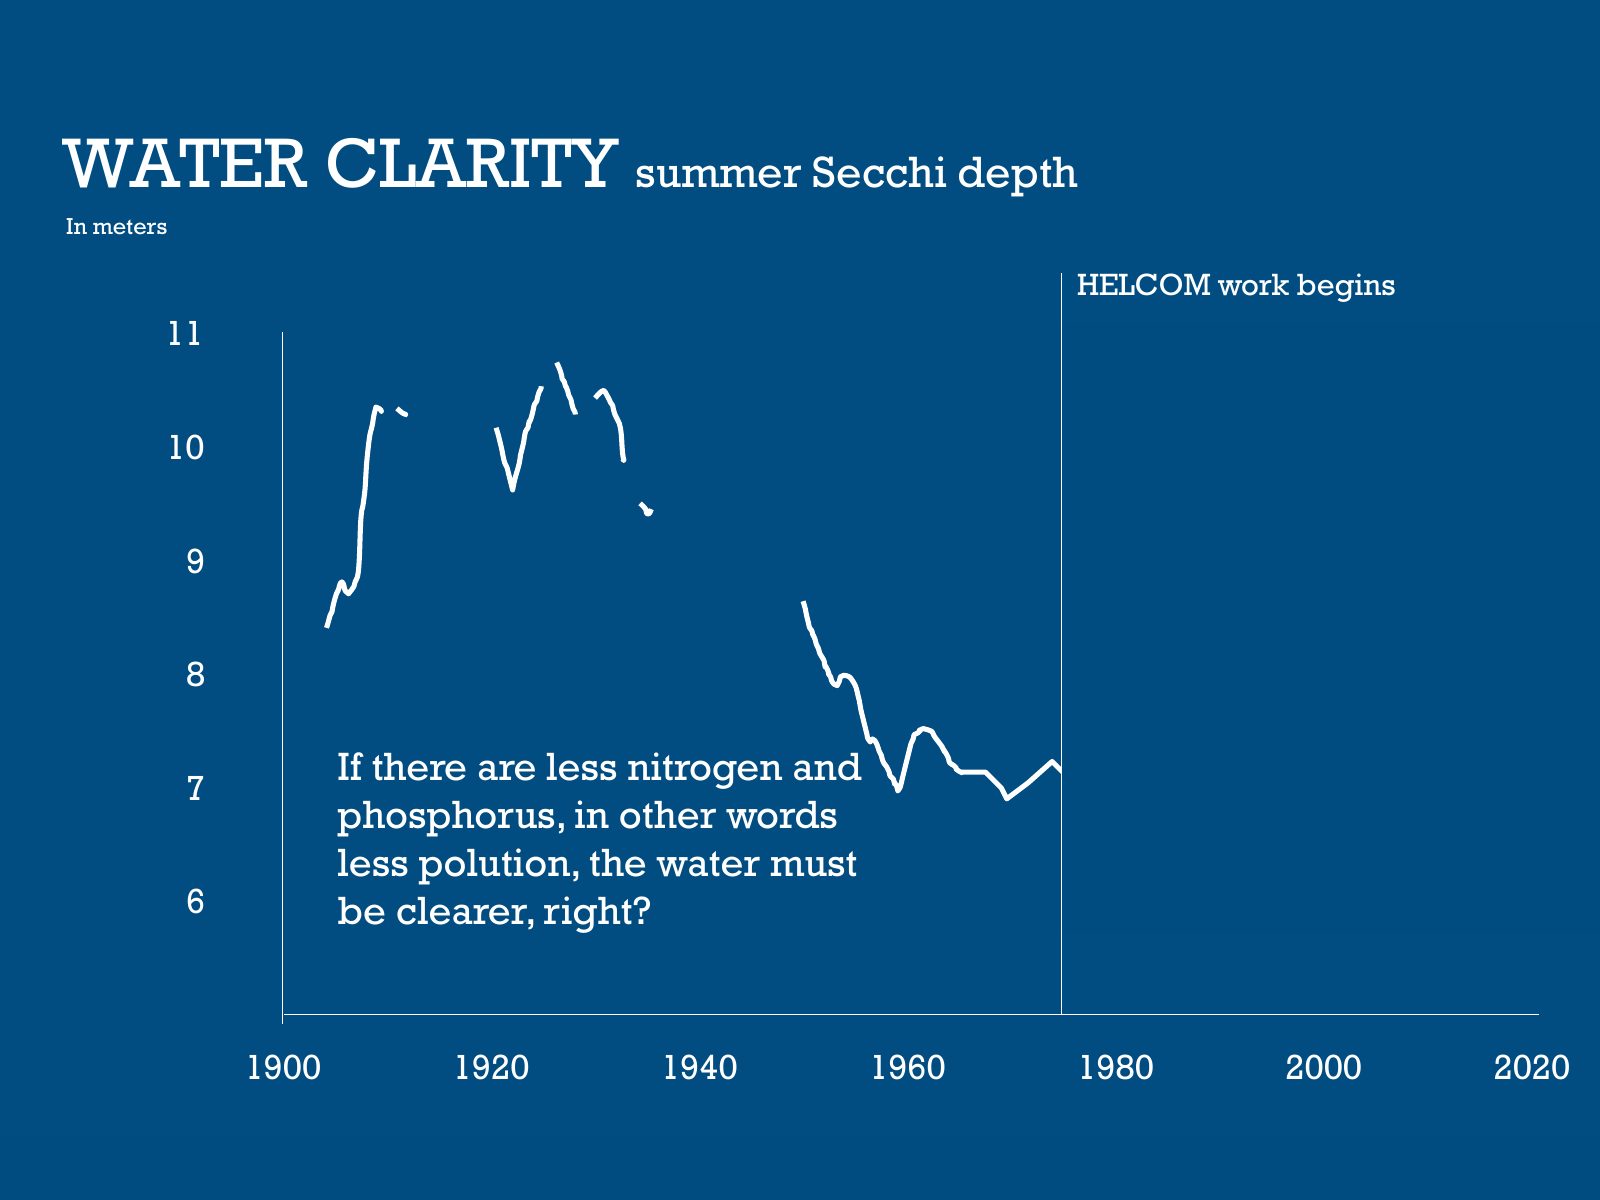
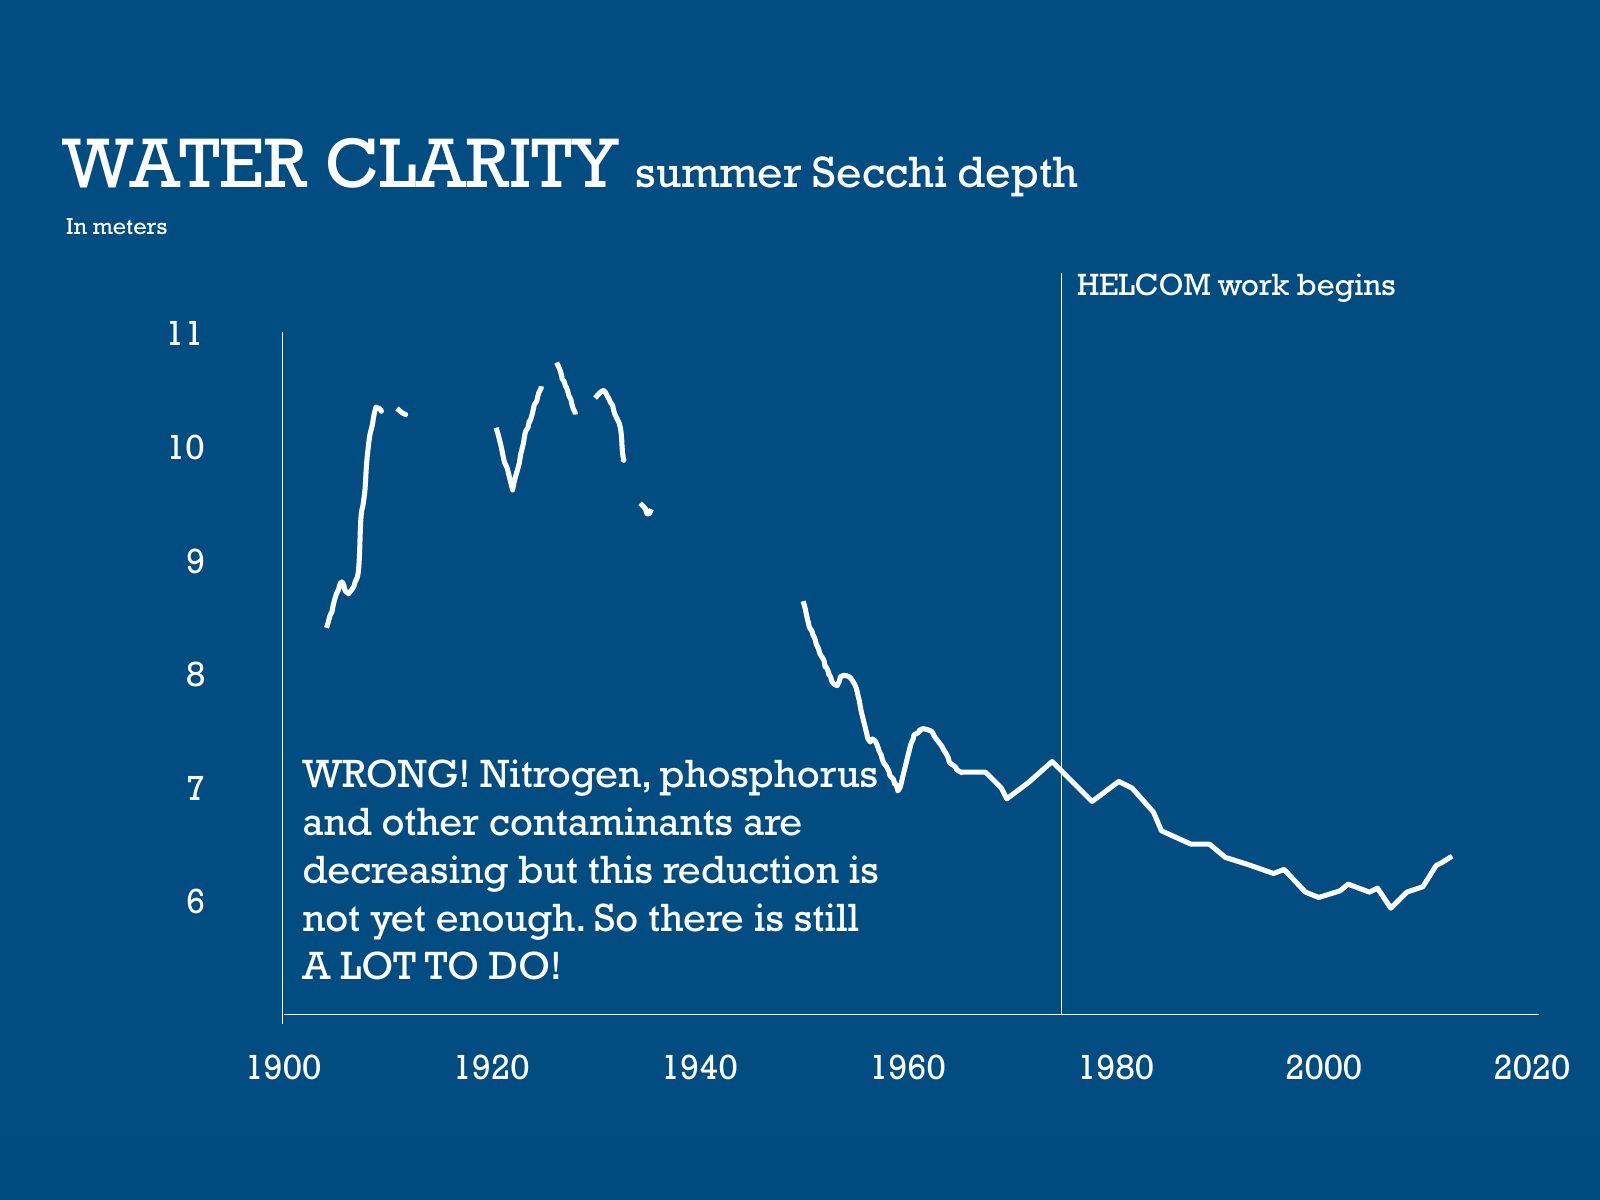
Slide 27 of 95: WATER CLARITY summer Secchi depth In meters 11 In the beginning of the century the water was clear 10 9 8 But the population increased dramatically 7 from th…
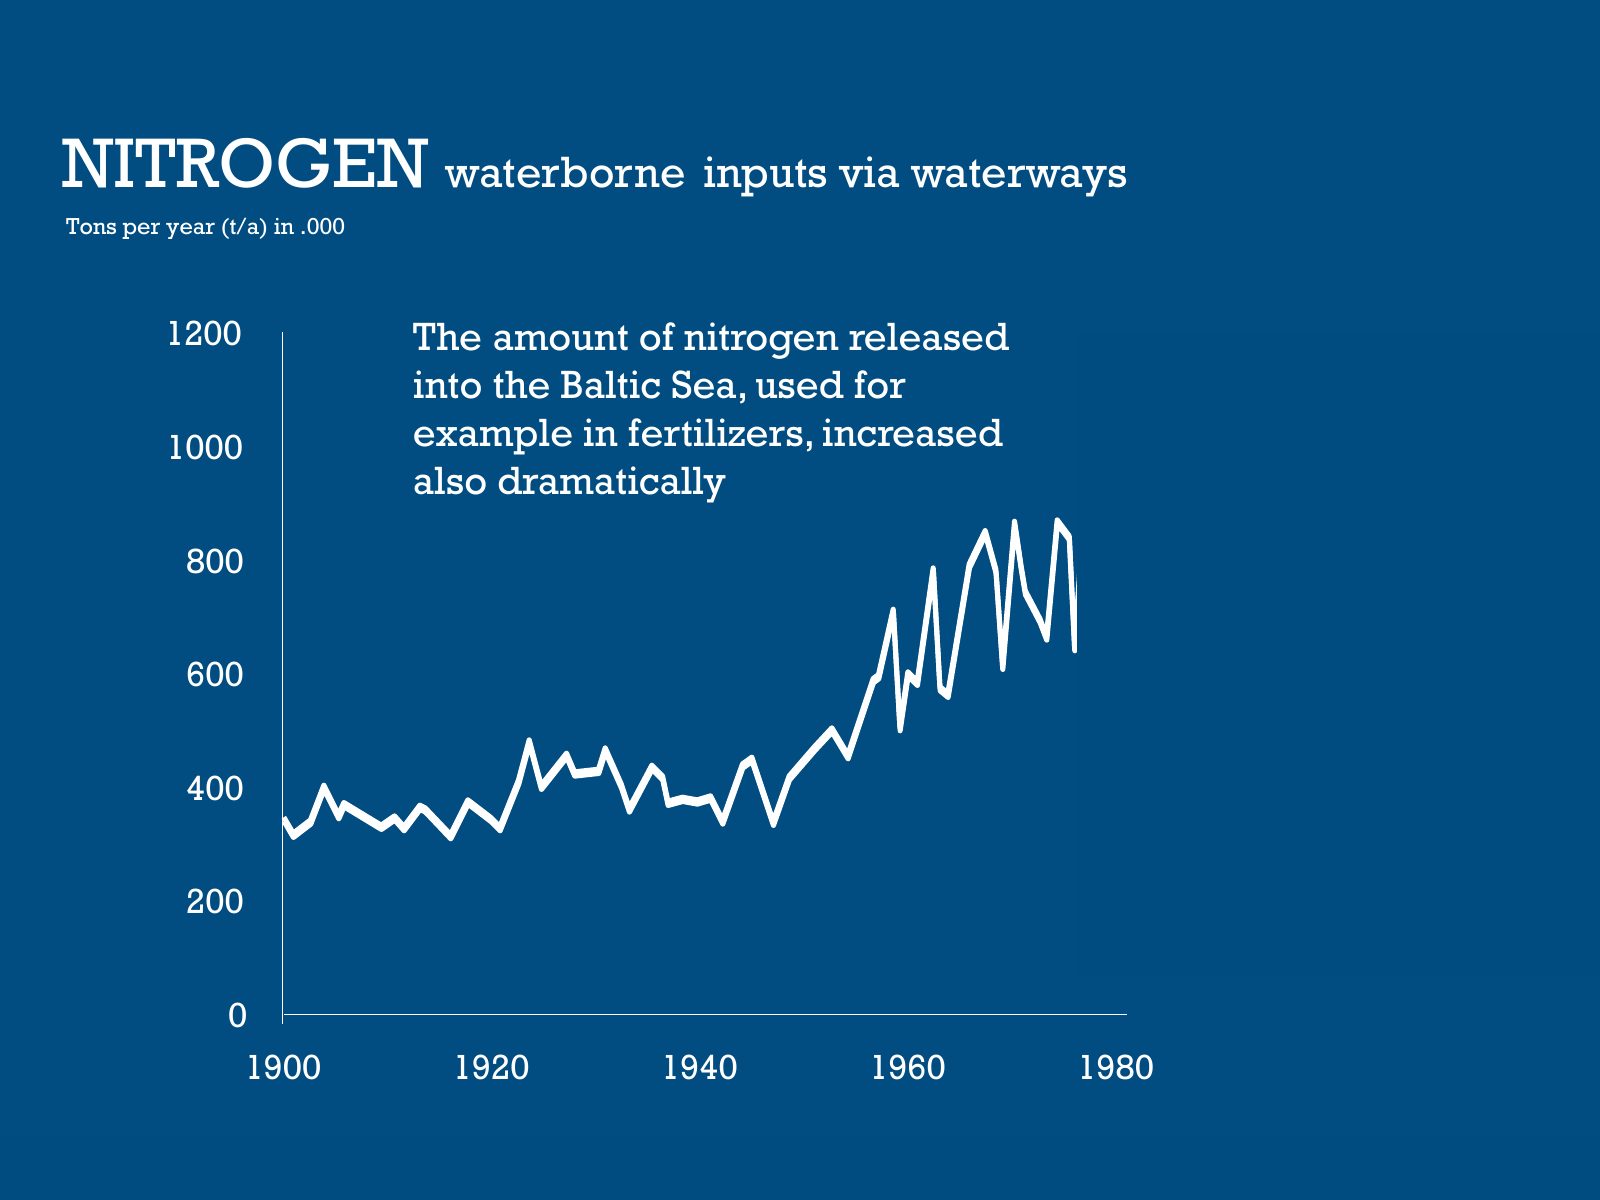
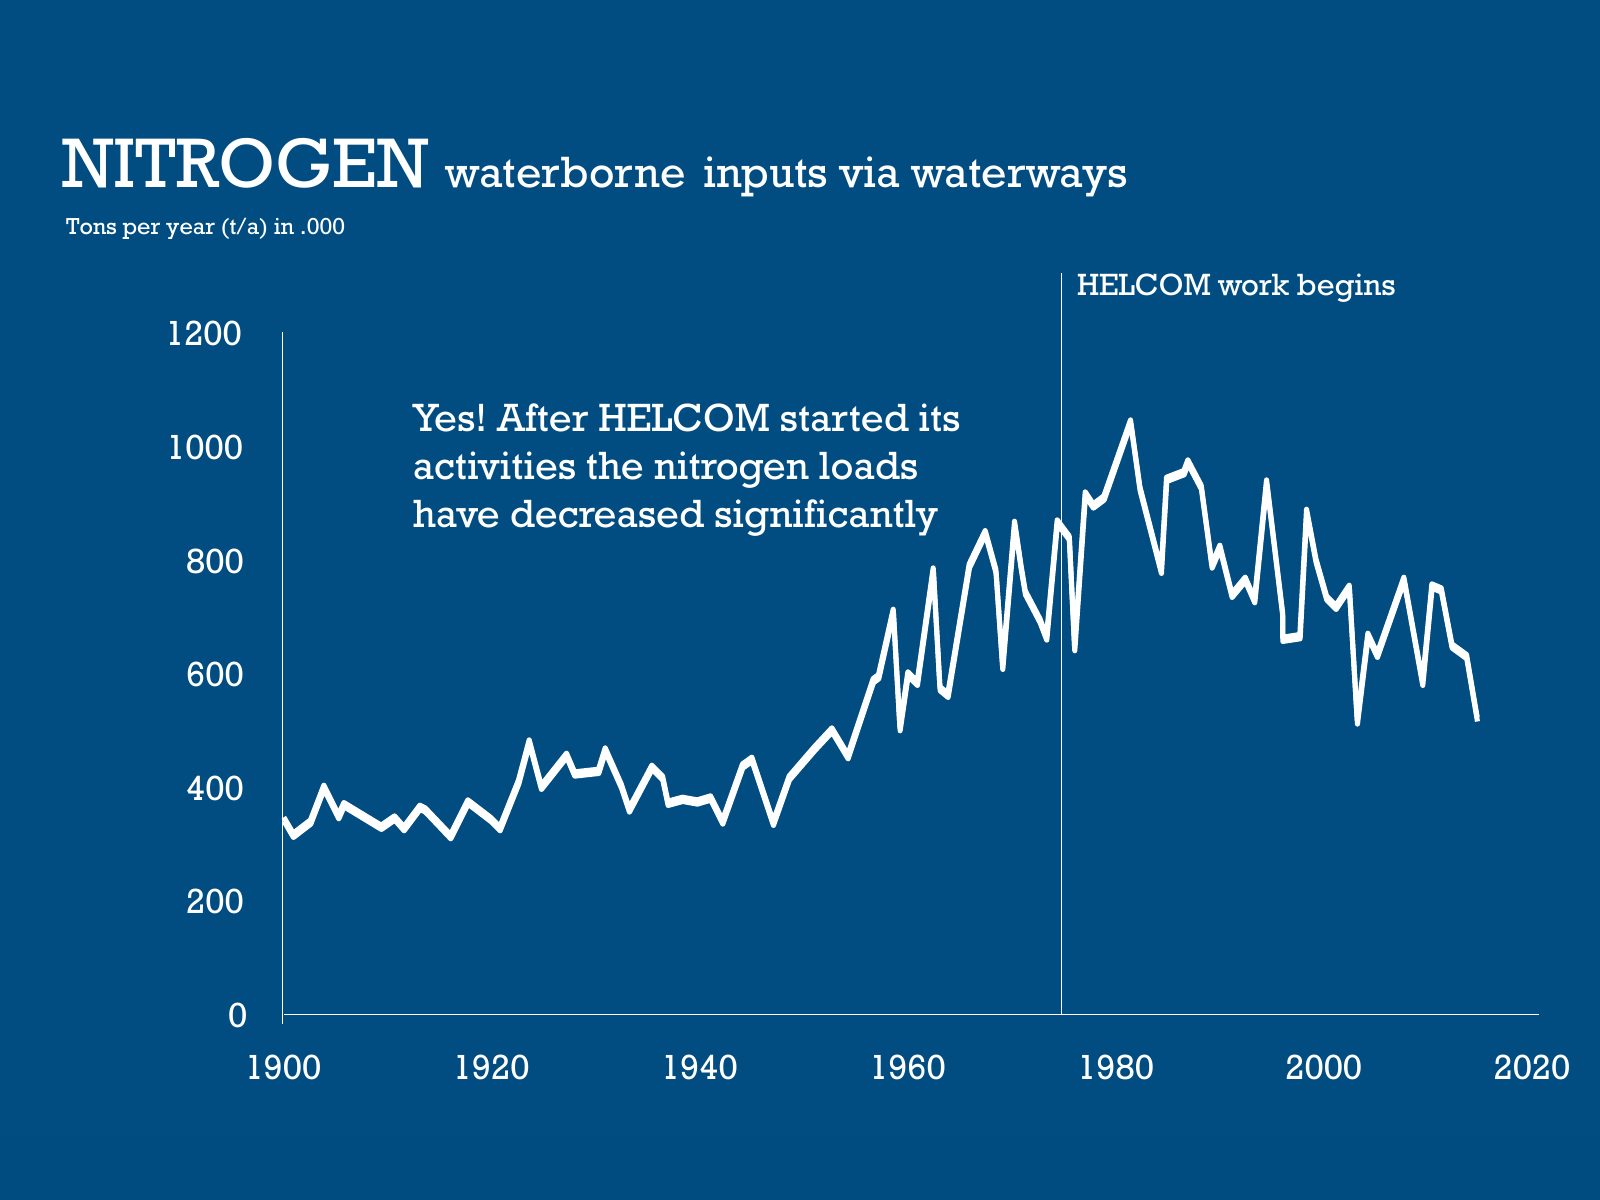
Slide 28 of 95: NITROGEN waterborne inputs via waterways Tons per year (t/a) in .000 1200 The amount of nitrogen released into the Baltic Sea, used for 1000 example in ferti…
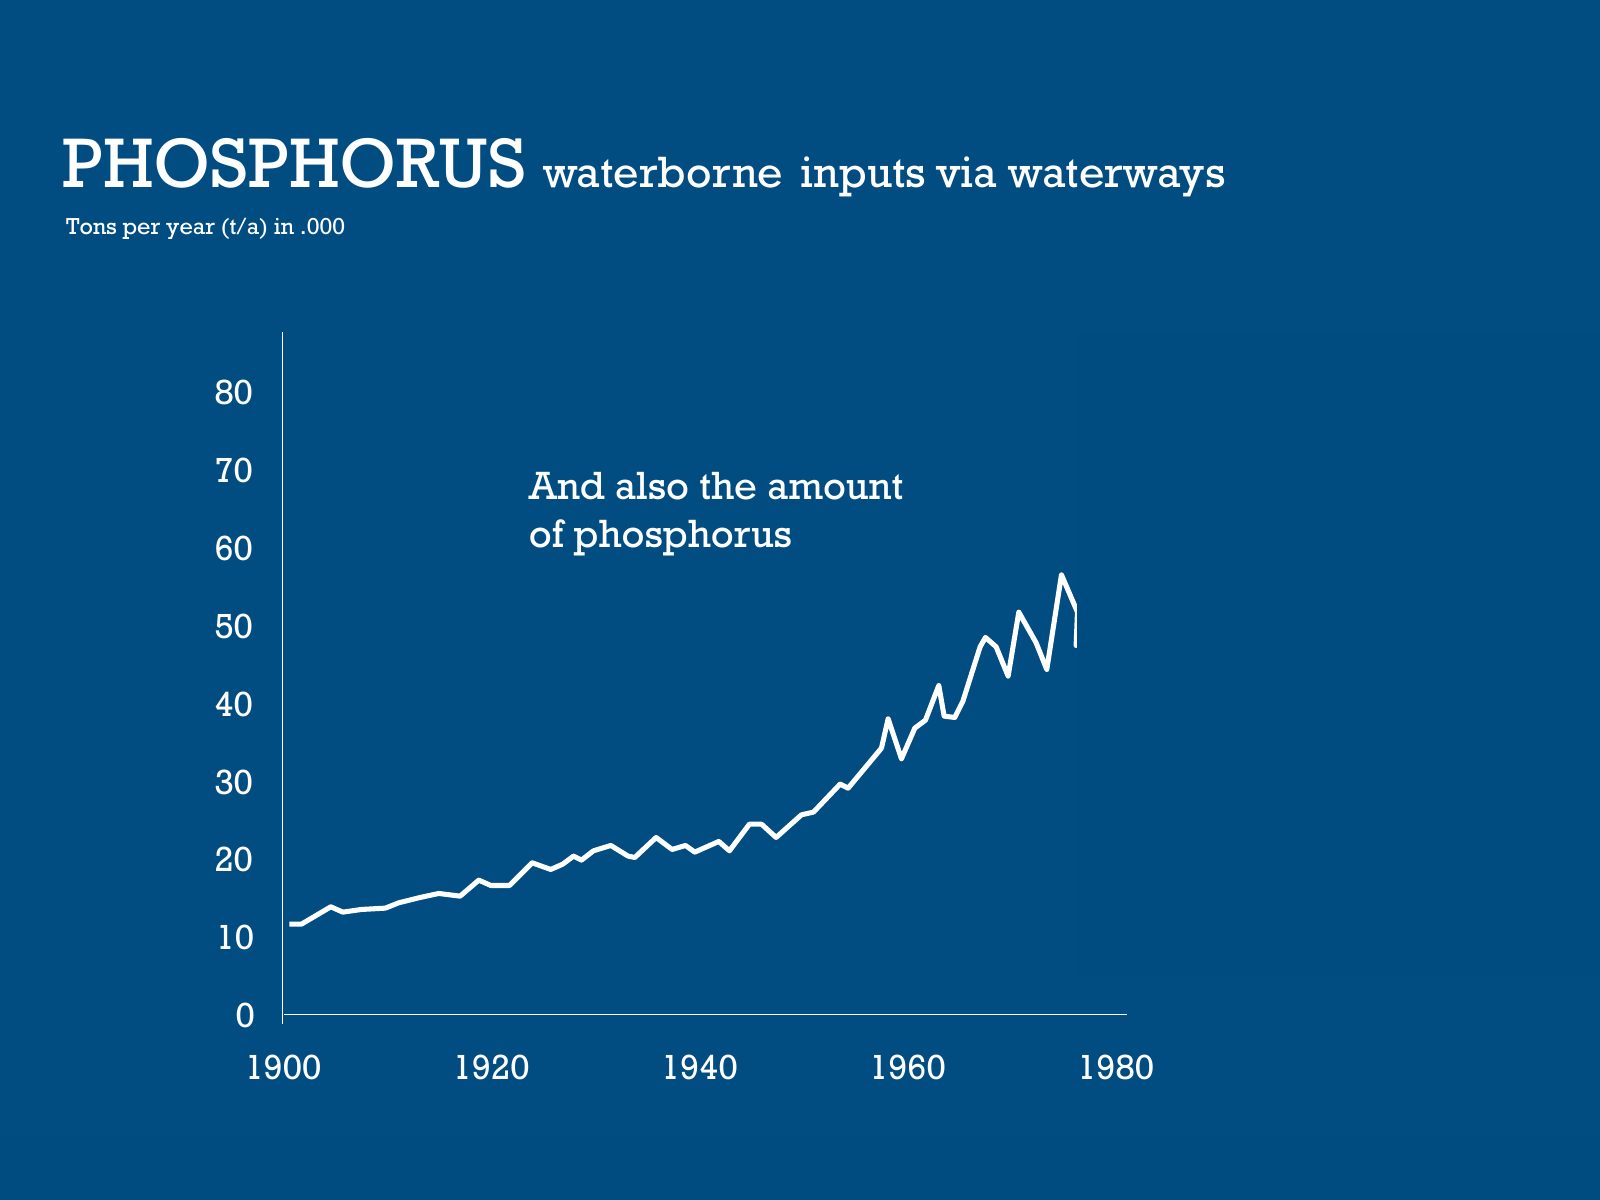
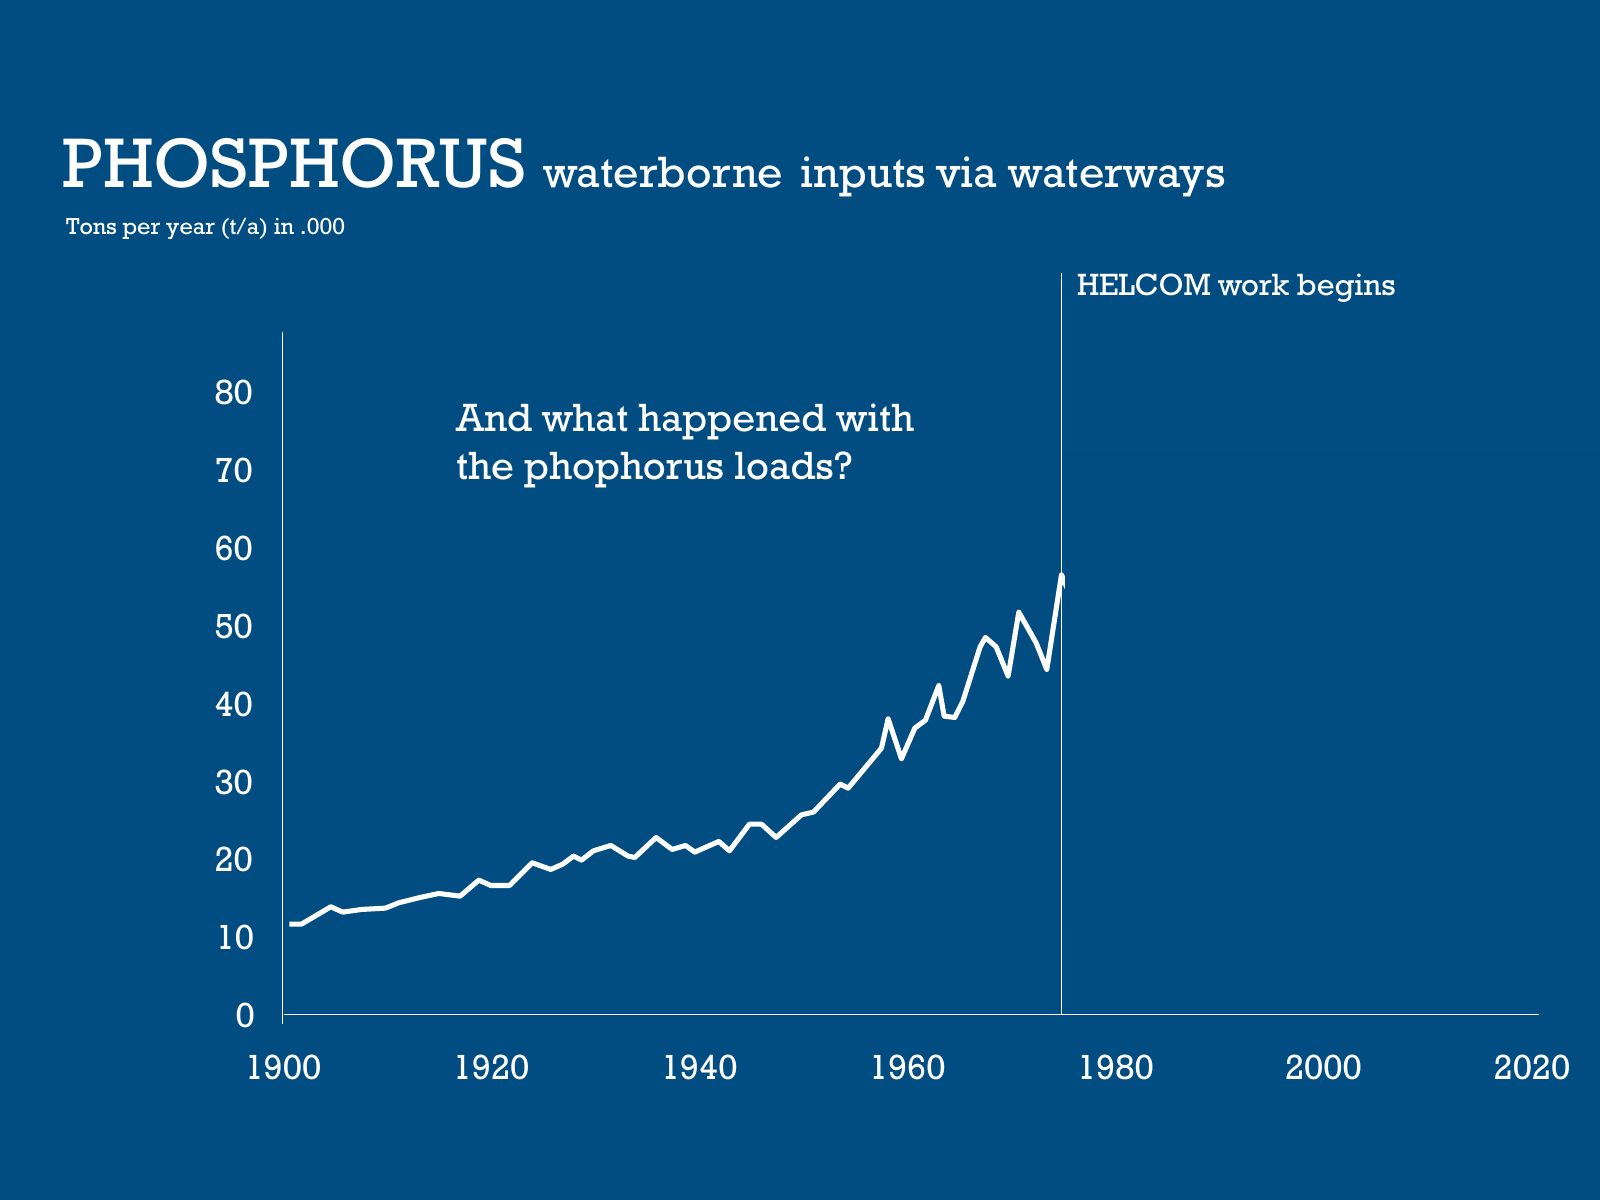
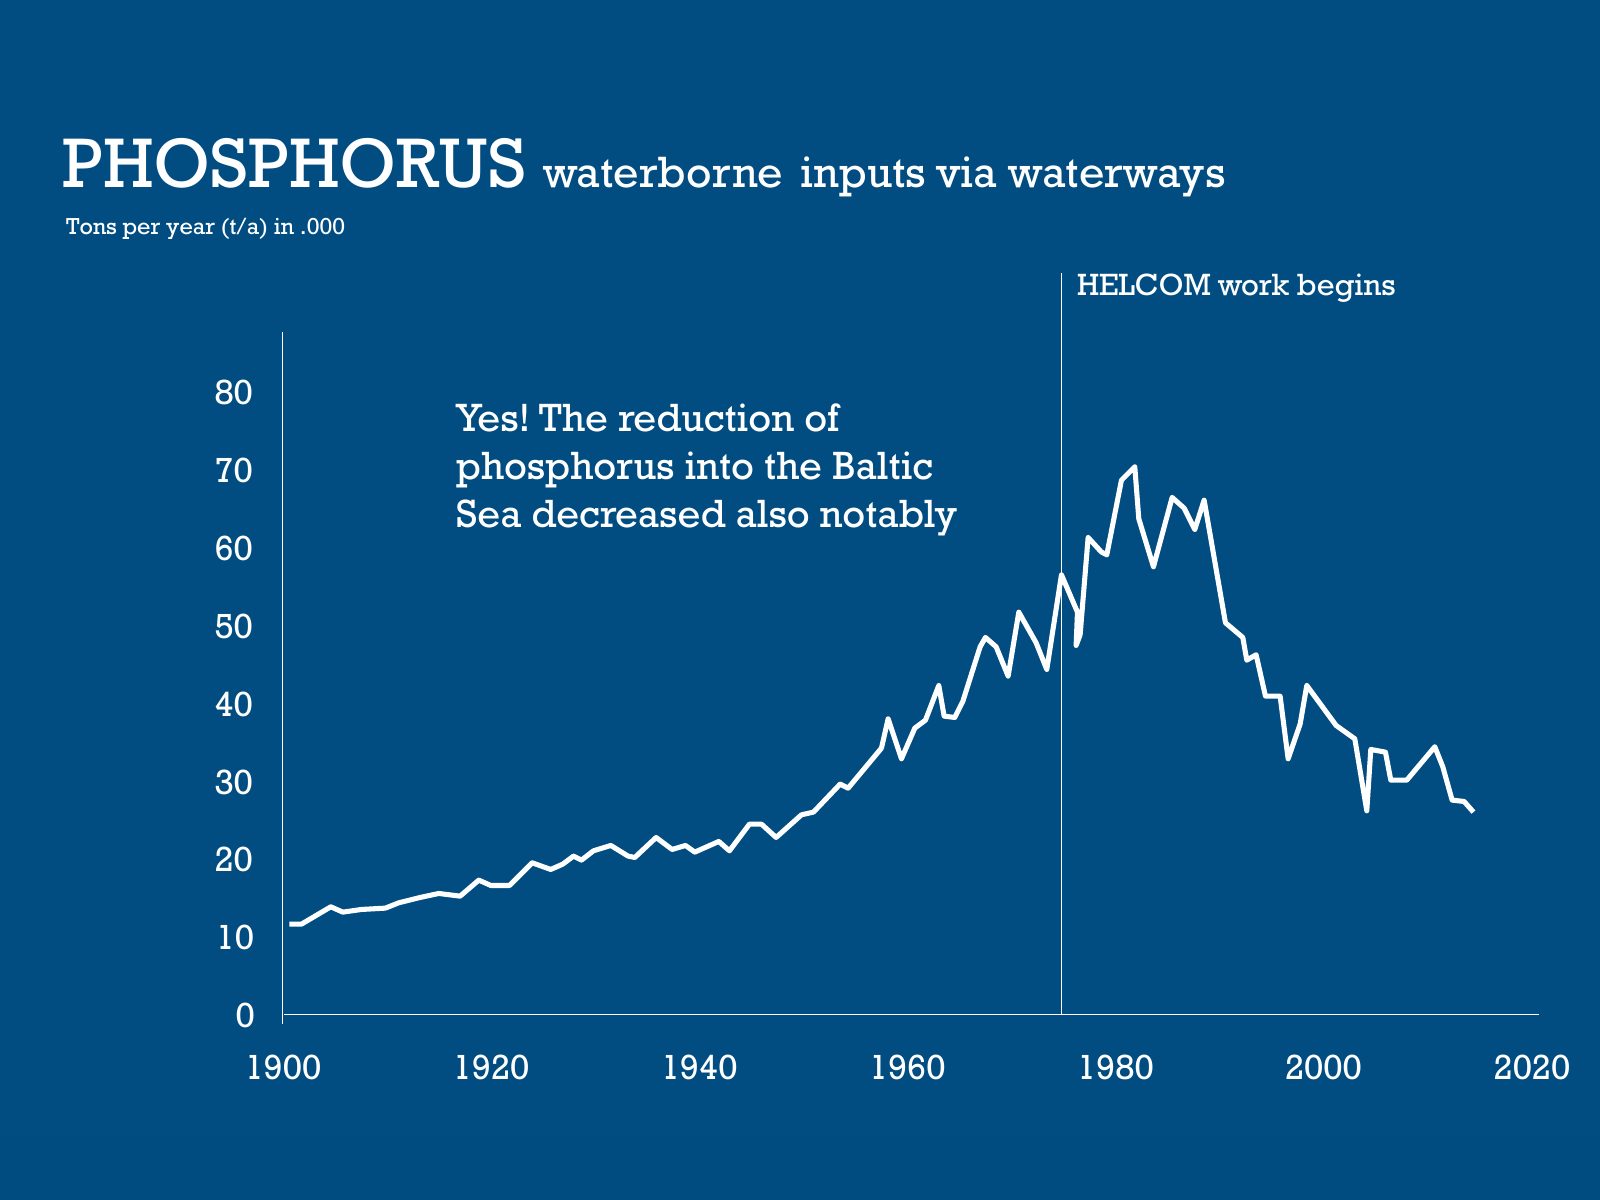
Slide 29 of 95: PHOSPHORUS waterborne inputs via waterways Tons per year (t/a) in .000 80 70 And also the amount 60 of phosphorus 50 40 30 20 10 0 1900 1920 1940 1960 1980
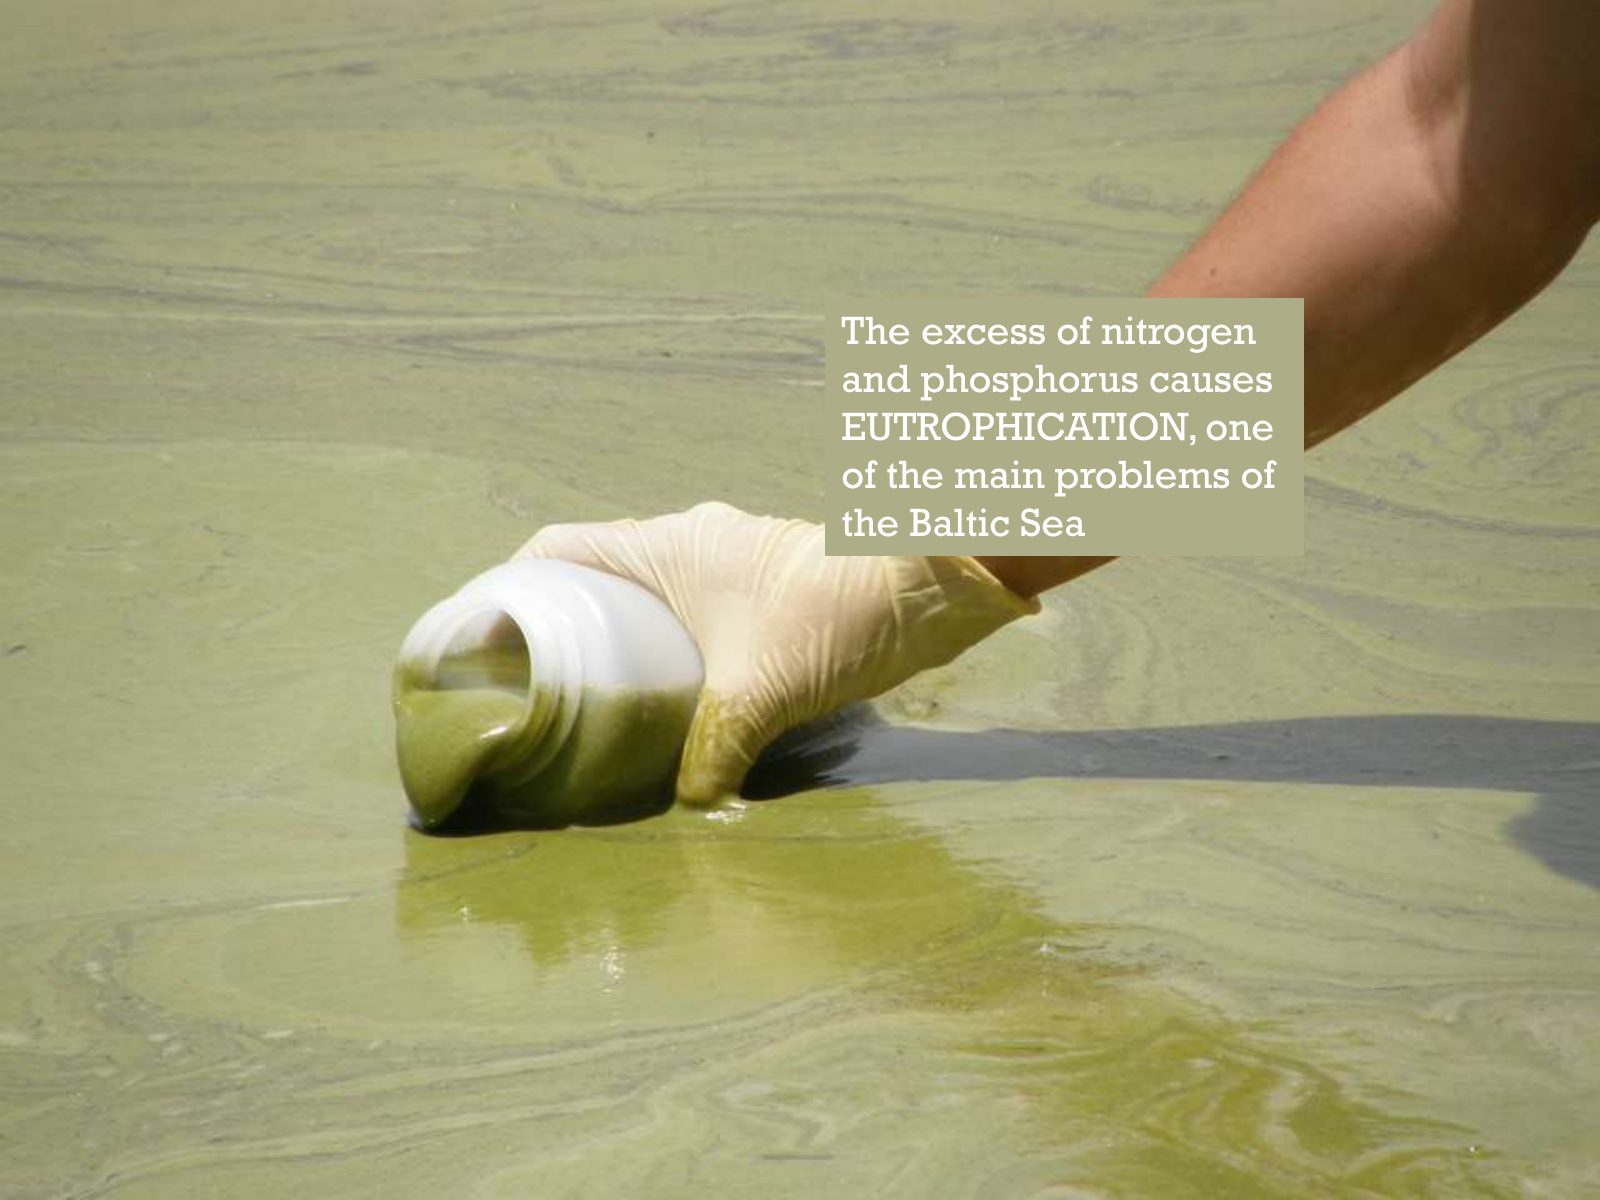
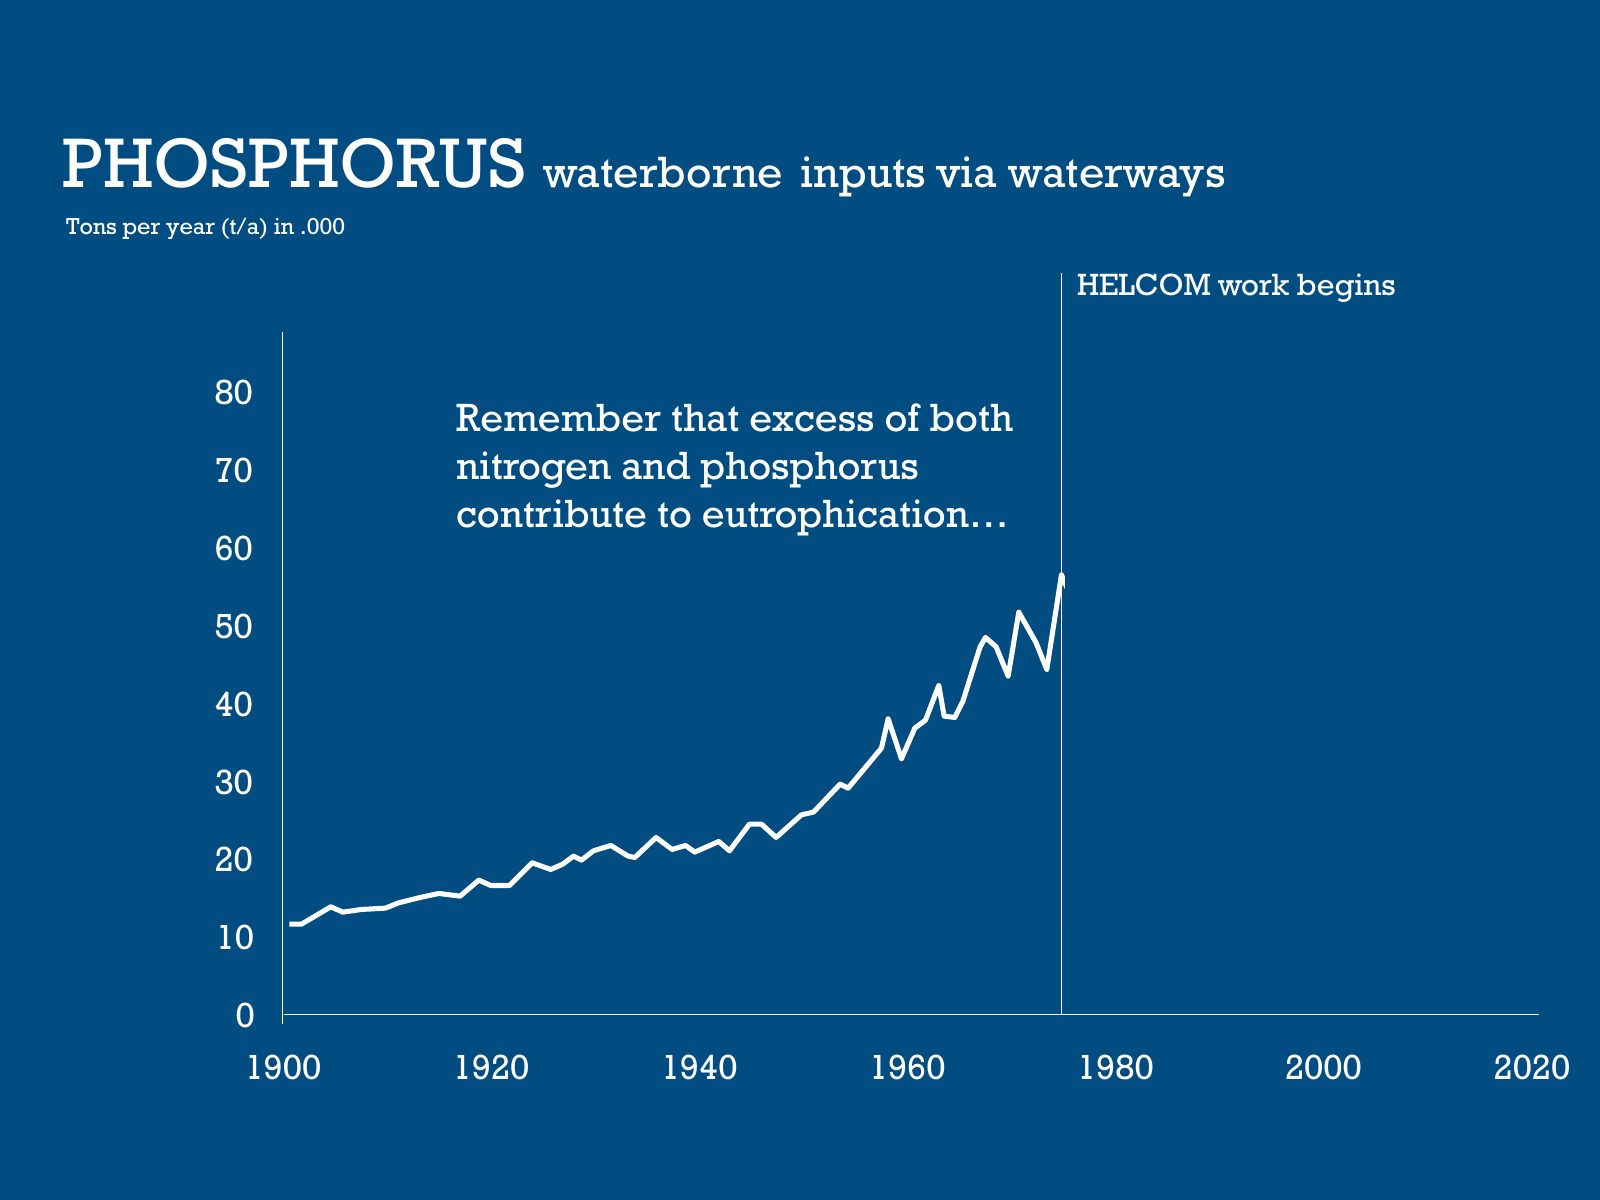
Slide 30 of 95: The excess of nitrogen and phosphorus causes EUTROPHICATION, one of the main problems of the Baltic Sea
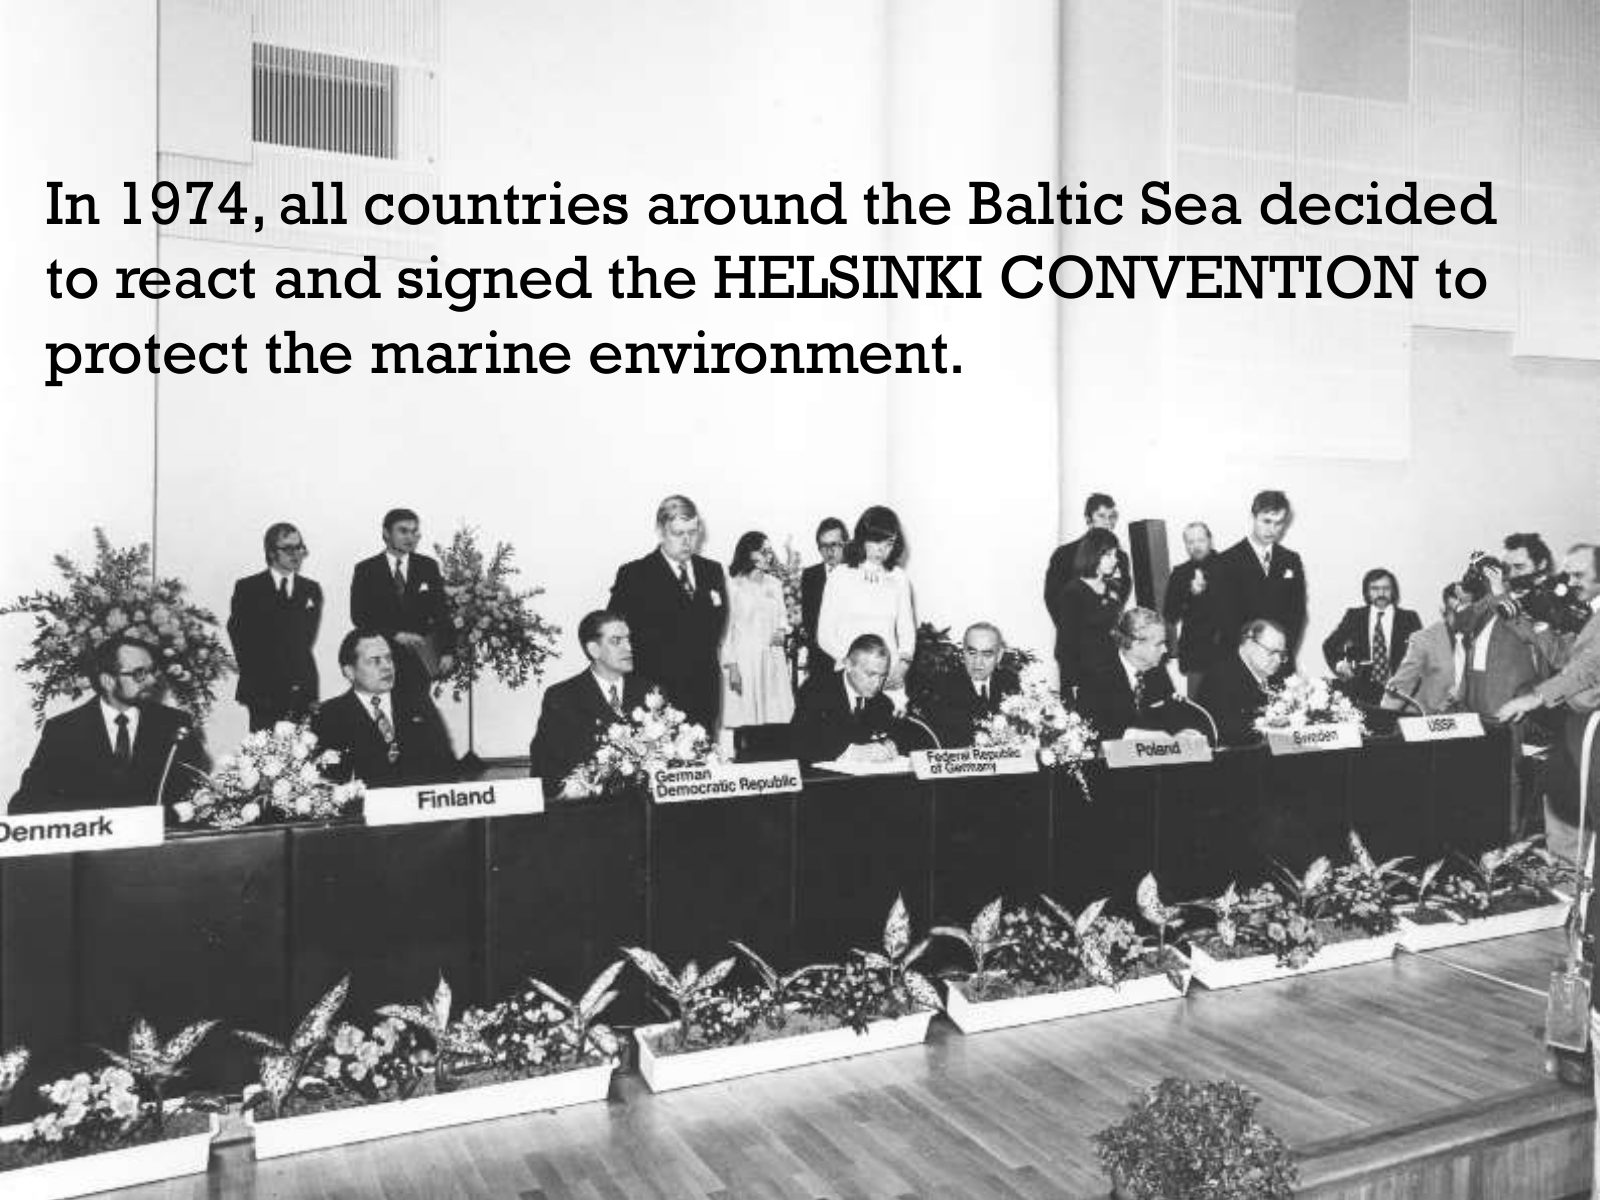
Slide 31 of 95: In 1974, all countries around the Baltic Sea decided to react and signed the HELSINKI CONVENTION to protect the marine environment.
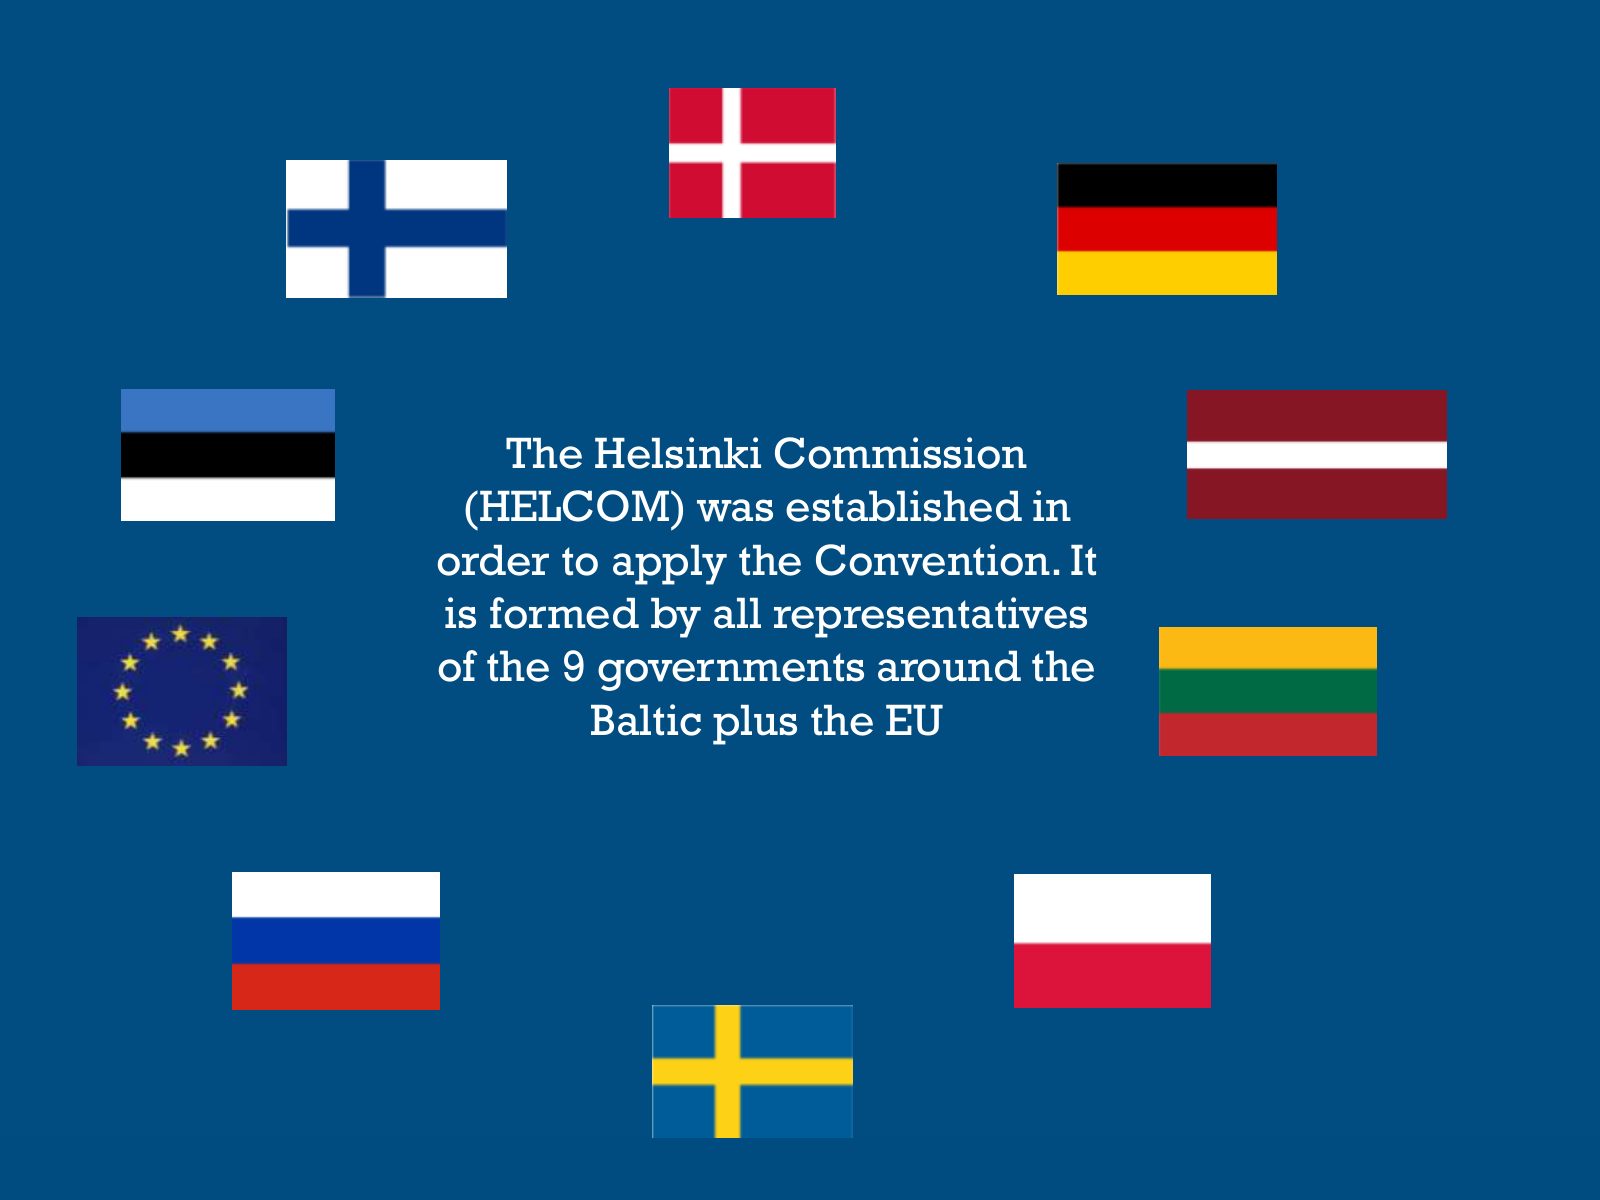
Slide 32 of 95: The Helsinki Commission (HELCOM) was established in order to apply the Convention. It is formed by all representatives of the 9 governments around the Baltic…
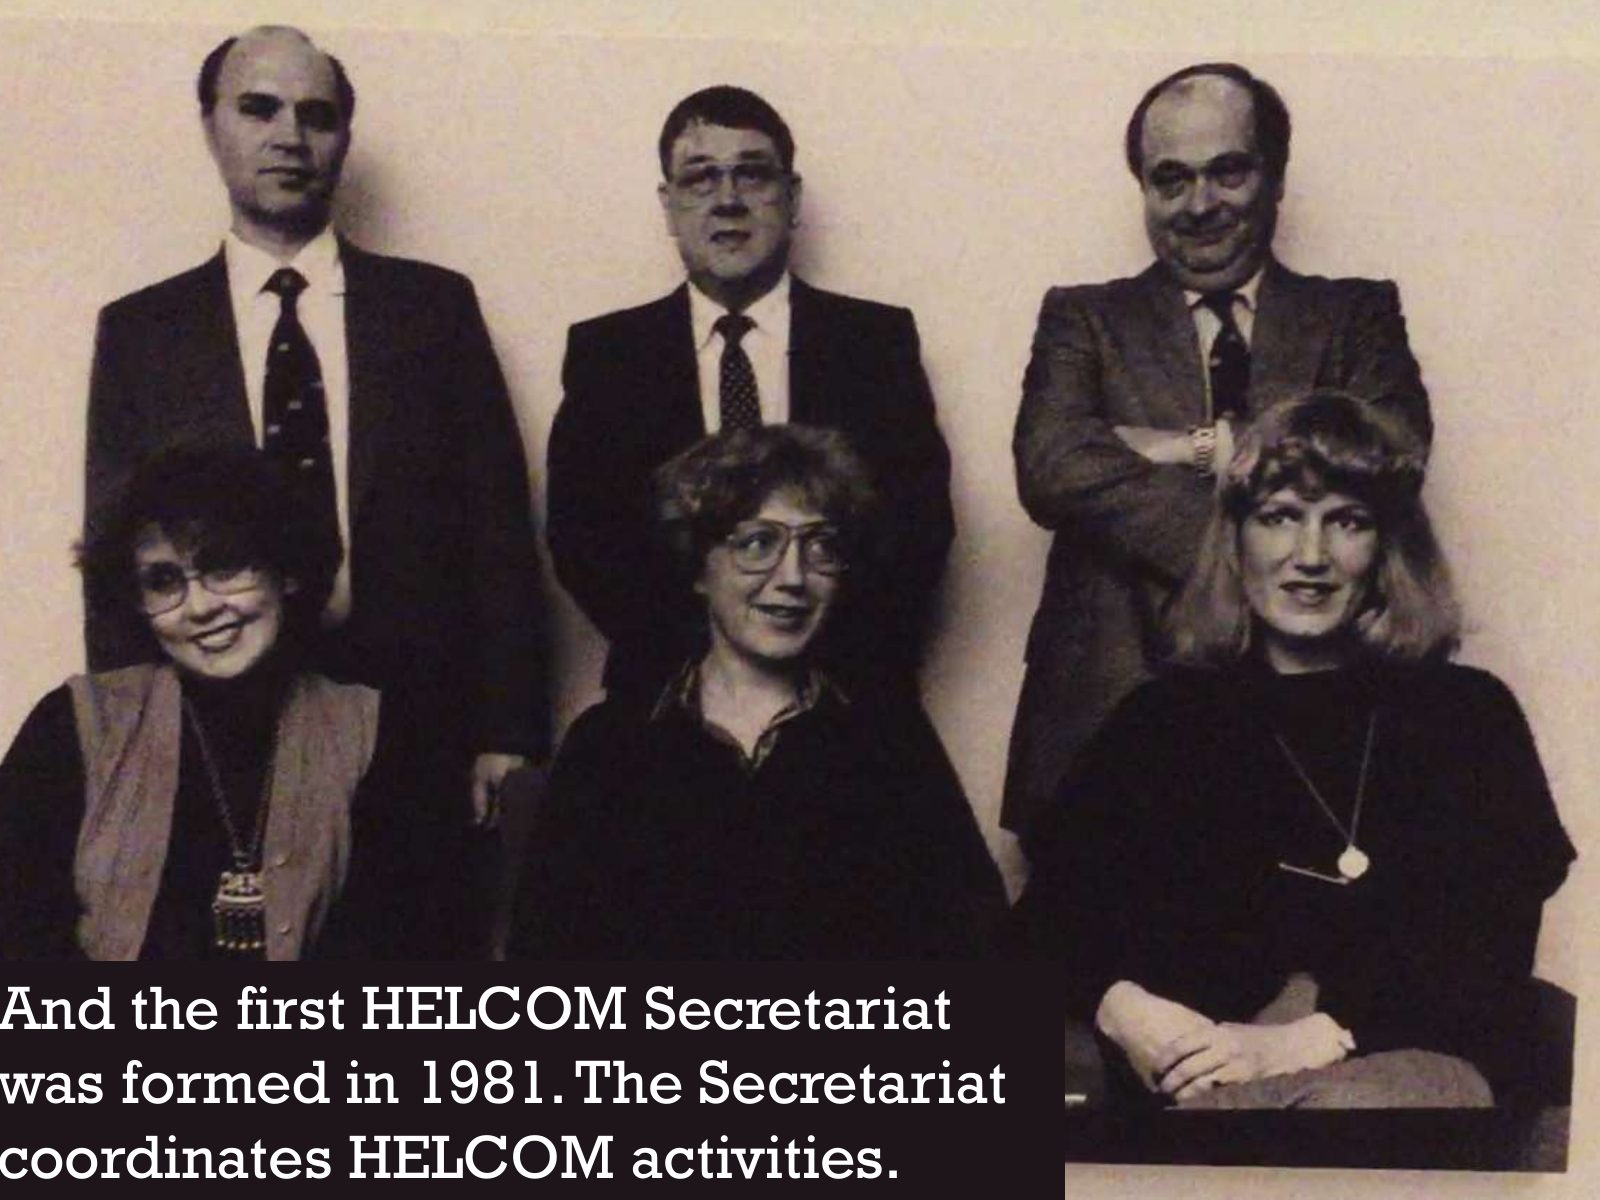
Slide 33 of 95: And the first HELCOM Secretariat was formed in 1981. The Secretariat coordinates HELCOM activities.
Slide 34 of 95: An important task of the Secretariat is to host and manage data
Slide 35 of 95: HELCOM has moved from hand-drawn maps to cutting-edge mapping technology
Slide 36 of 95: We played Indiana Jones and dived into our archives
Slide 37 of 95: GIS in HELCOM From hand-drawn maps to ESRI
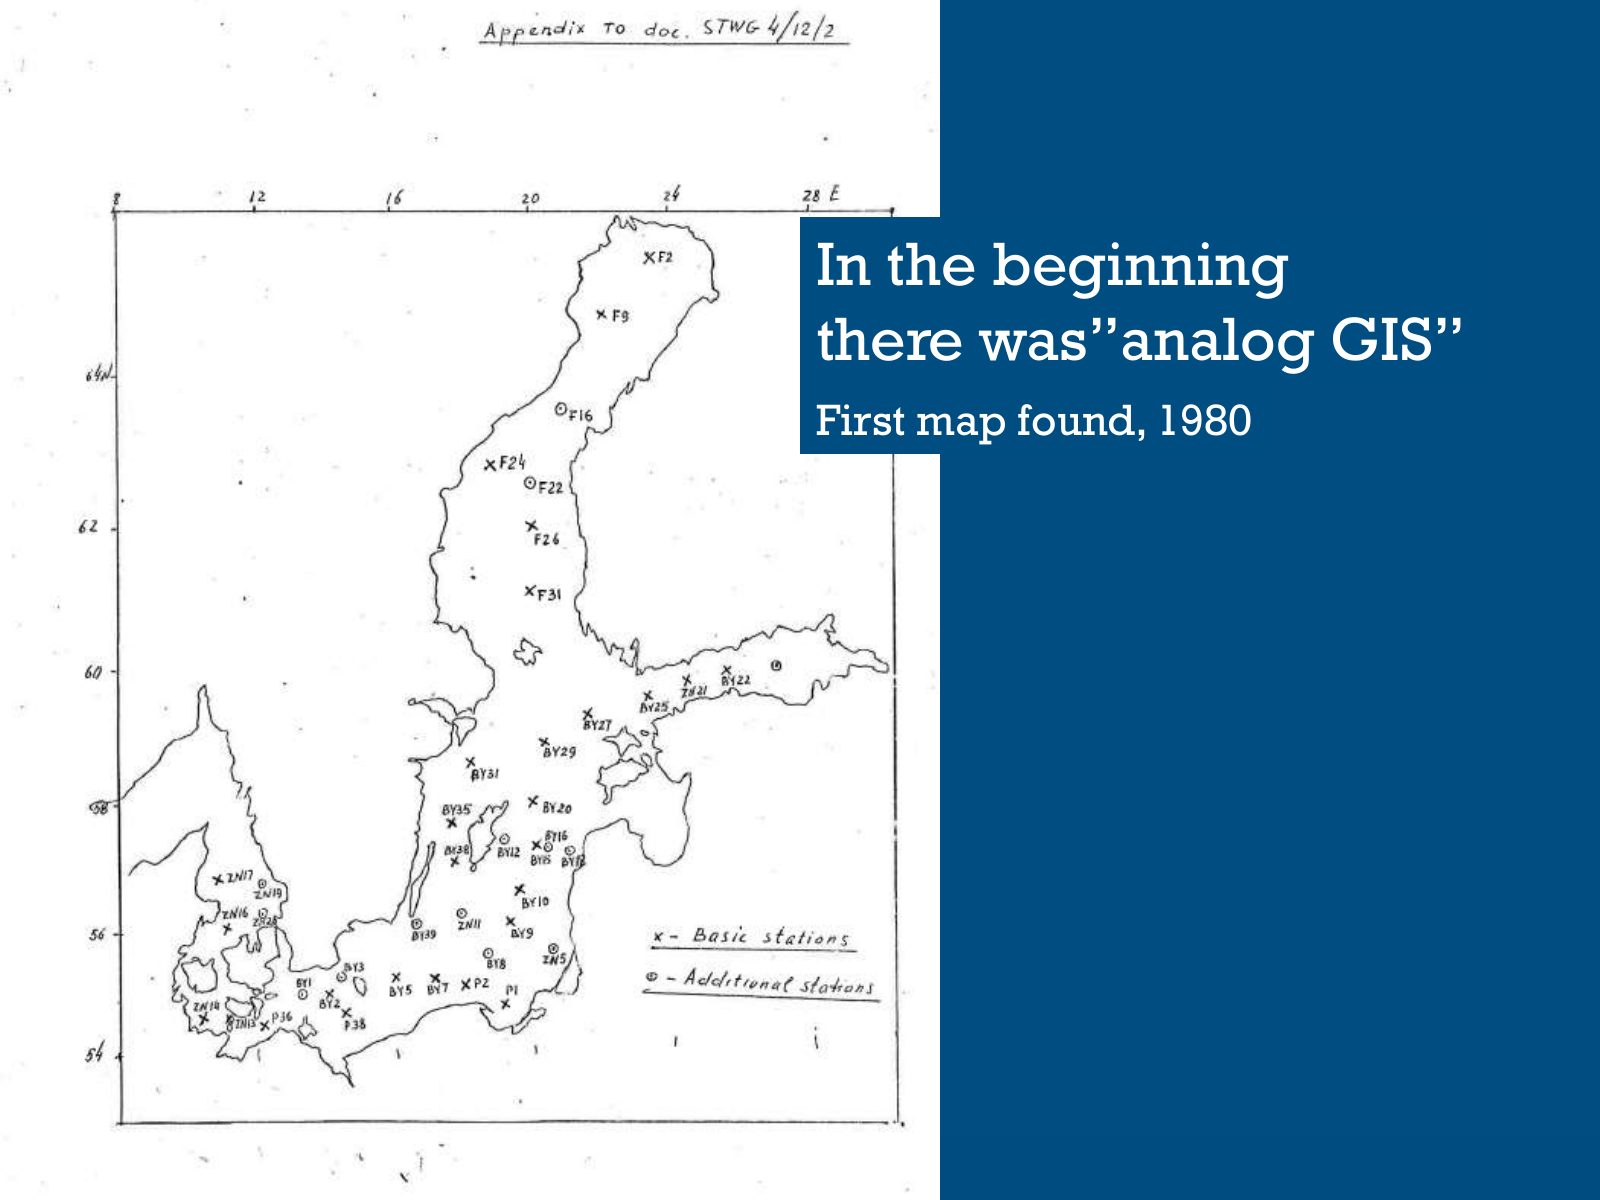
Slide 38 of 95: In the beginning there was”analog GIS” First map found, 1980
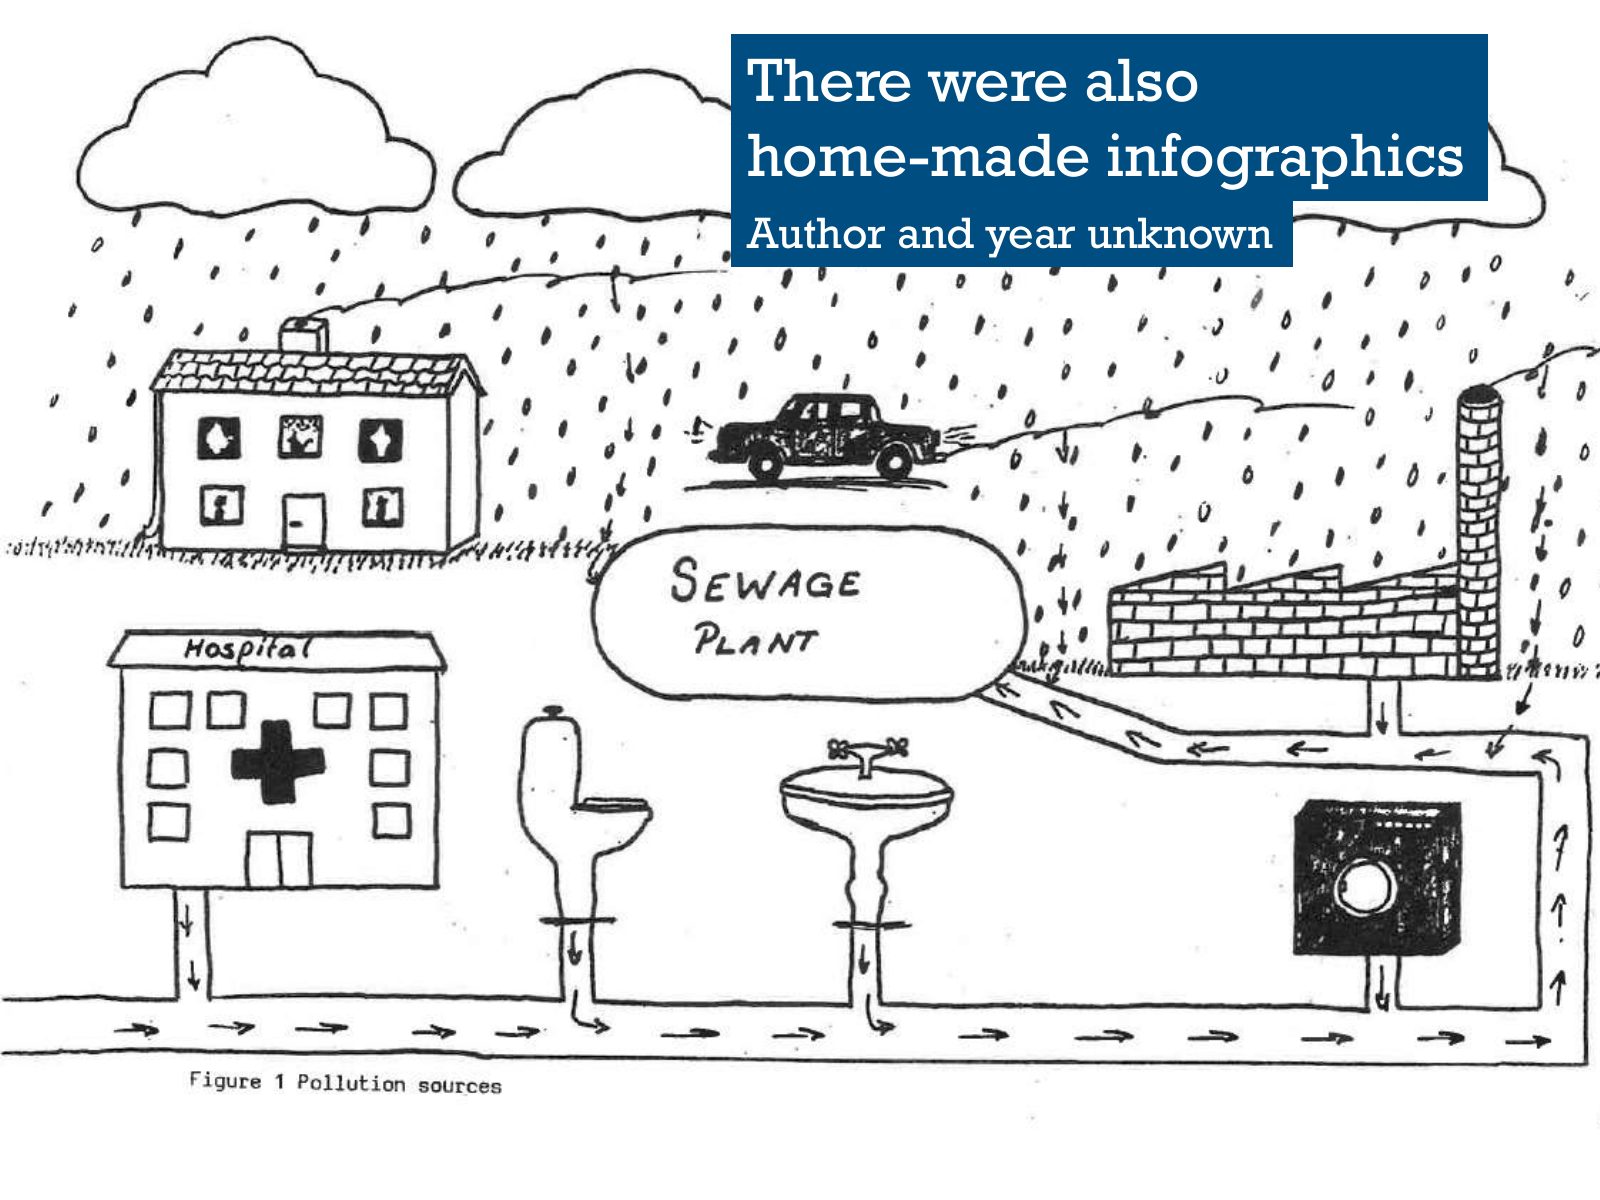
Slide 39 of 95: There were also home-made infographics Author and year unknown
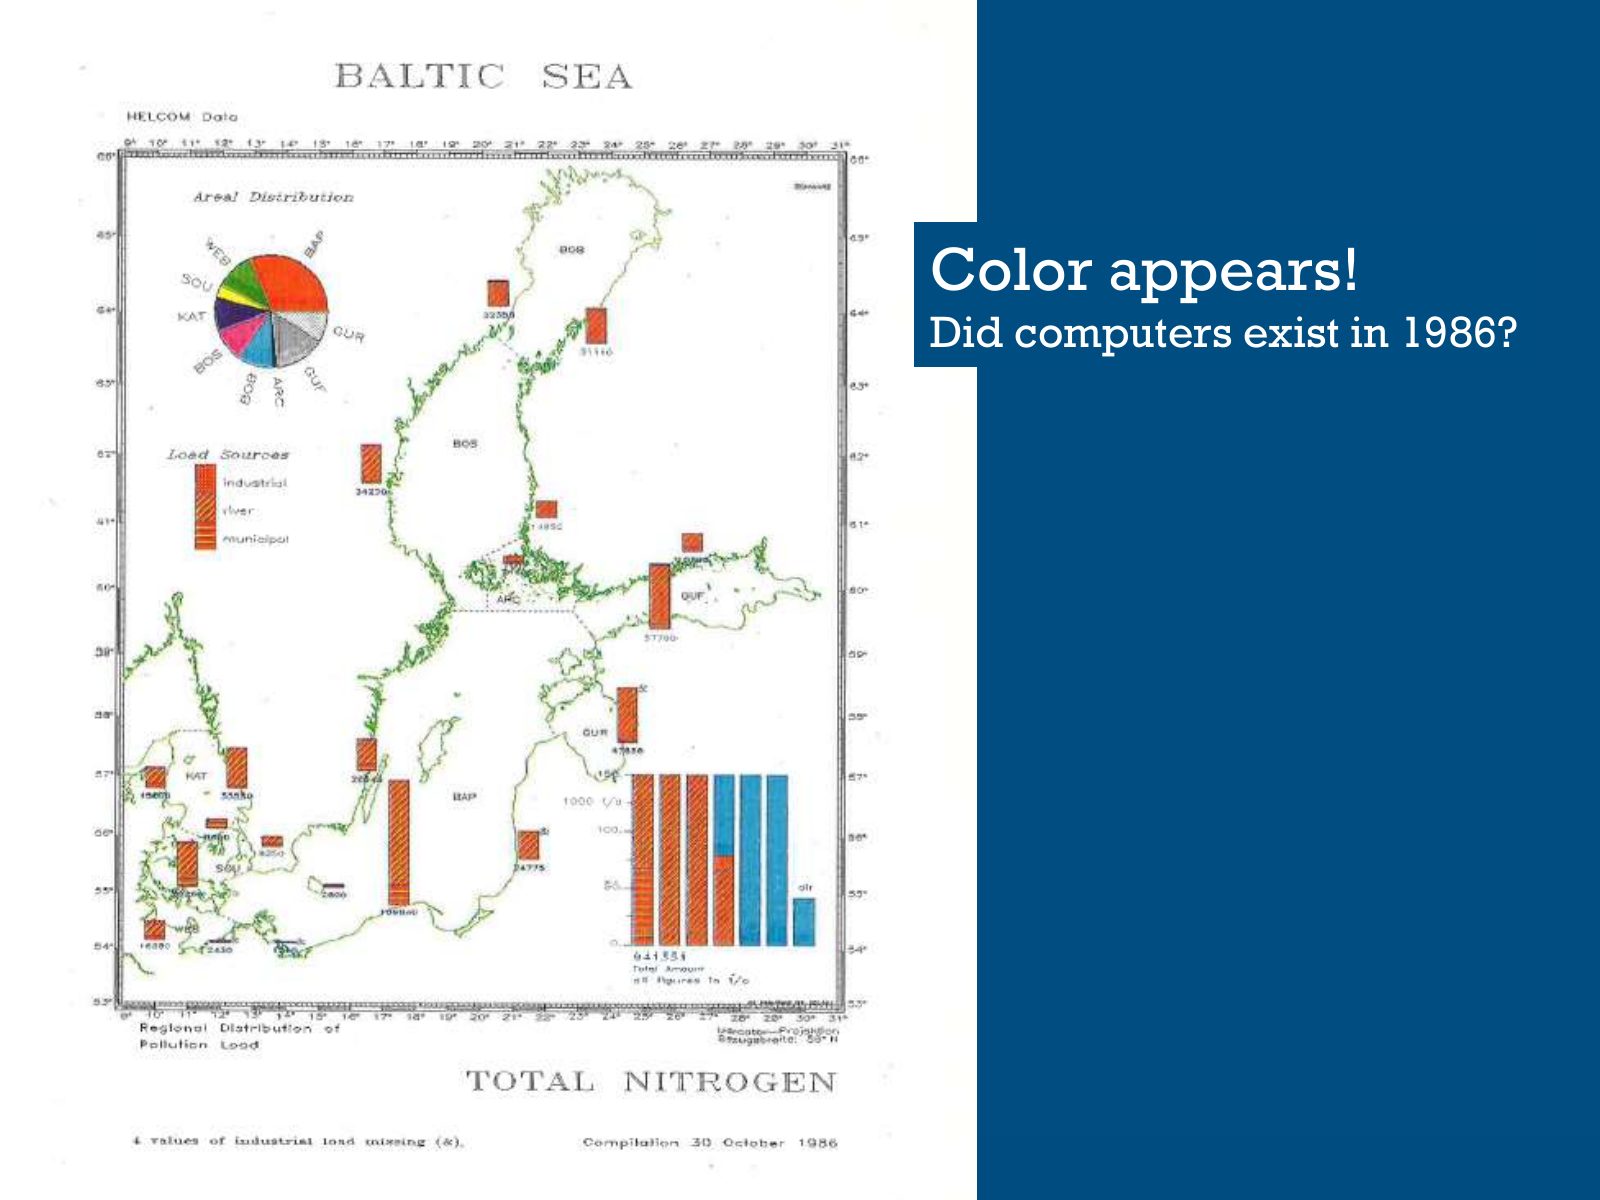
Slide 40 of 95: Color appears! Did computers exist in 1986?
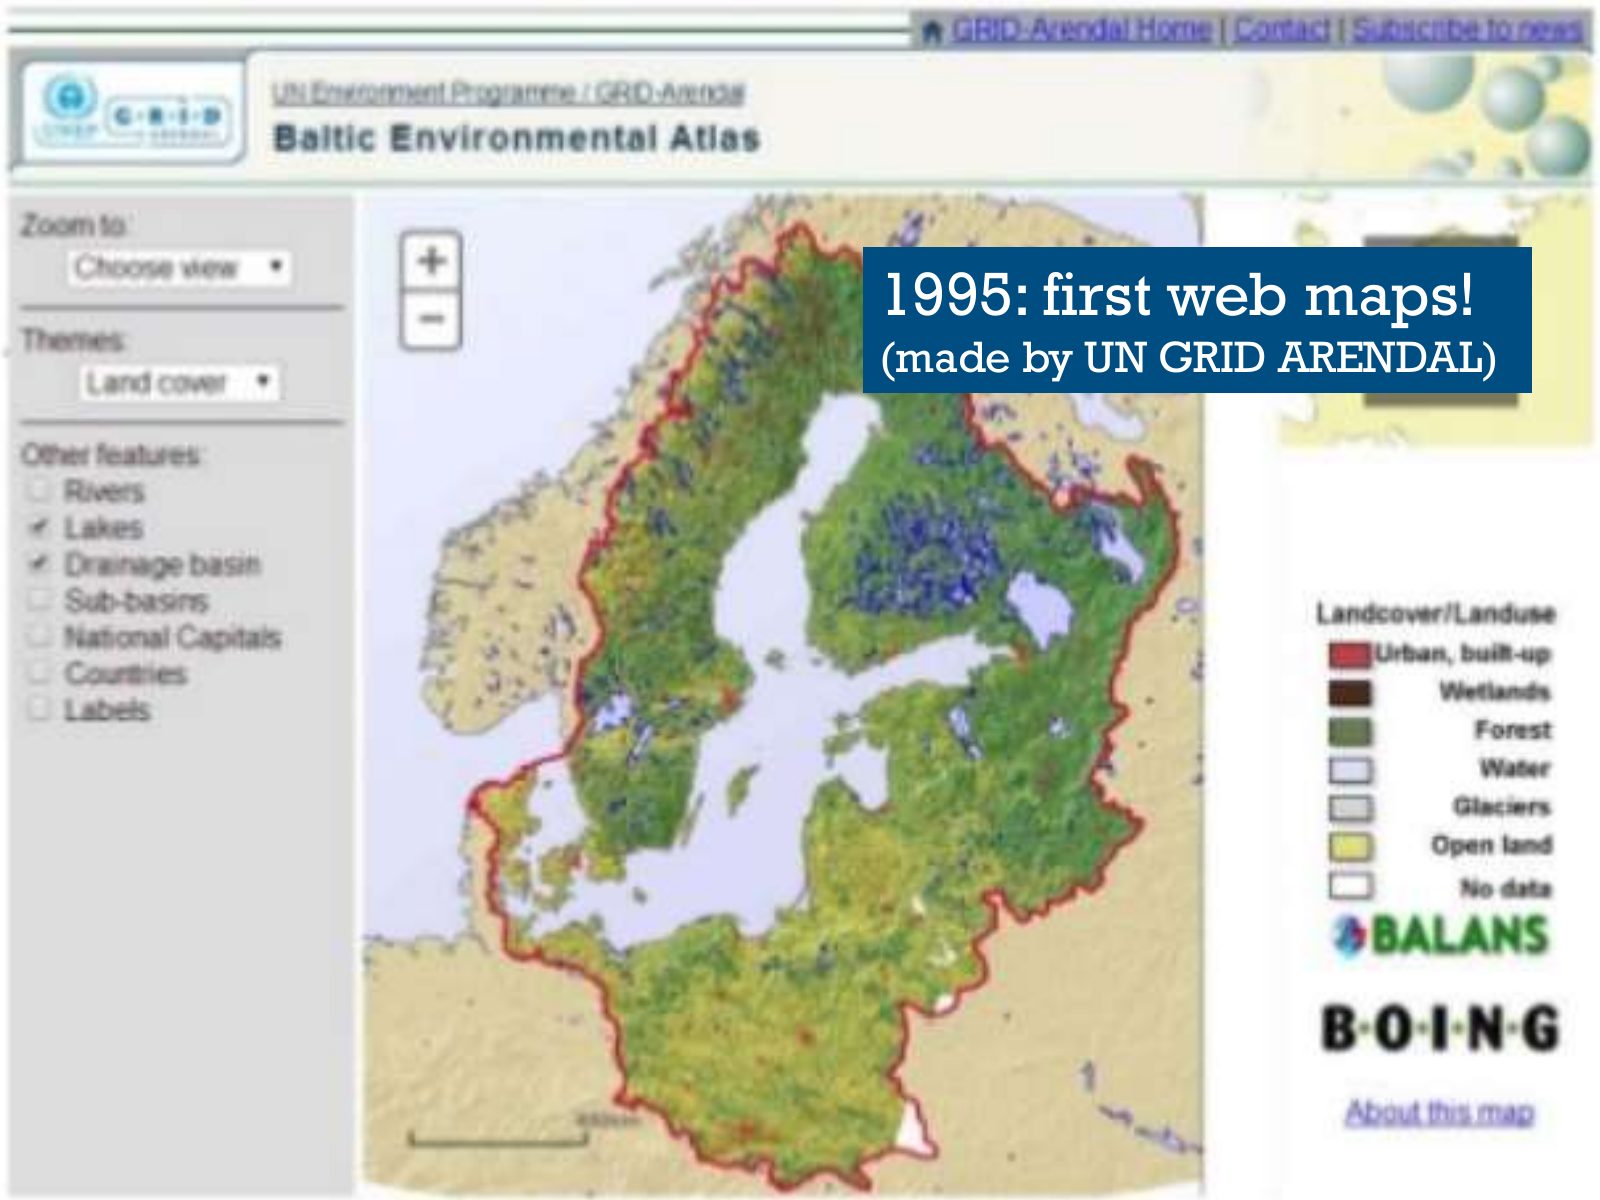
Slide 41 of 95: 1995: first web maps! (made by UN GRID ARENDAL)
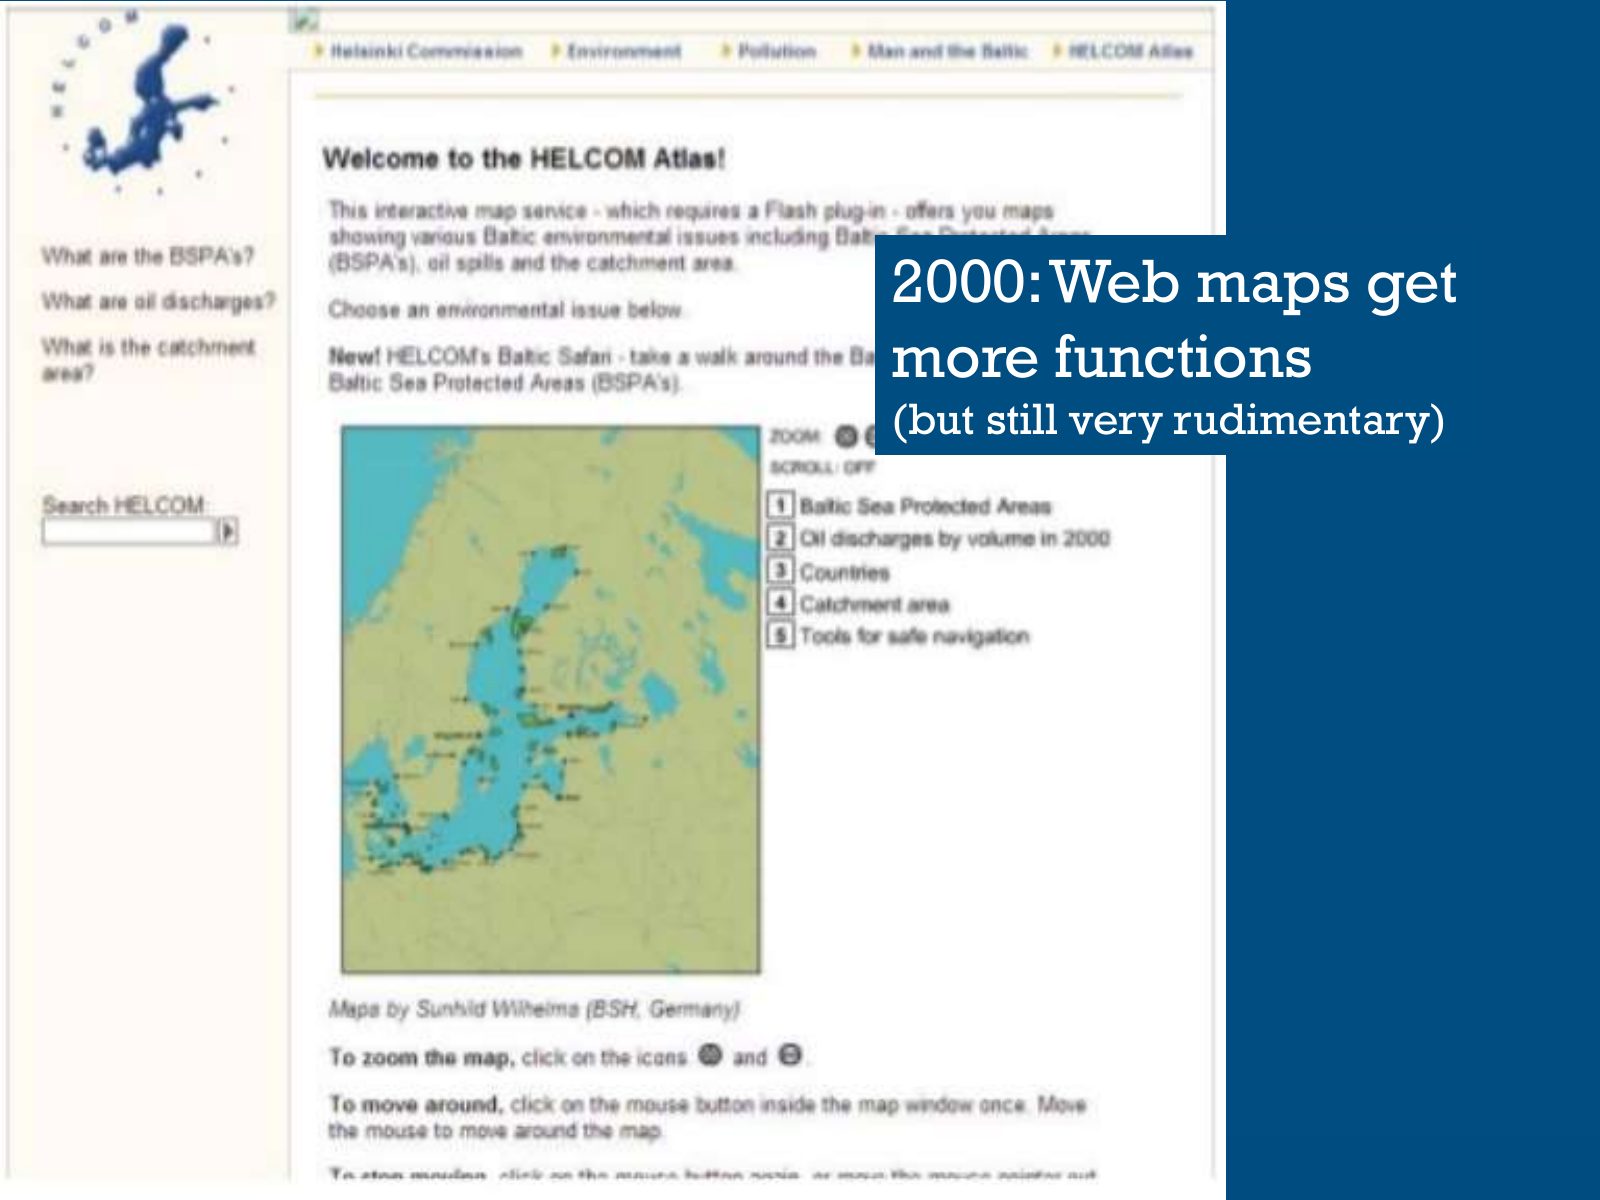
Slide 42 of 95: 2000: Web maps get more functions (but still very rudimentary)
Slide 43 of 95: But in… 2004…something important happened.
Slide 44 of 95: The Data and Information Strategy was signed by HELCOM. According to the strategy…
Slide 45 of 95: For that purpose, the first ESRI license was purchased in 2004!
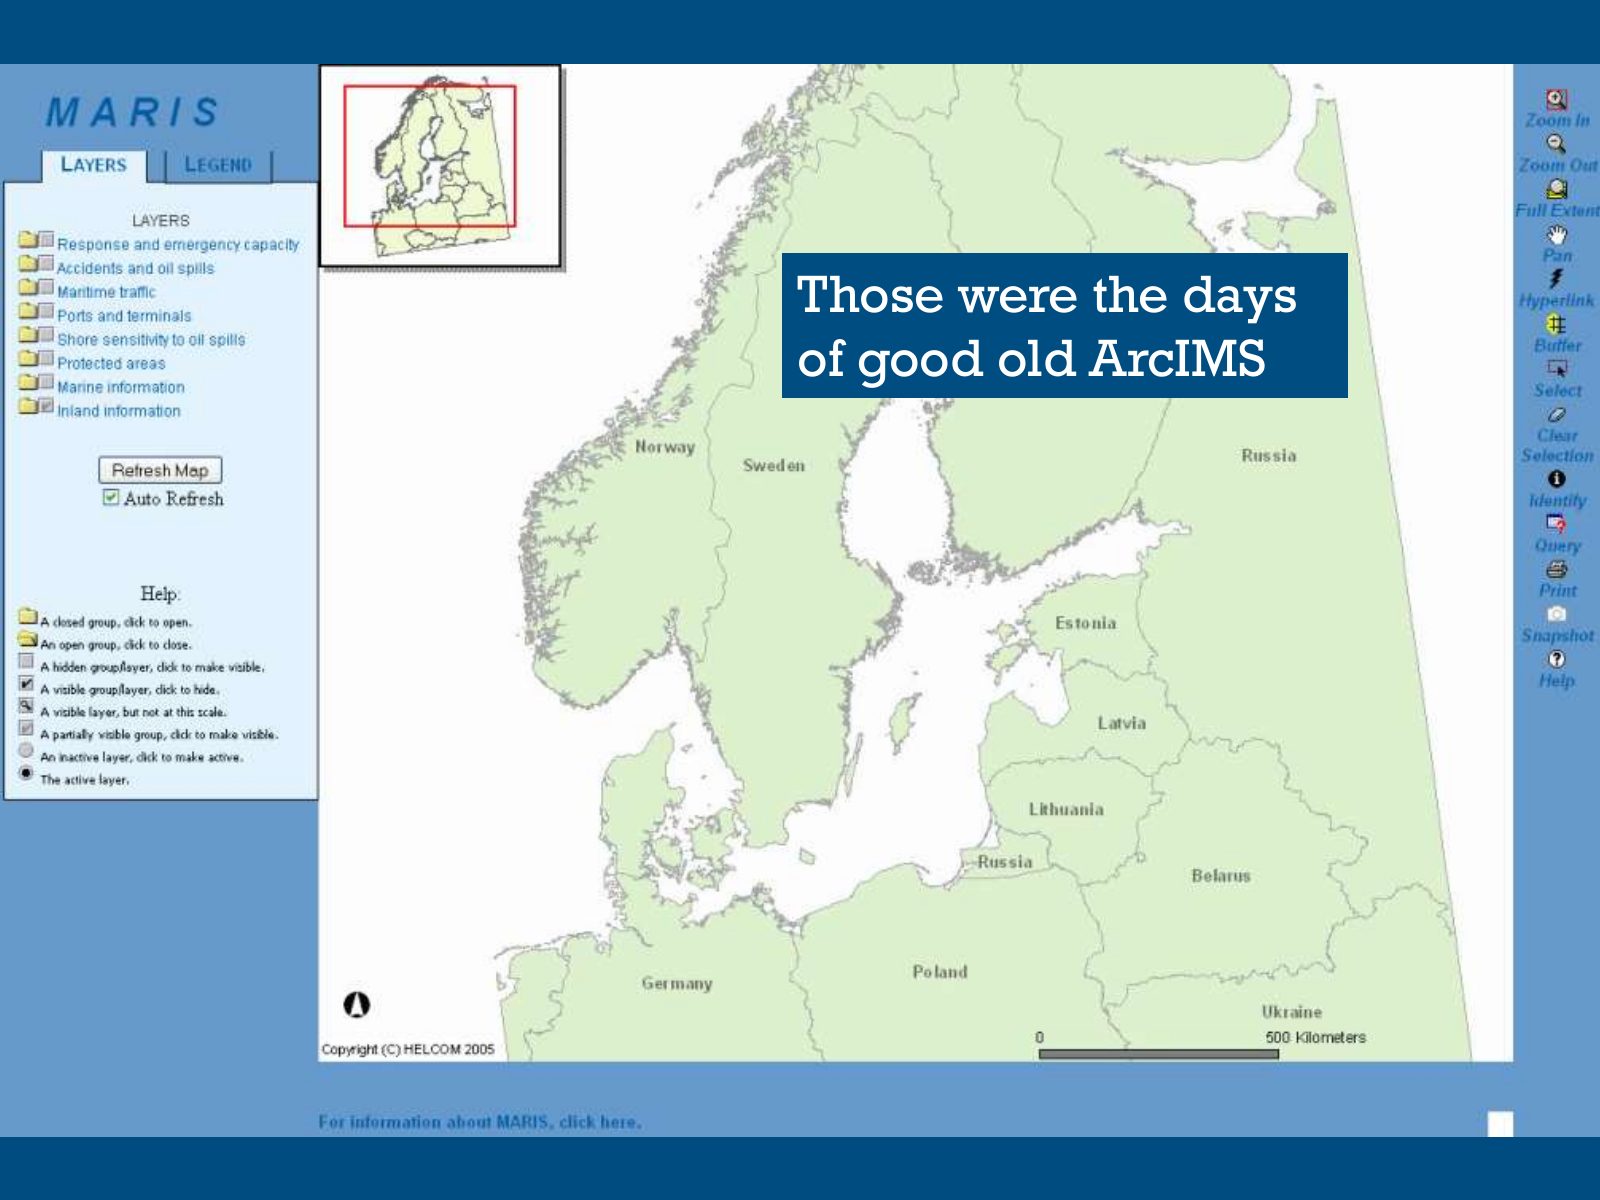
Slide 46 of 95: Those were the days of good old ArcIMS First maps services published: ArcIMS
Slide 47 of 95: And in… 2010 HELCOM took a big step forward
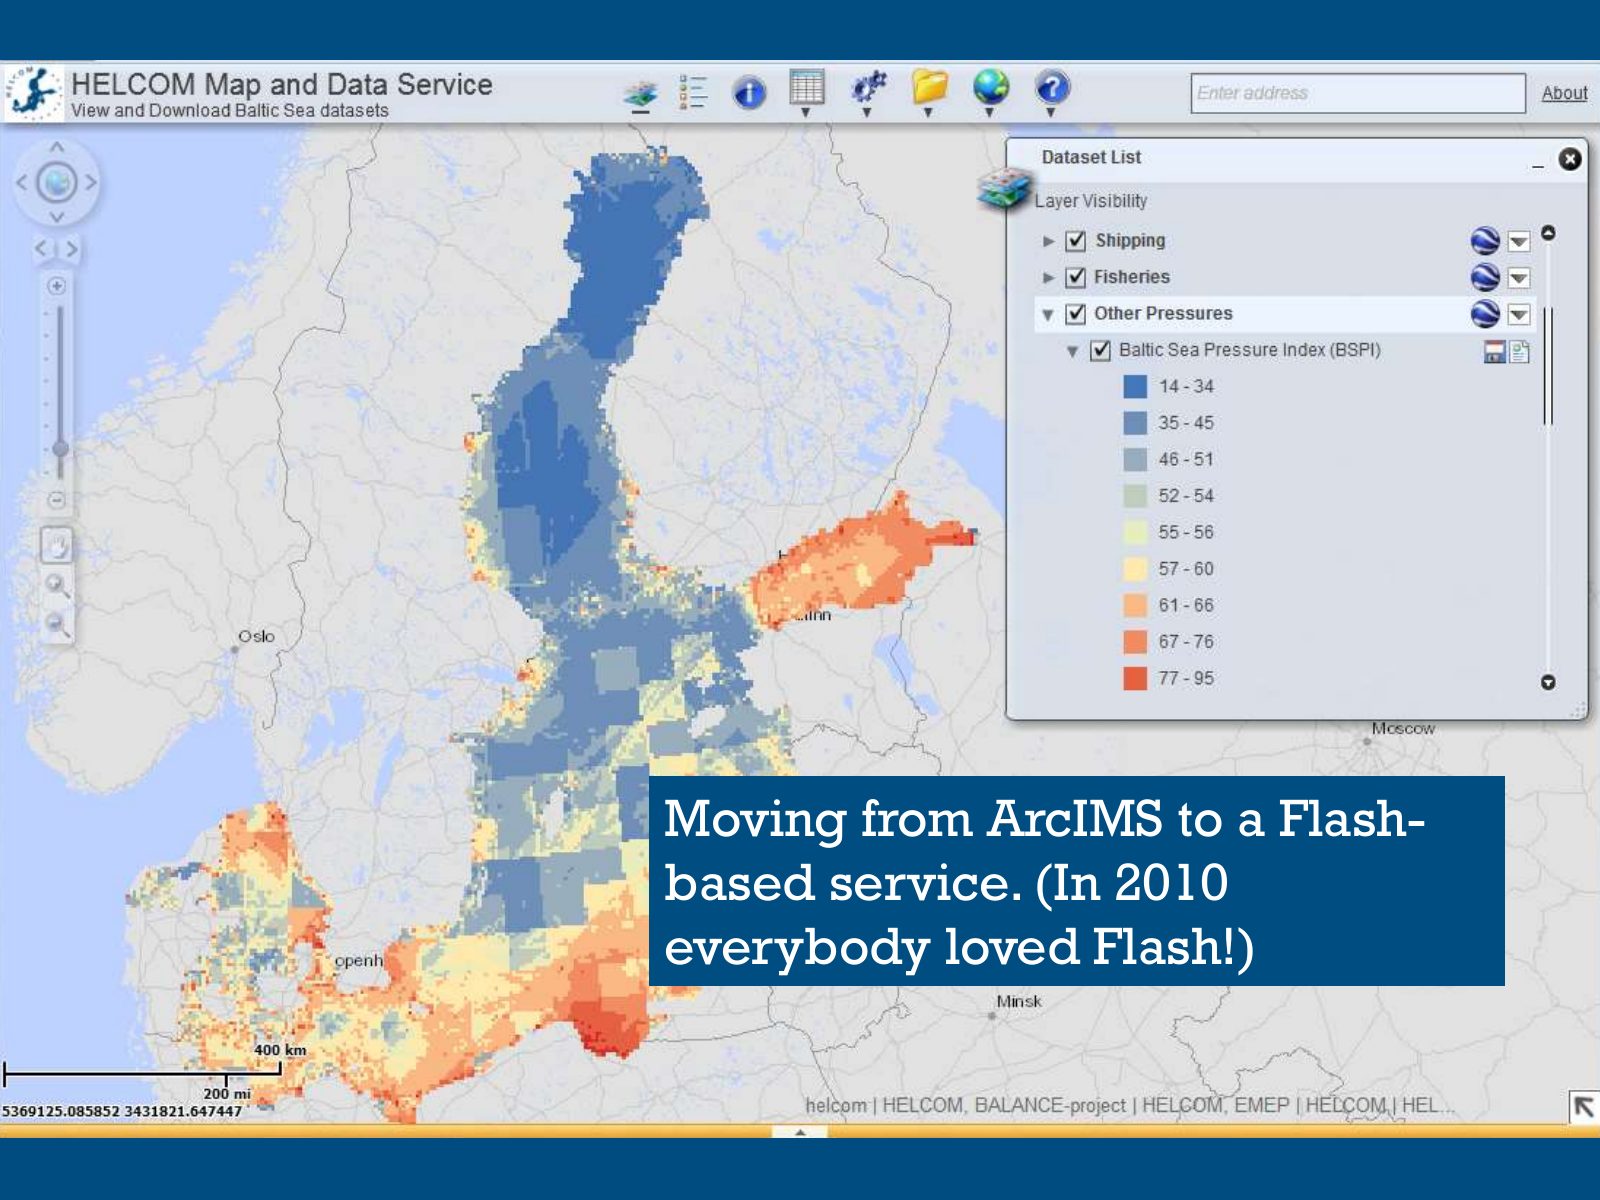
Slide 48 of 95: Moving from ArcIMS to a Flash- based service. (In 2010 everybody loved Flash!)
Slide 49 of 95: Year… 2013 …was even more important…
Slide 50 of 95: …because HELCOM got ESRI’s… Without it, HELCOM couldn’t possibly afford ESRI products—HELCOM is financed by states which means the budget is usually low.
Slide 51 of 95: Finally… 2017 …was the year to say goodbye.
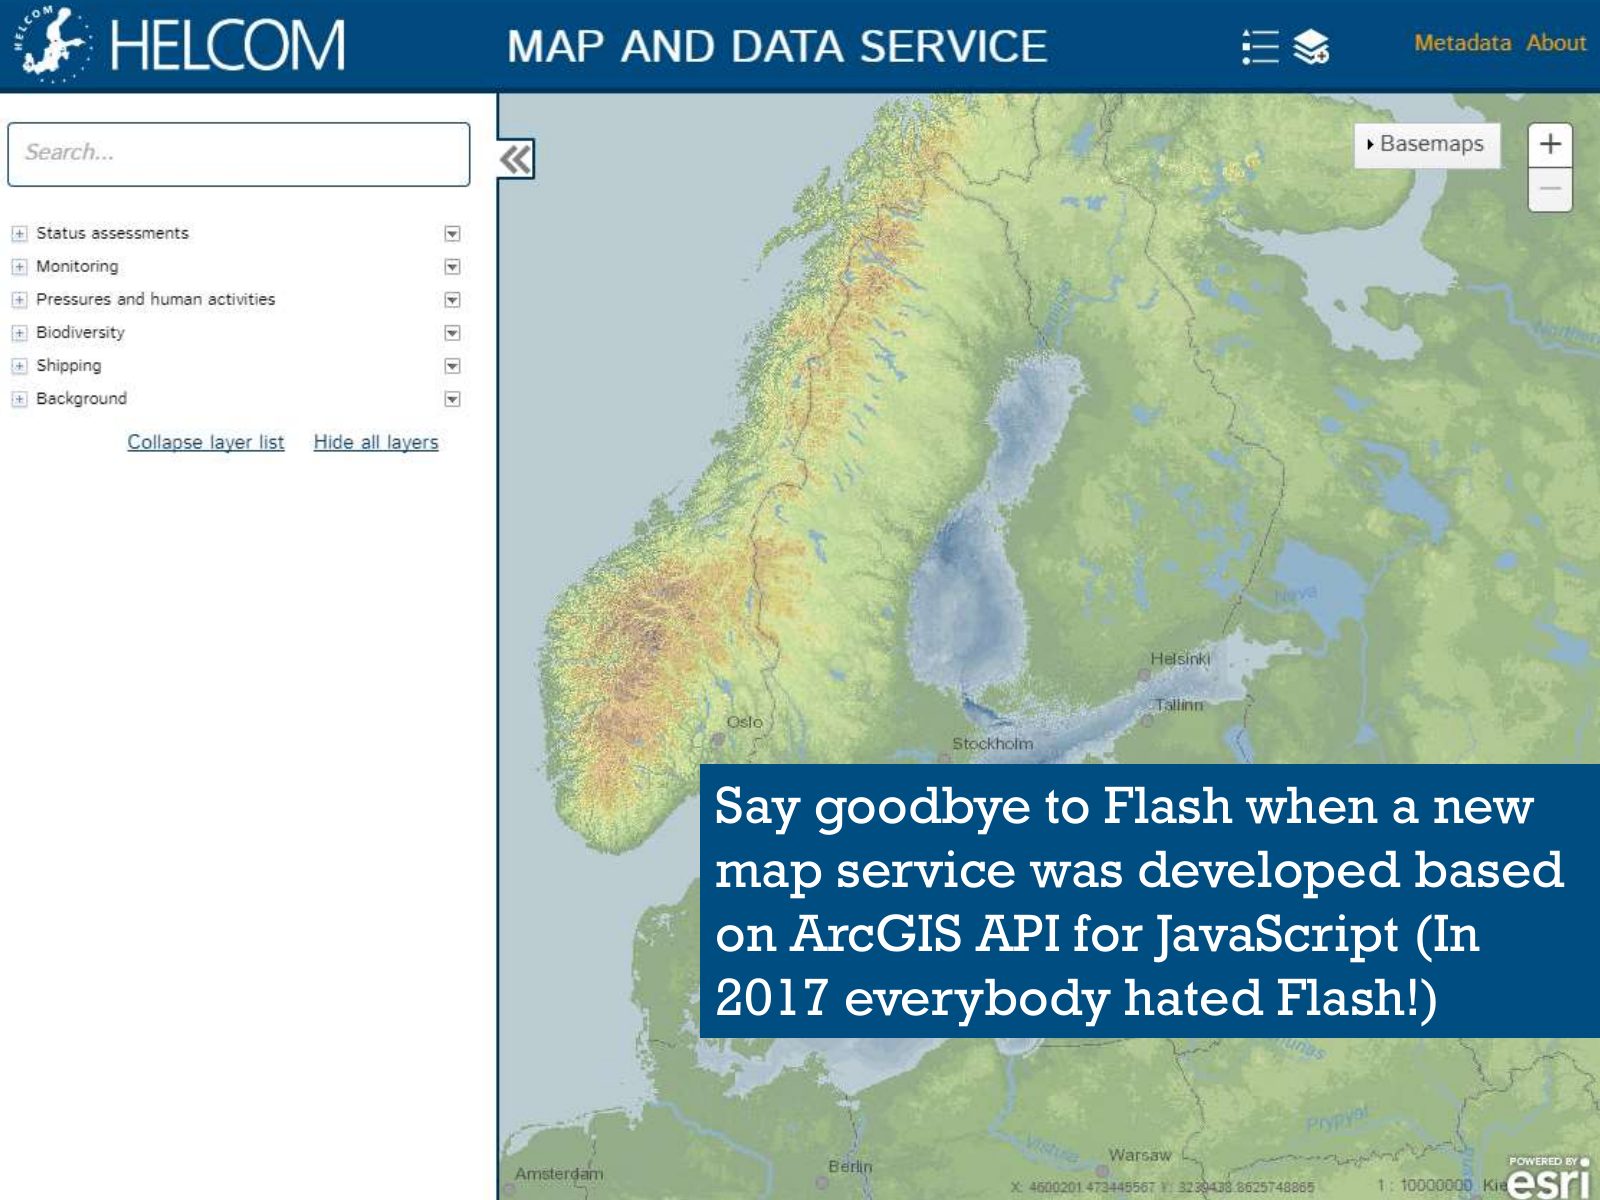
Slide 52 of 95: Say goodbye to Flash when a new map service was developed based on ArcGIS API for JavaScript (In 2017 everybody hated Flash!)
Slide 53 of 95: Now that we know the history of HELCOM and GIS, wouldn’t talking about how we use GIS and maps be interesting?
Slide 54 of 95: Agreed! Let’s talk now about our current systems and the future!
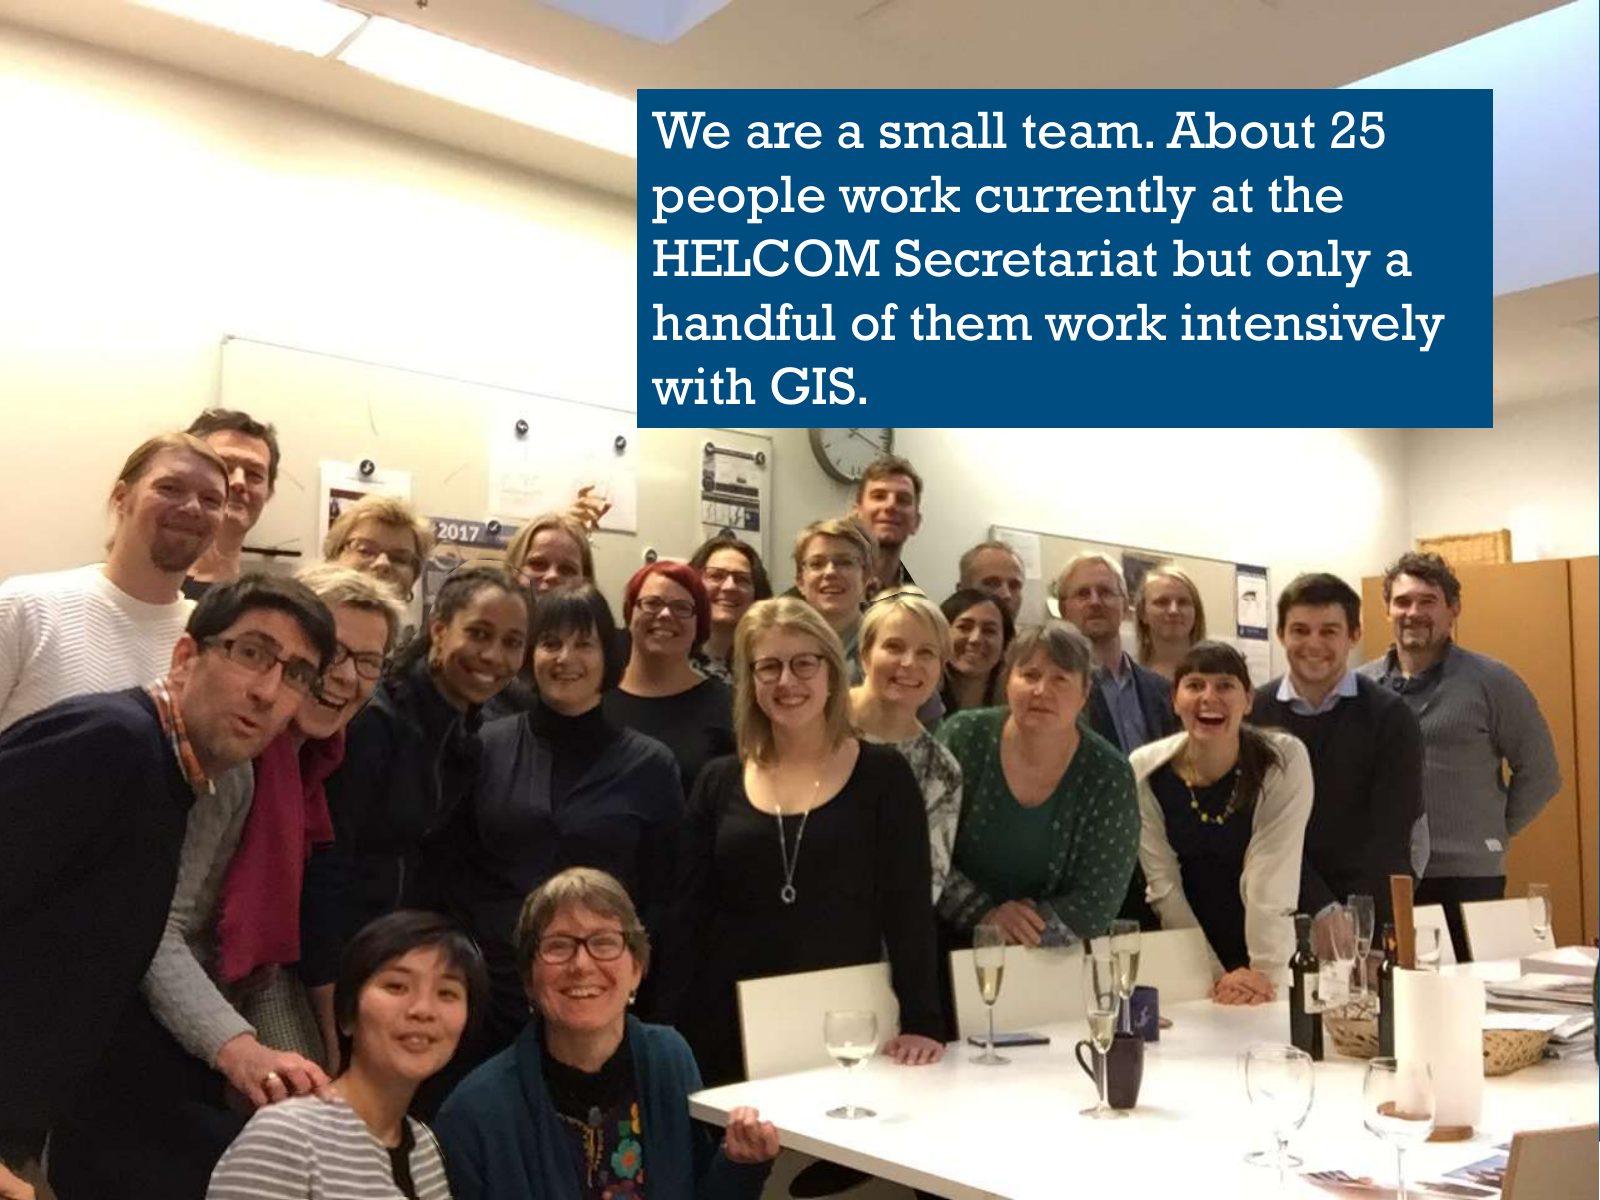
Slide 55 of 95: We are a small team. About 25 people work currently at the HELCOM Secretariat but only a handful of them work intensively with GIS.
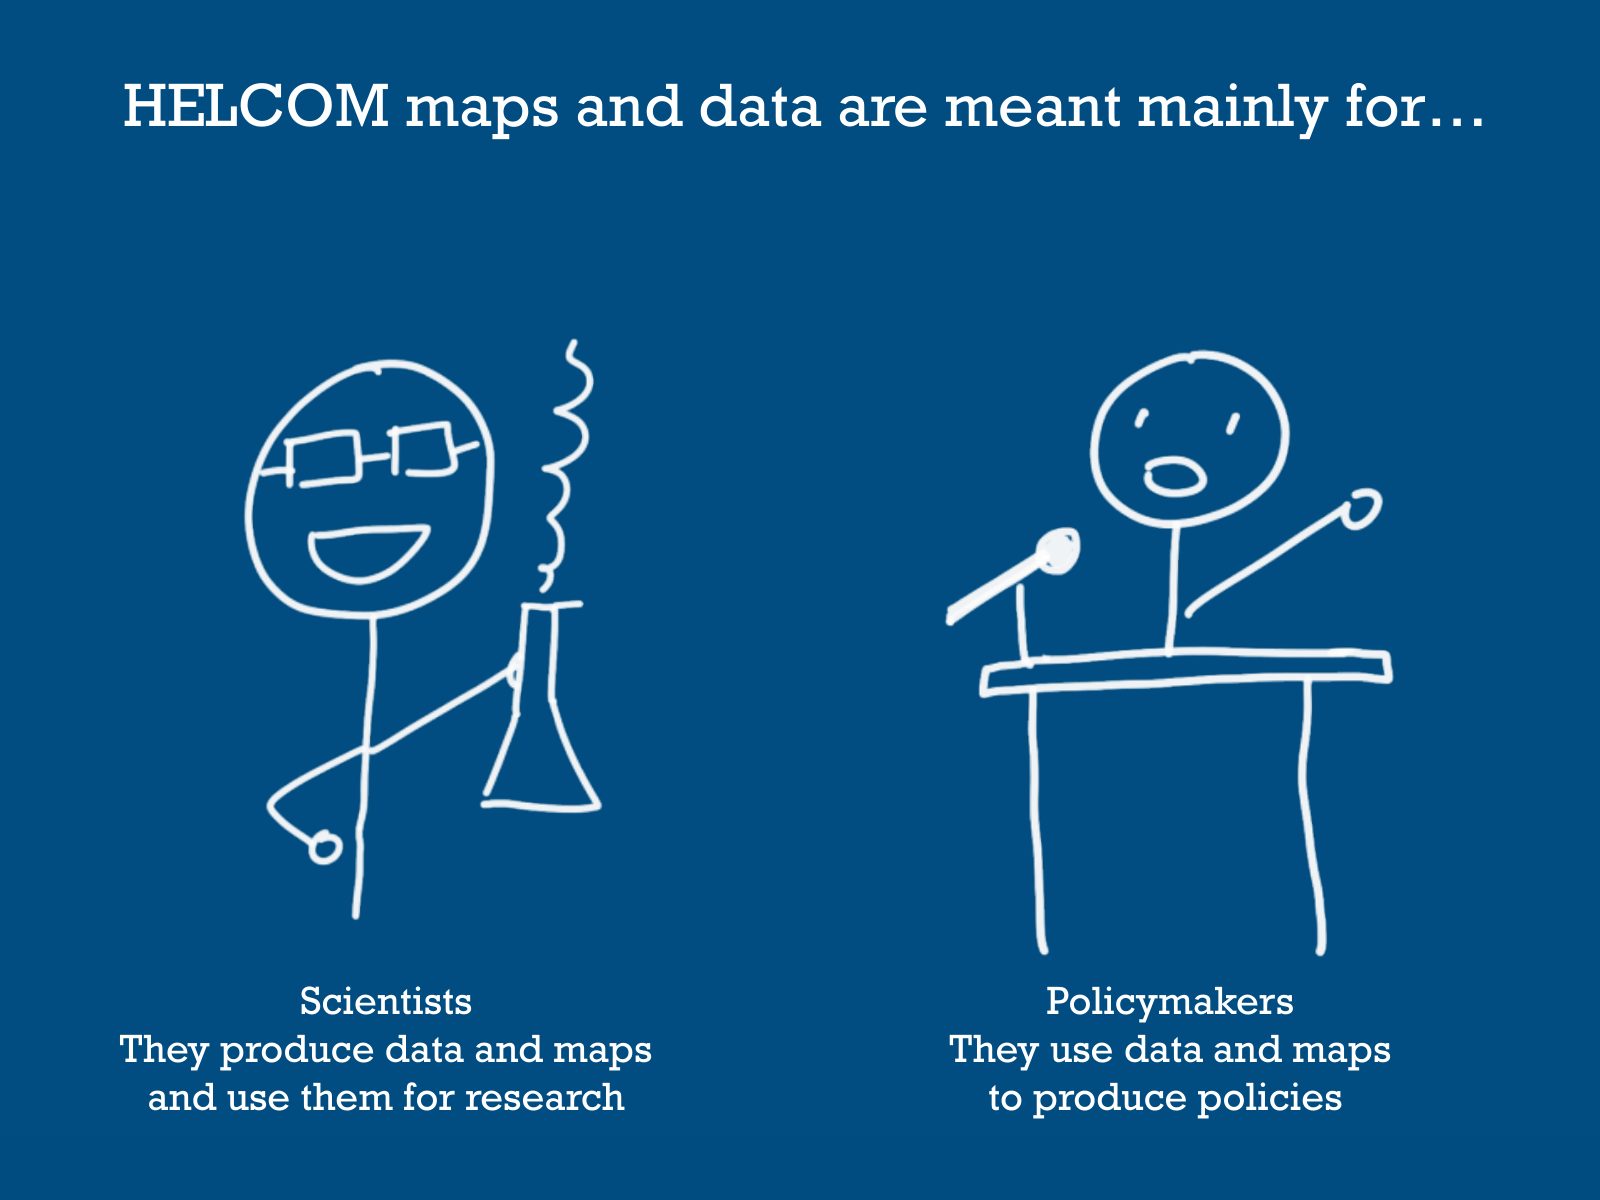
Slide 56 of 95: HELCOM maps and data are meant mainly for… Scientists Policymakers They produce data and maps They use data and maps and use them for research to produce pol…
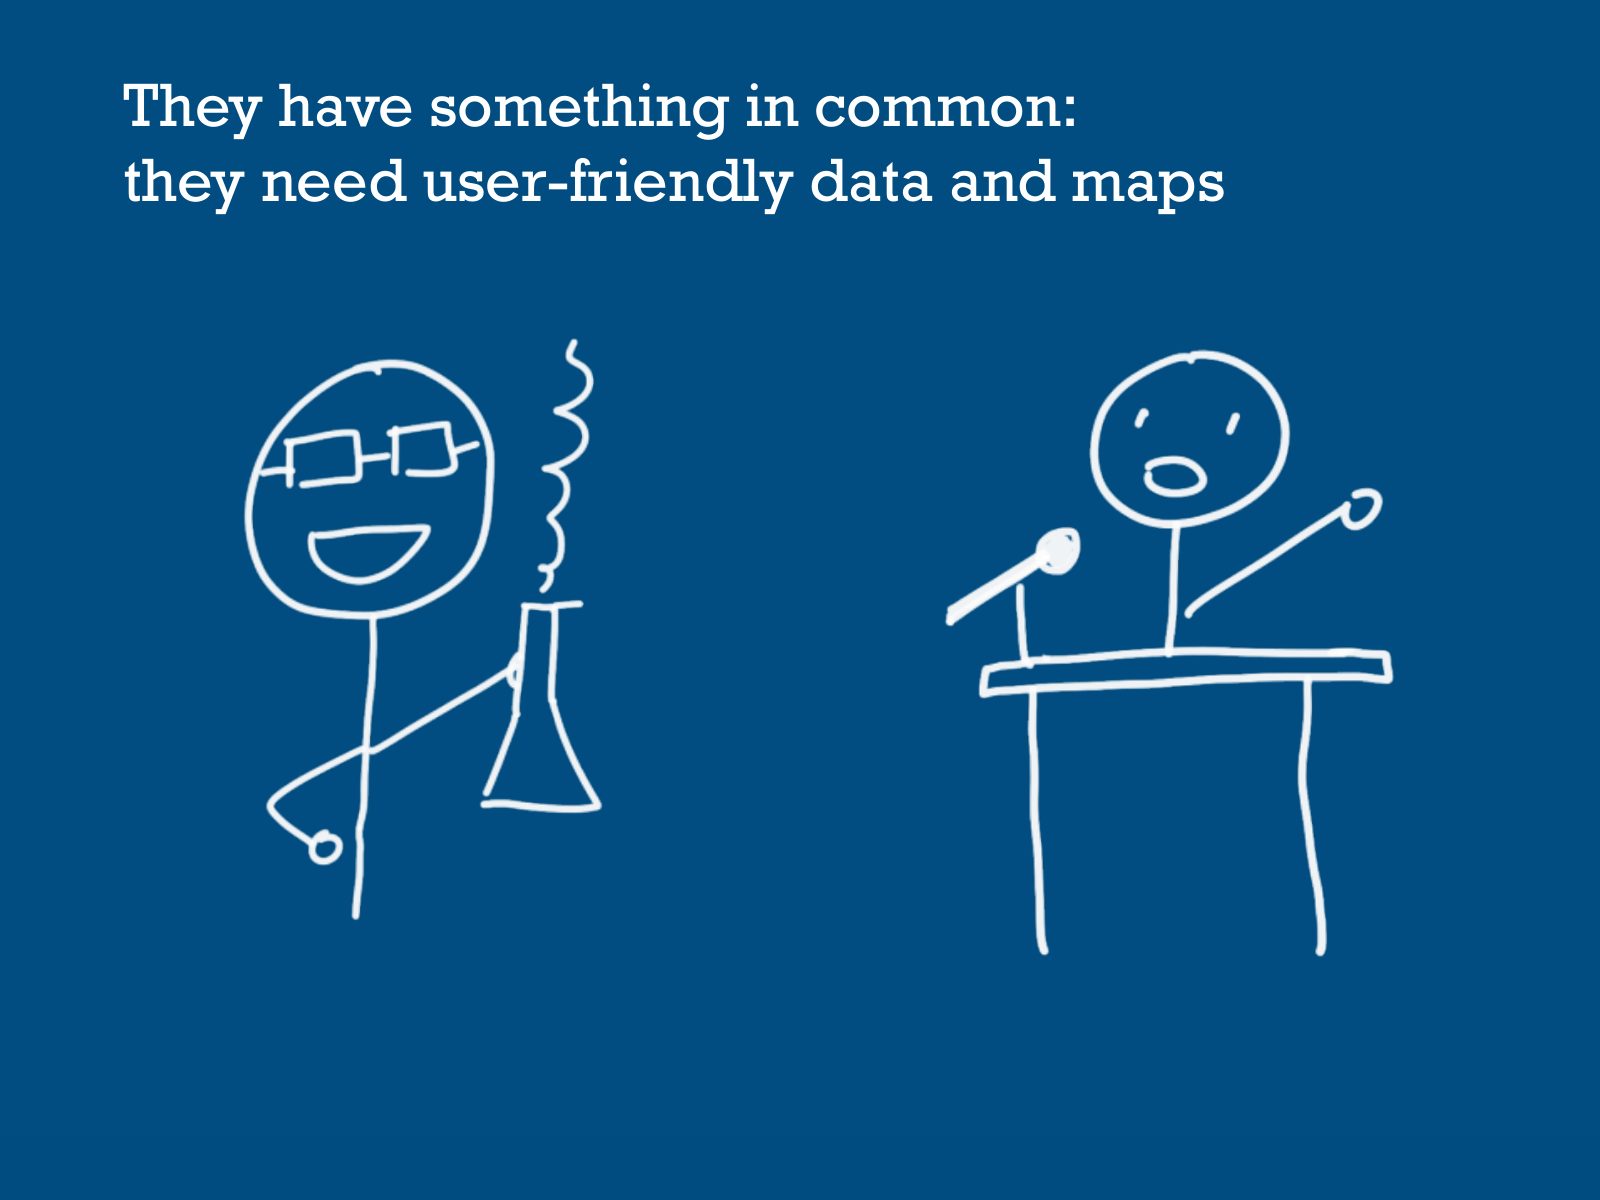
Slide 57 of 95: They have something in common: they need user-friendly data and maps
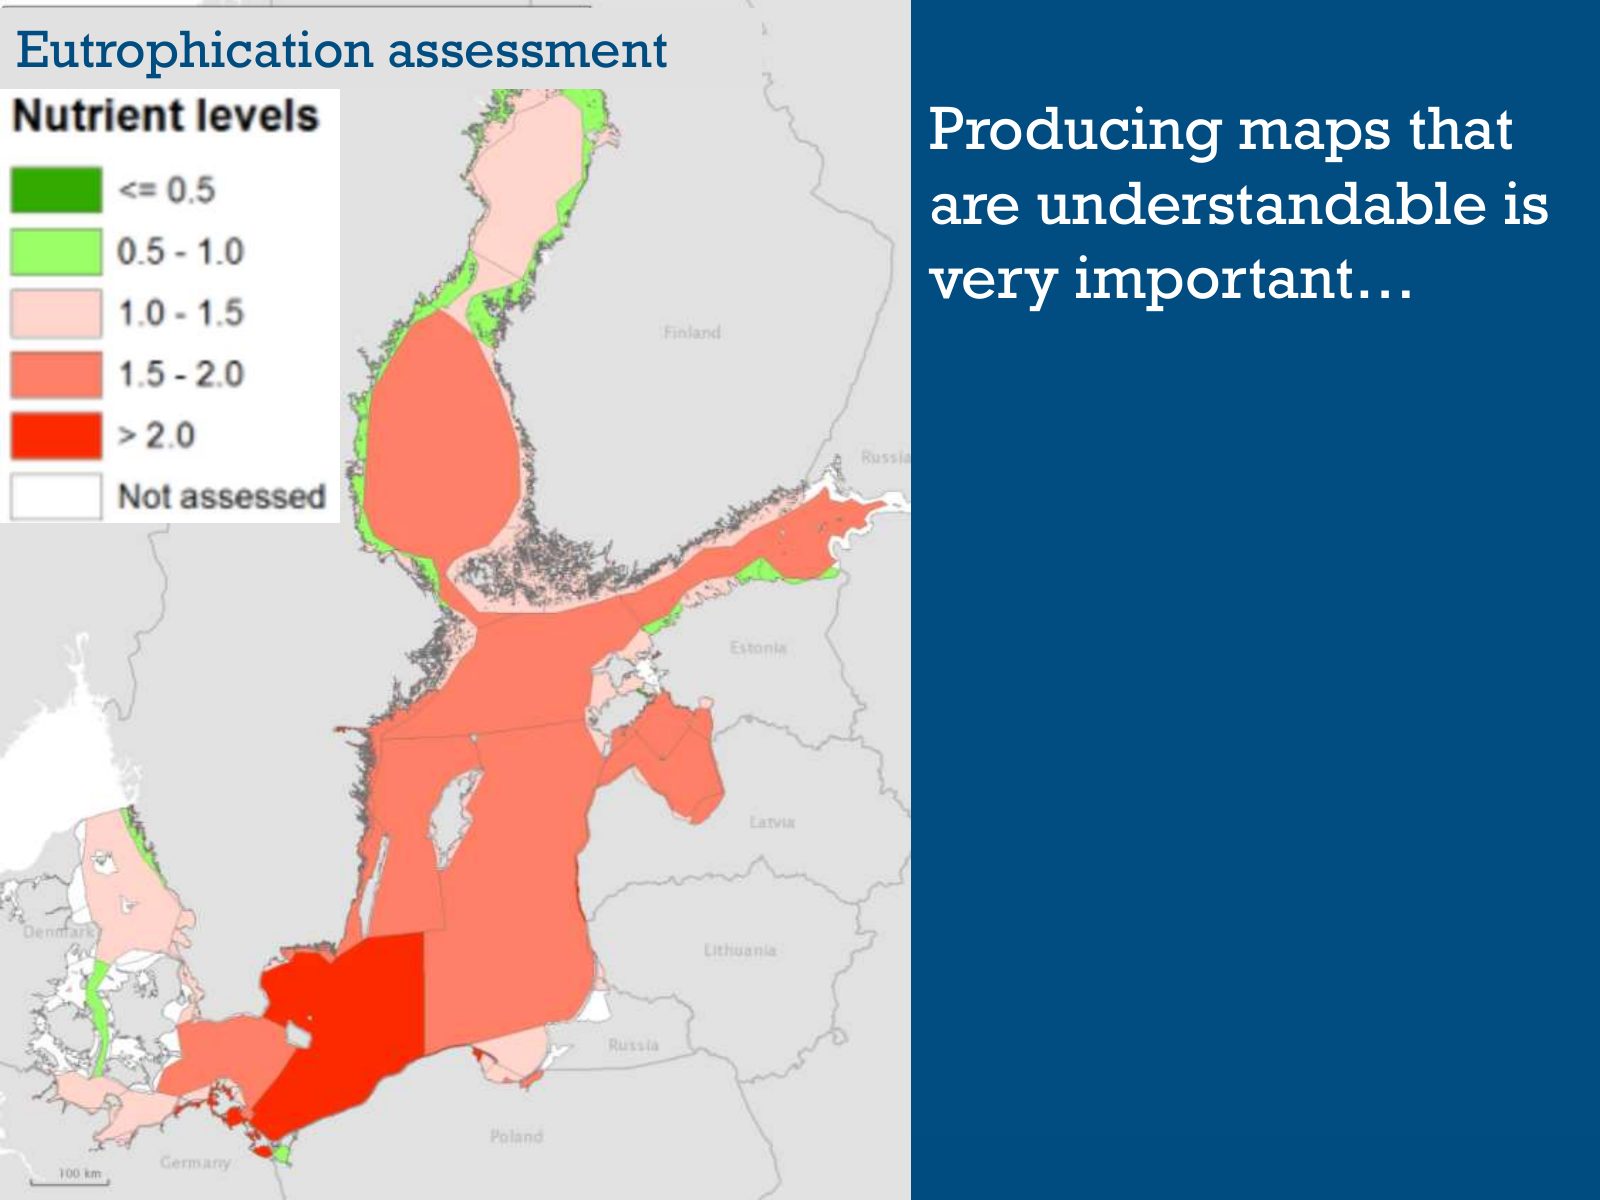
Slide 58 of 95: Eutrophication assessment Producing maps that are understandable is very important…
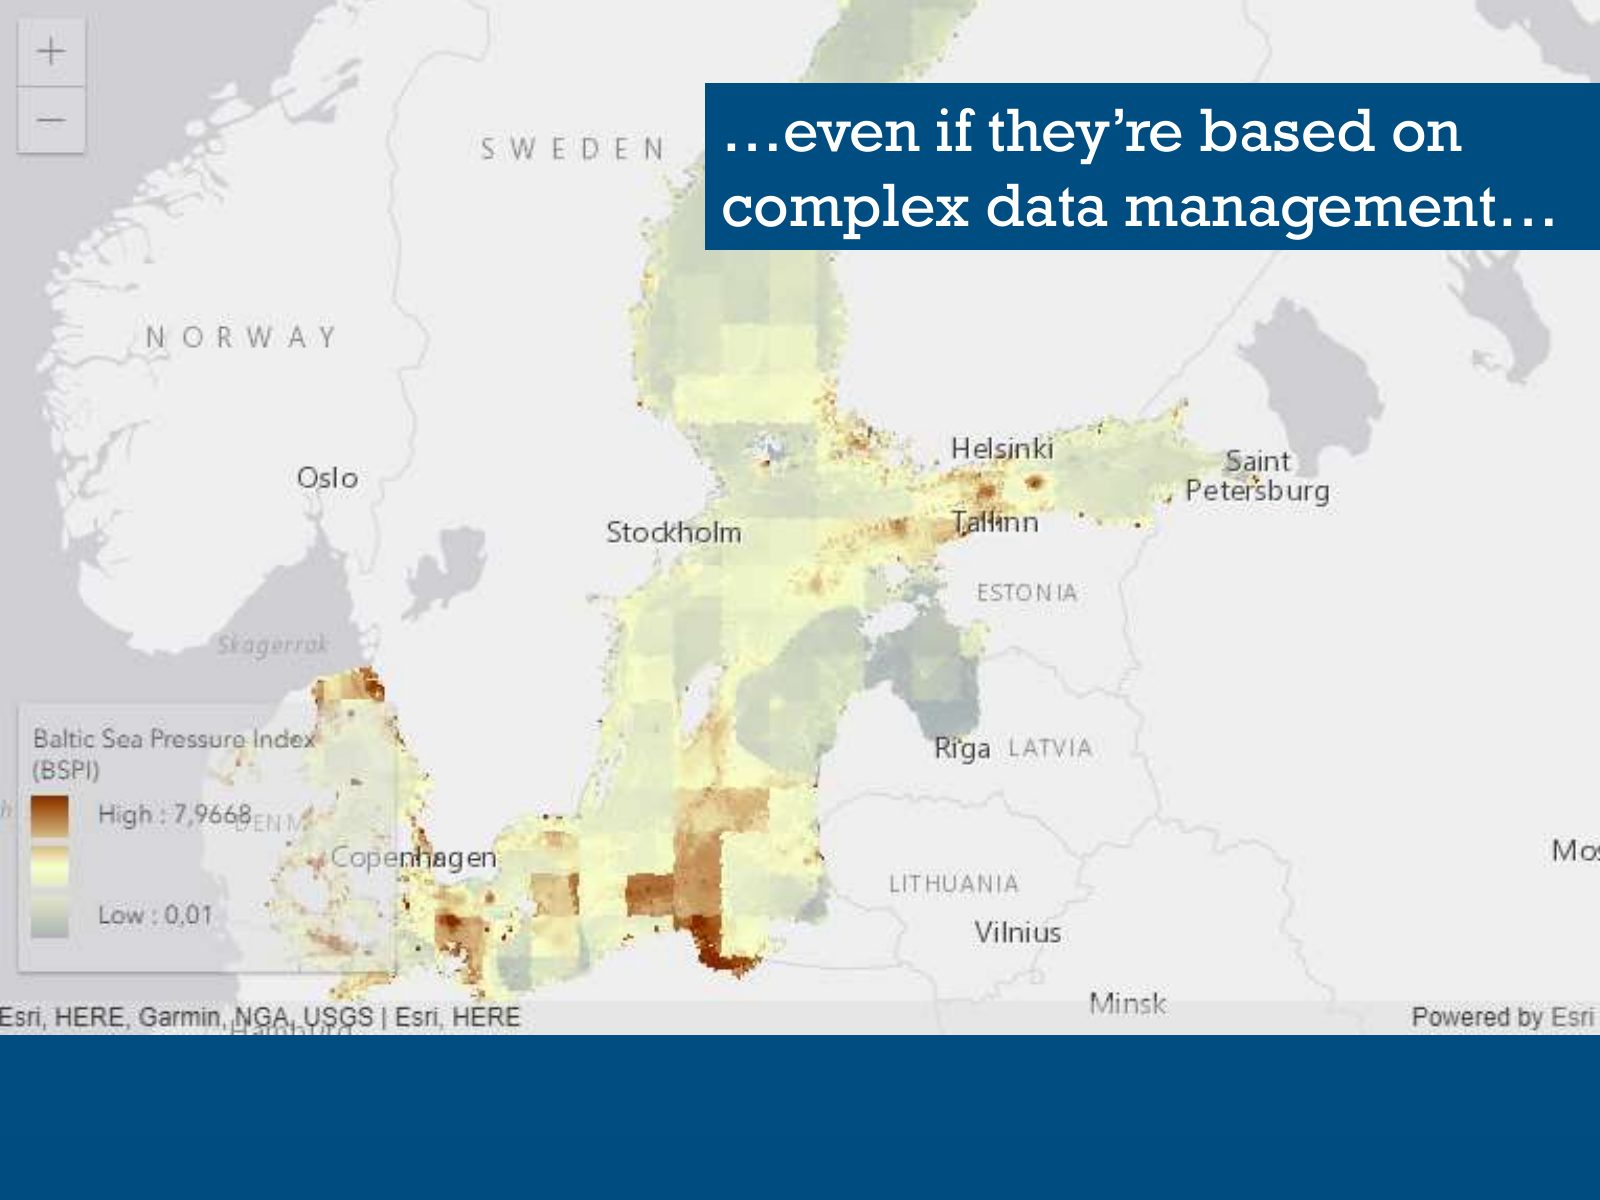
Slide 59 of 95: …even if they’re based on complex data management…
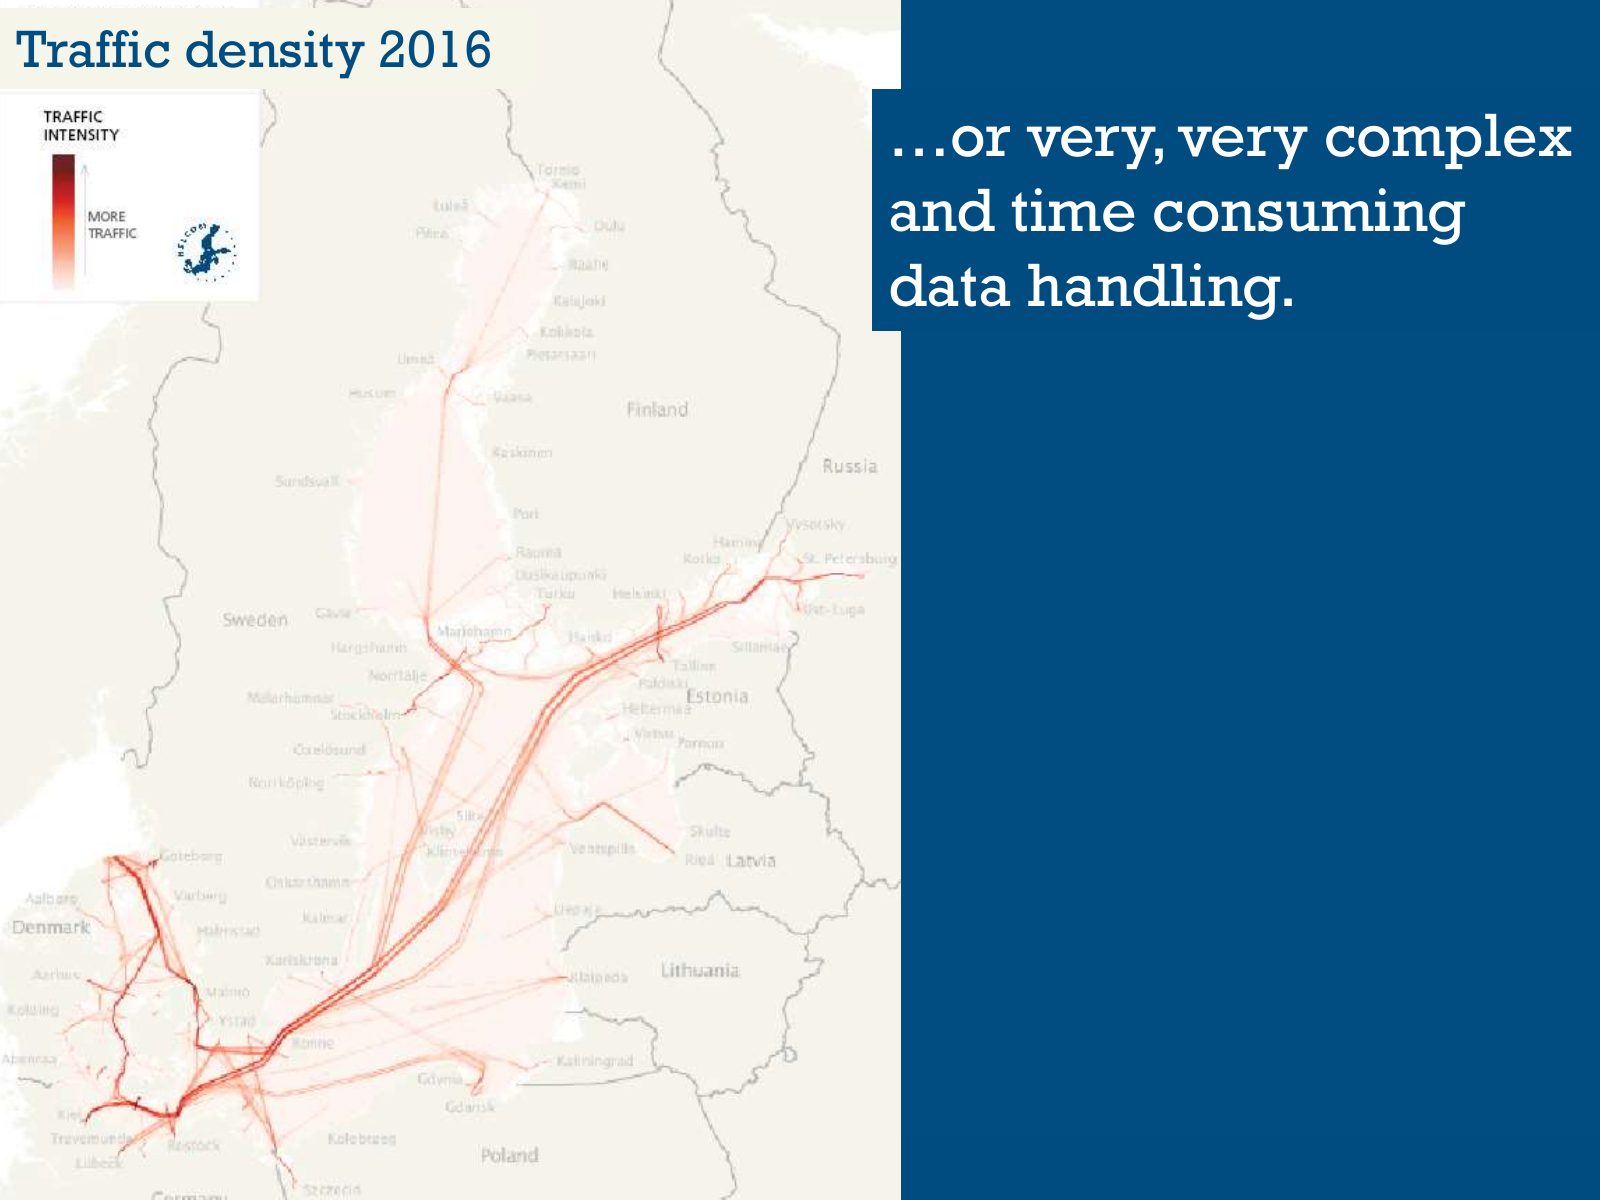
Slide 60 of 95: Traffic density 2016 …or very, very complex and time consuming data handling.
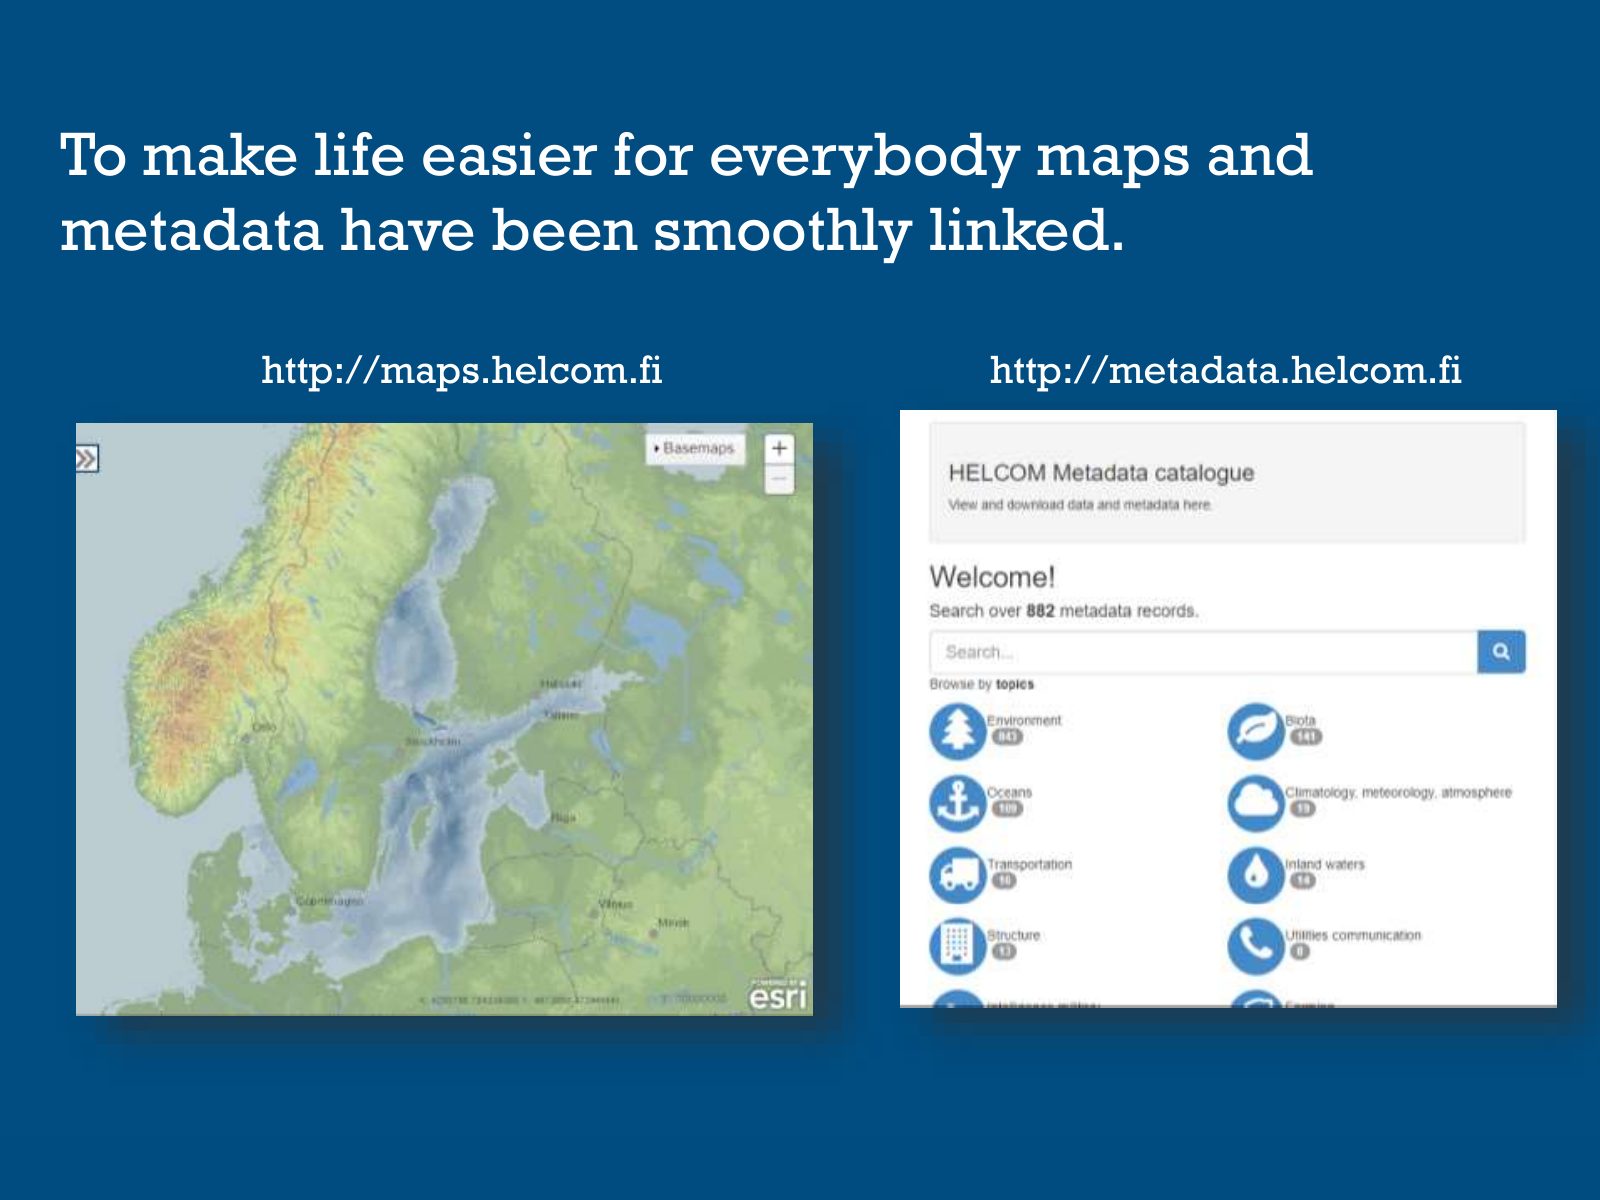
Slide 61 of 95: To make life easier for everybody maps and metadata have been smoothly linked. http://maps.helcom.fi http://metadata.helcom.fi
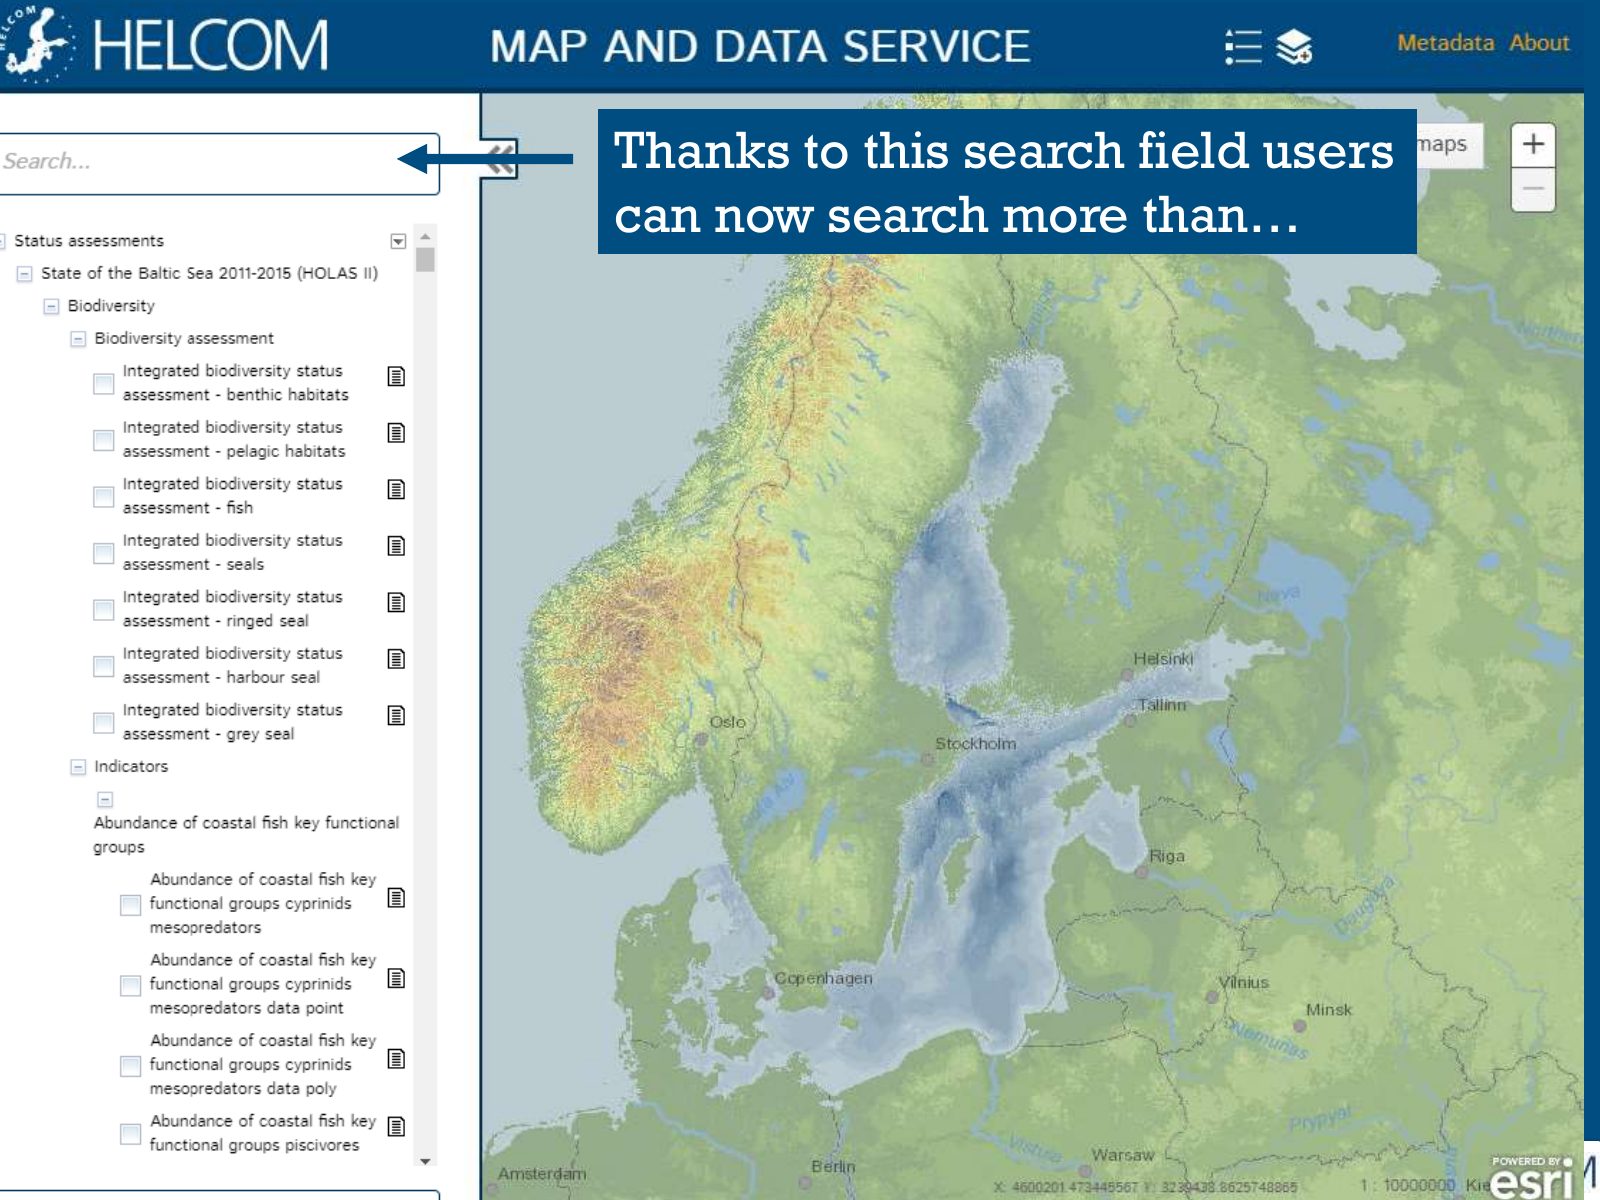
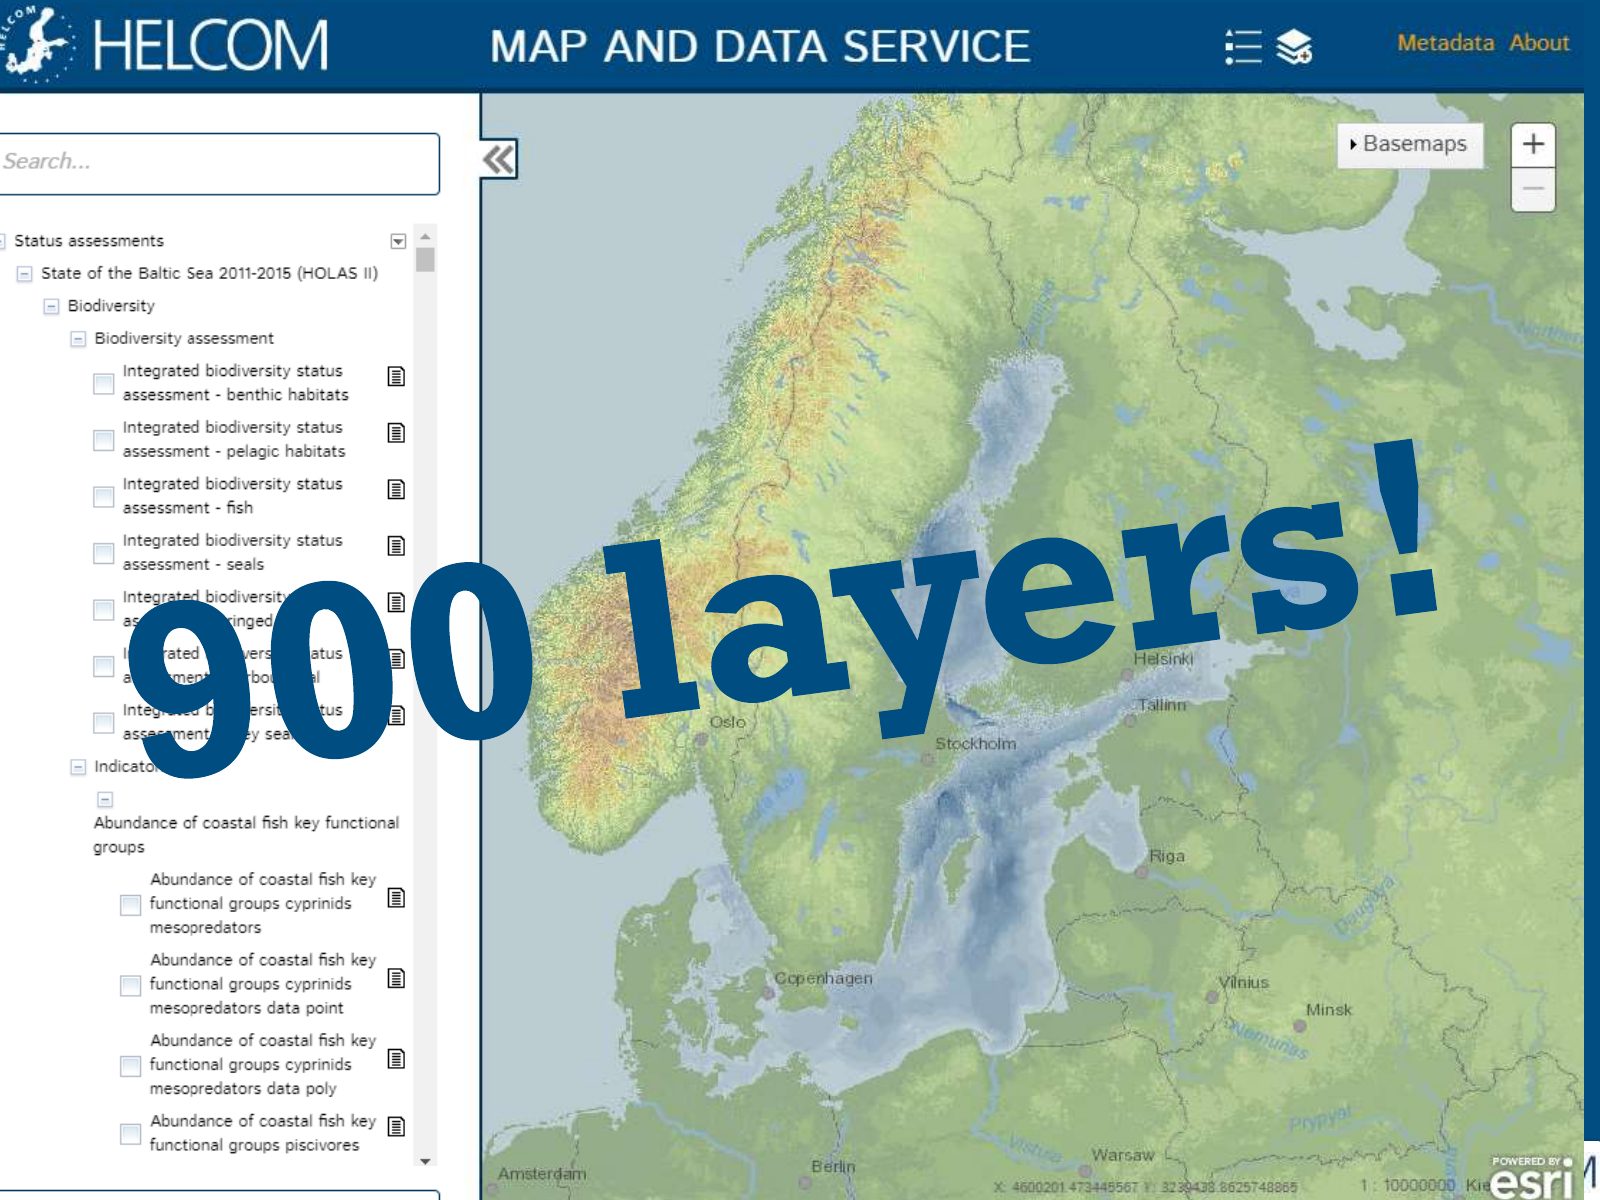
Slide 62 of 95: Thanks to this search field users can now search more than…
Slide 63 of 95: picture slide without text
Slide 64 of 95: What about the future? David.Asch
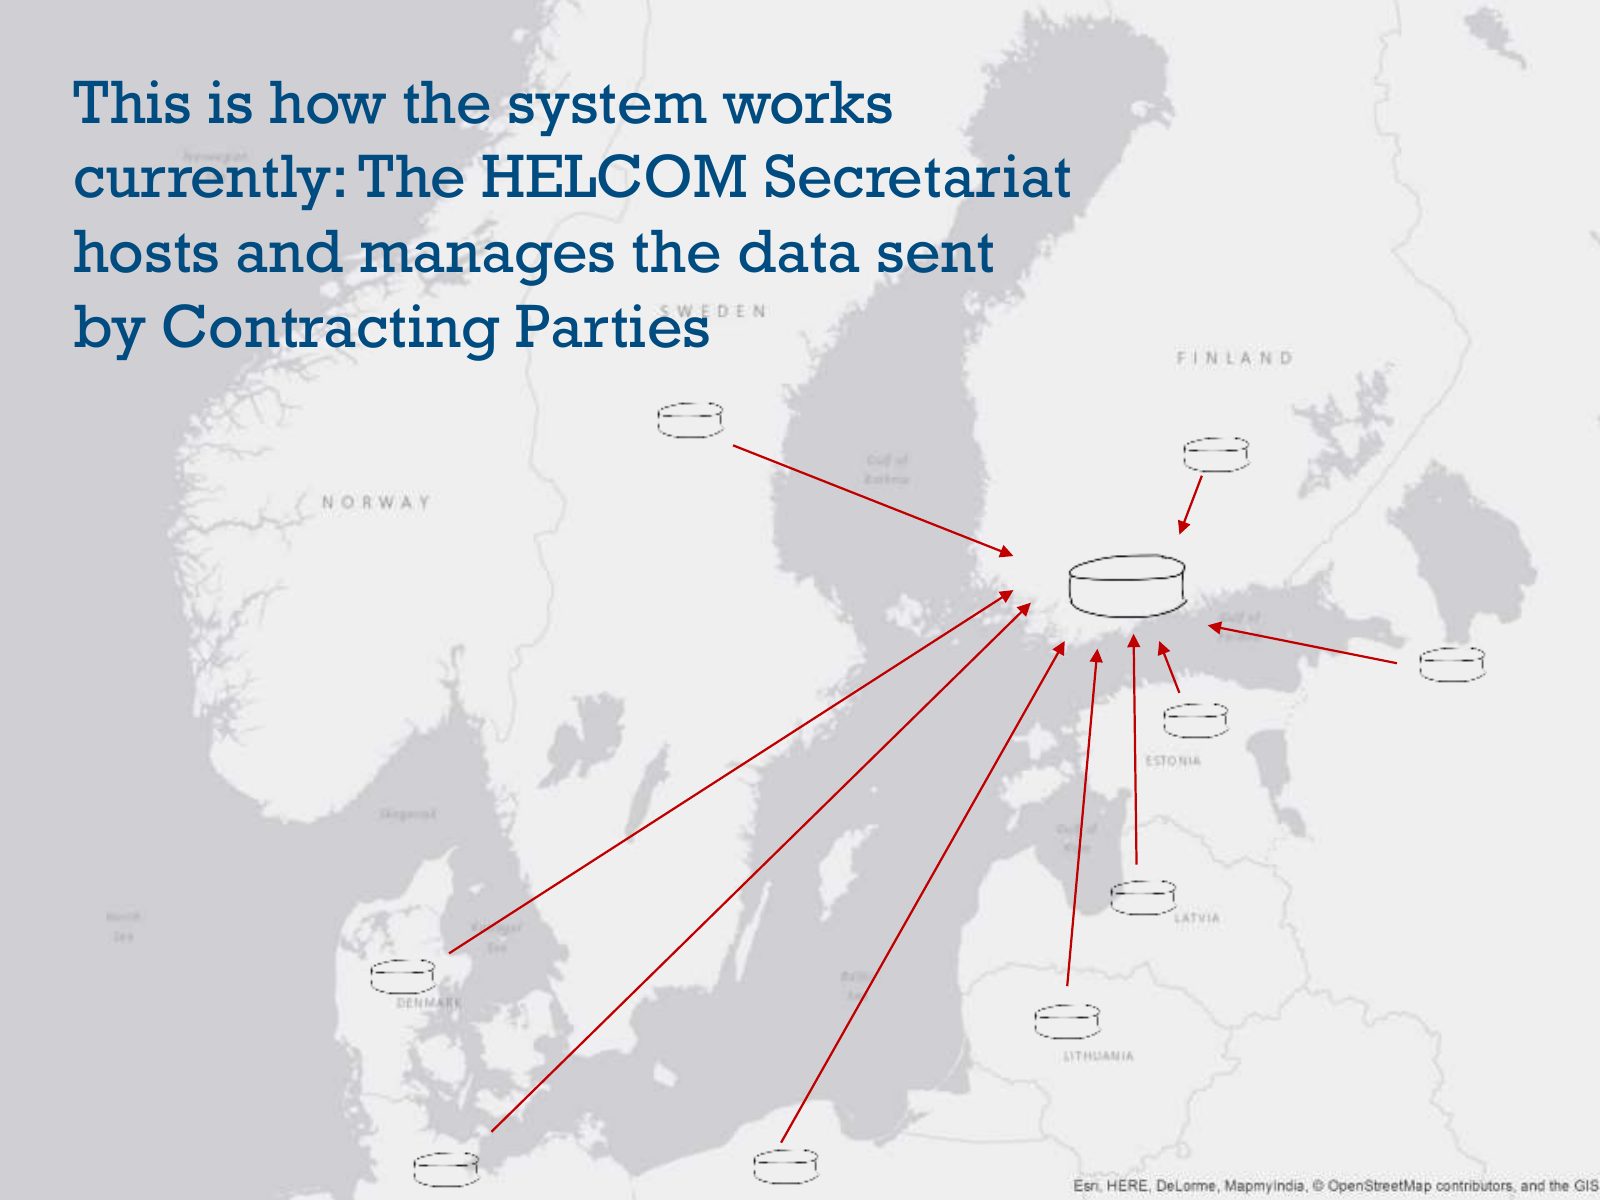
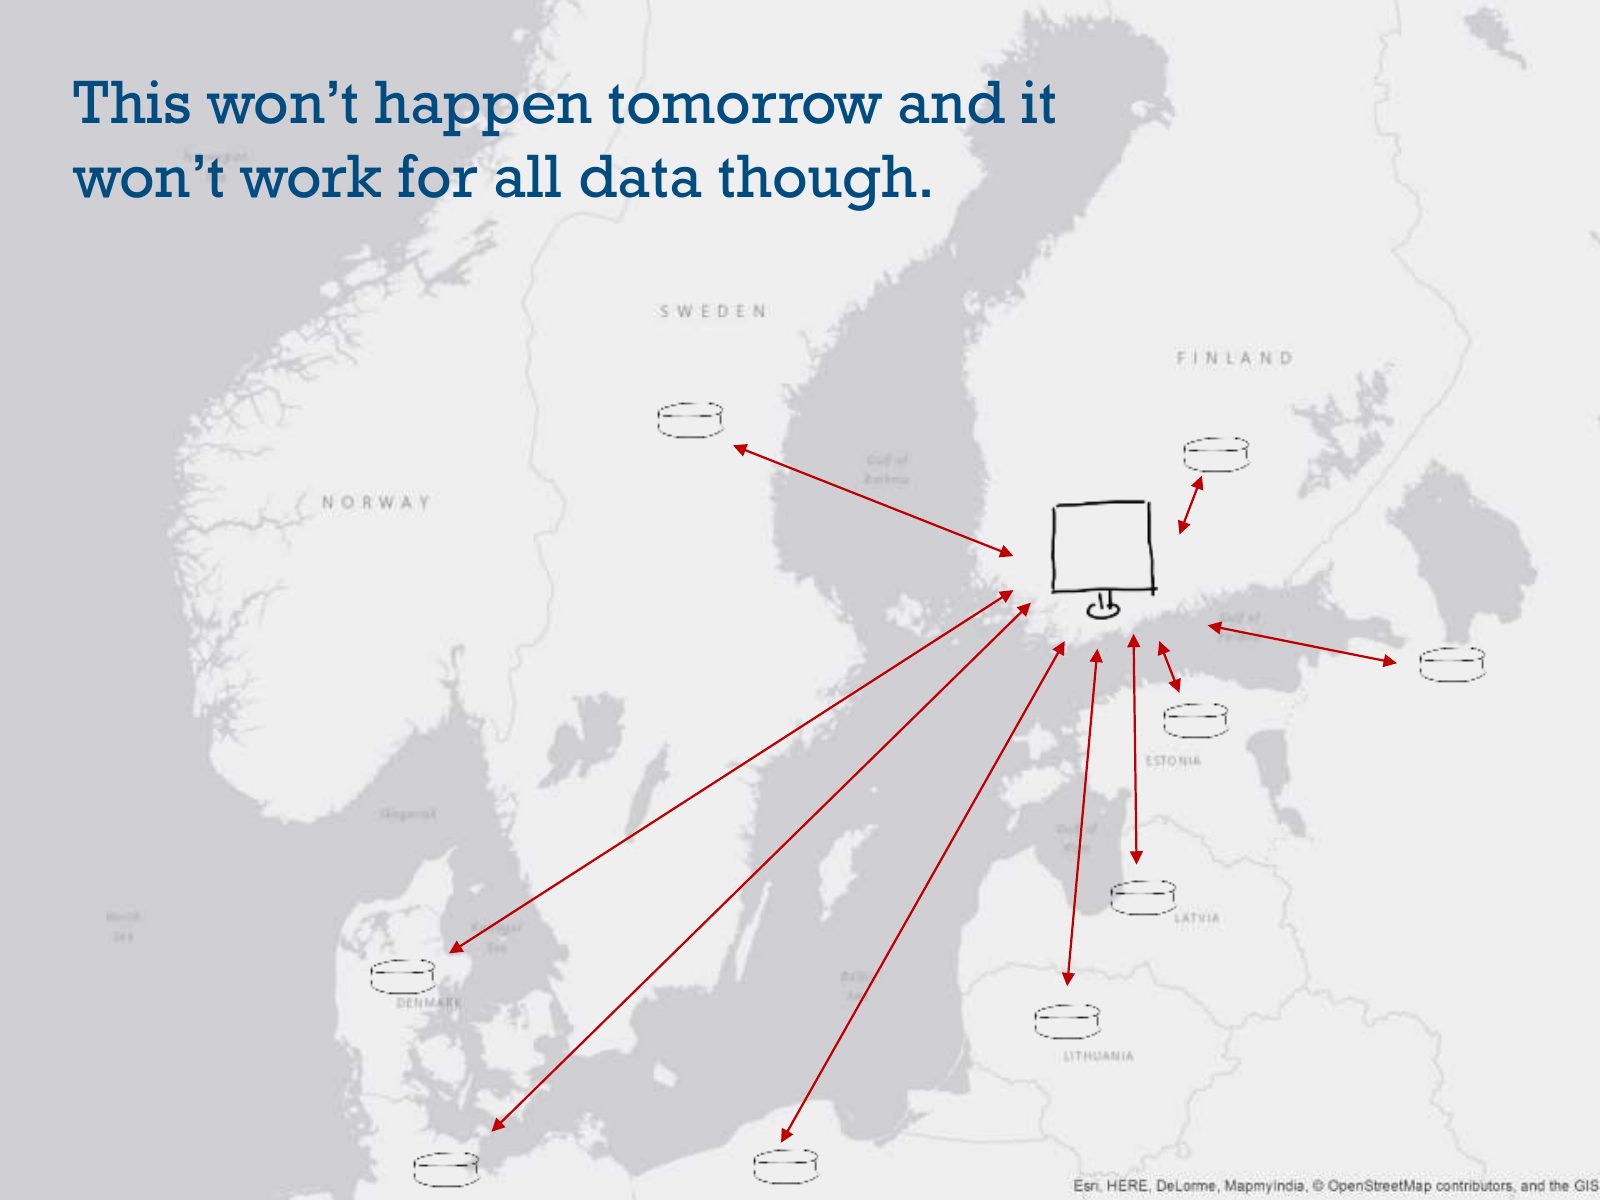
Slide 65 of 95: This is how the system works currently: The HELCOM Secretariat hosts and manages the data sent by Contracting Parties
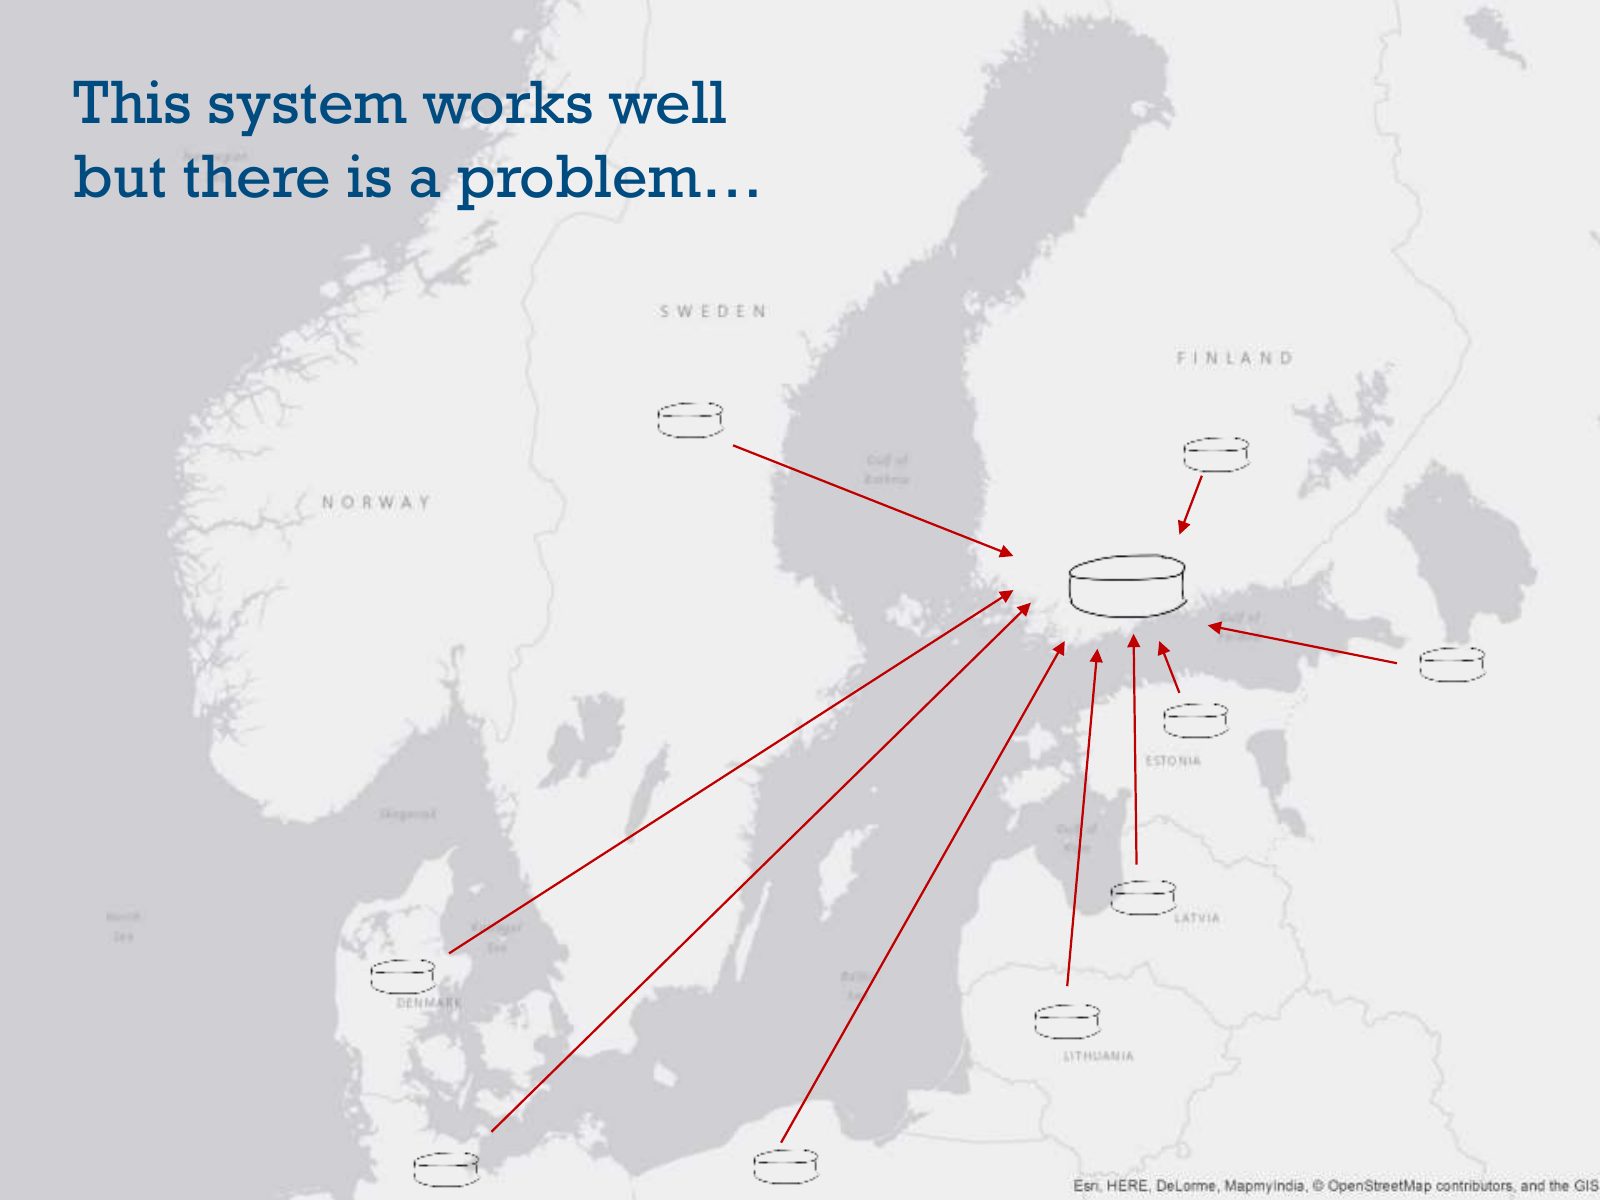
Slide 66 of 95: This system works well but there is a problem…
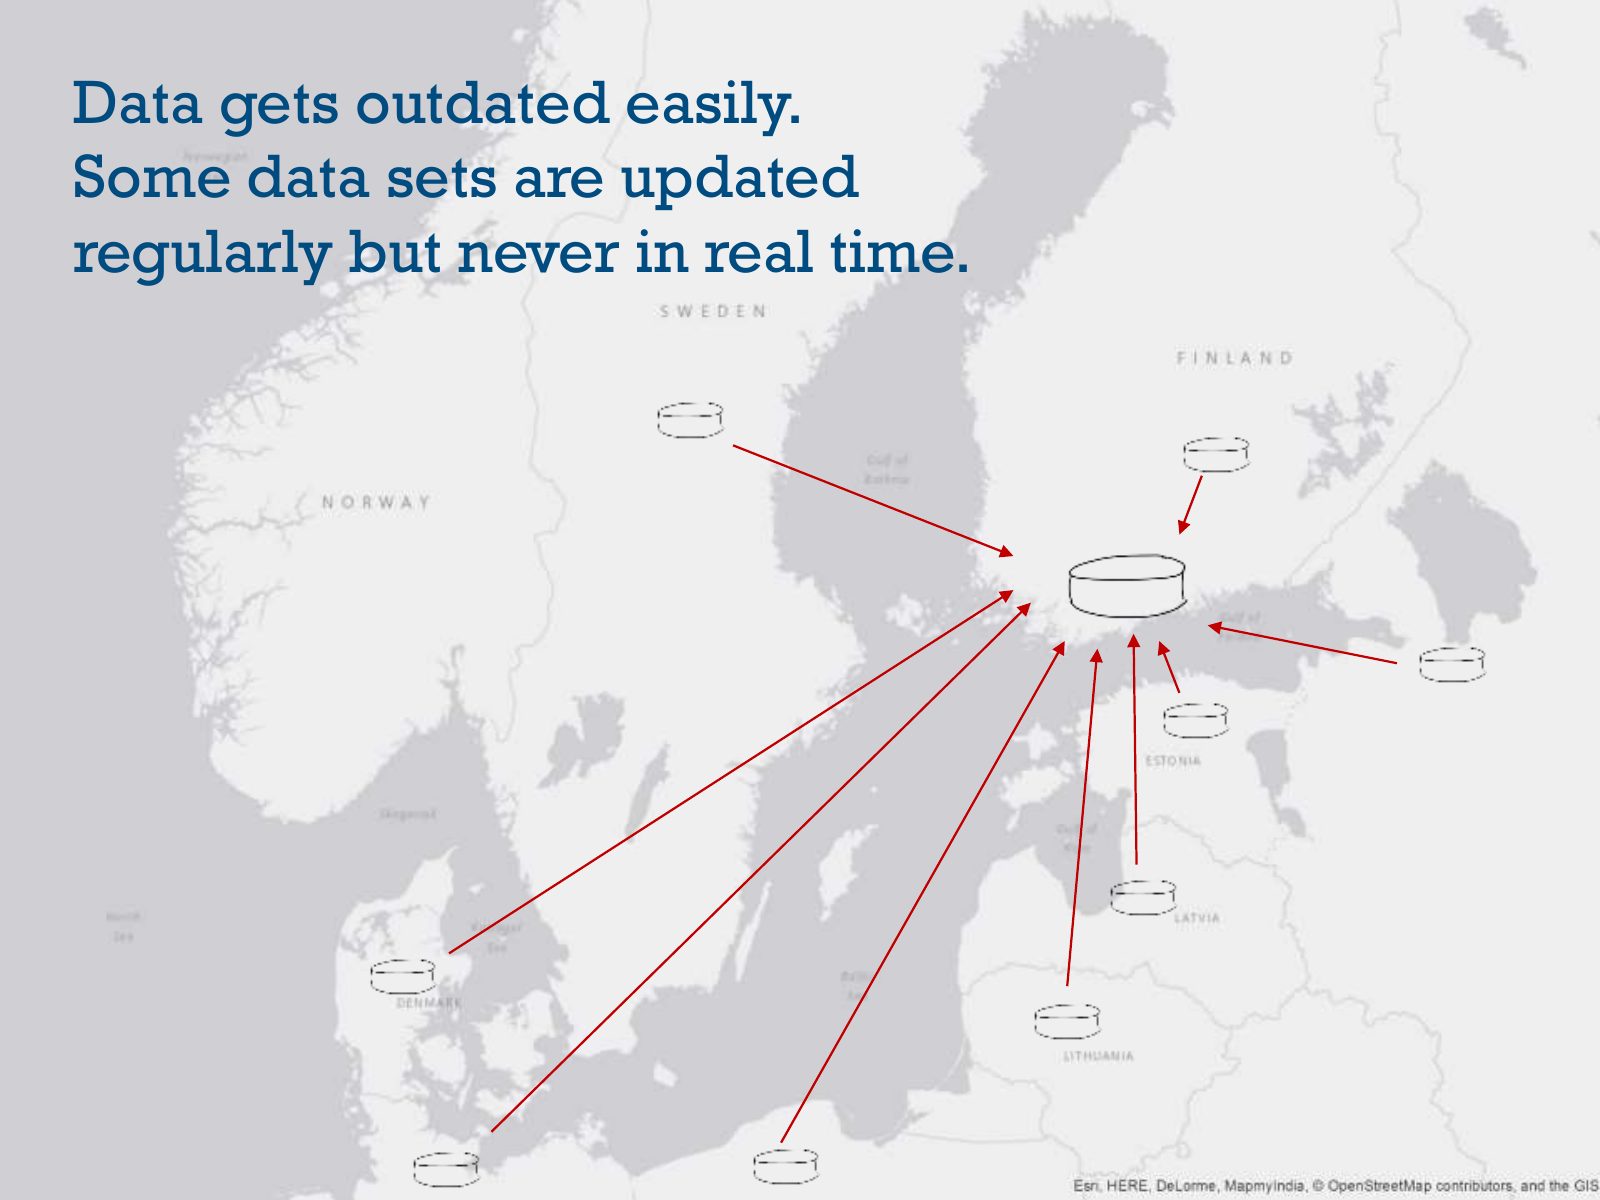
Slide 67 of 95: Data gets outdated easily. Some data sets are updated regularly but never in real time.
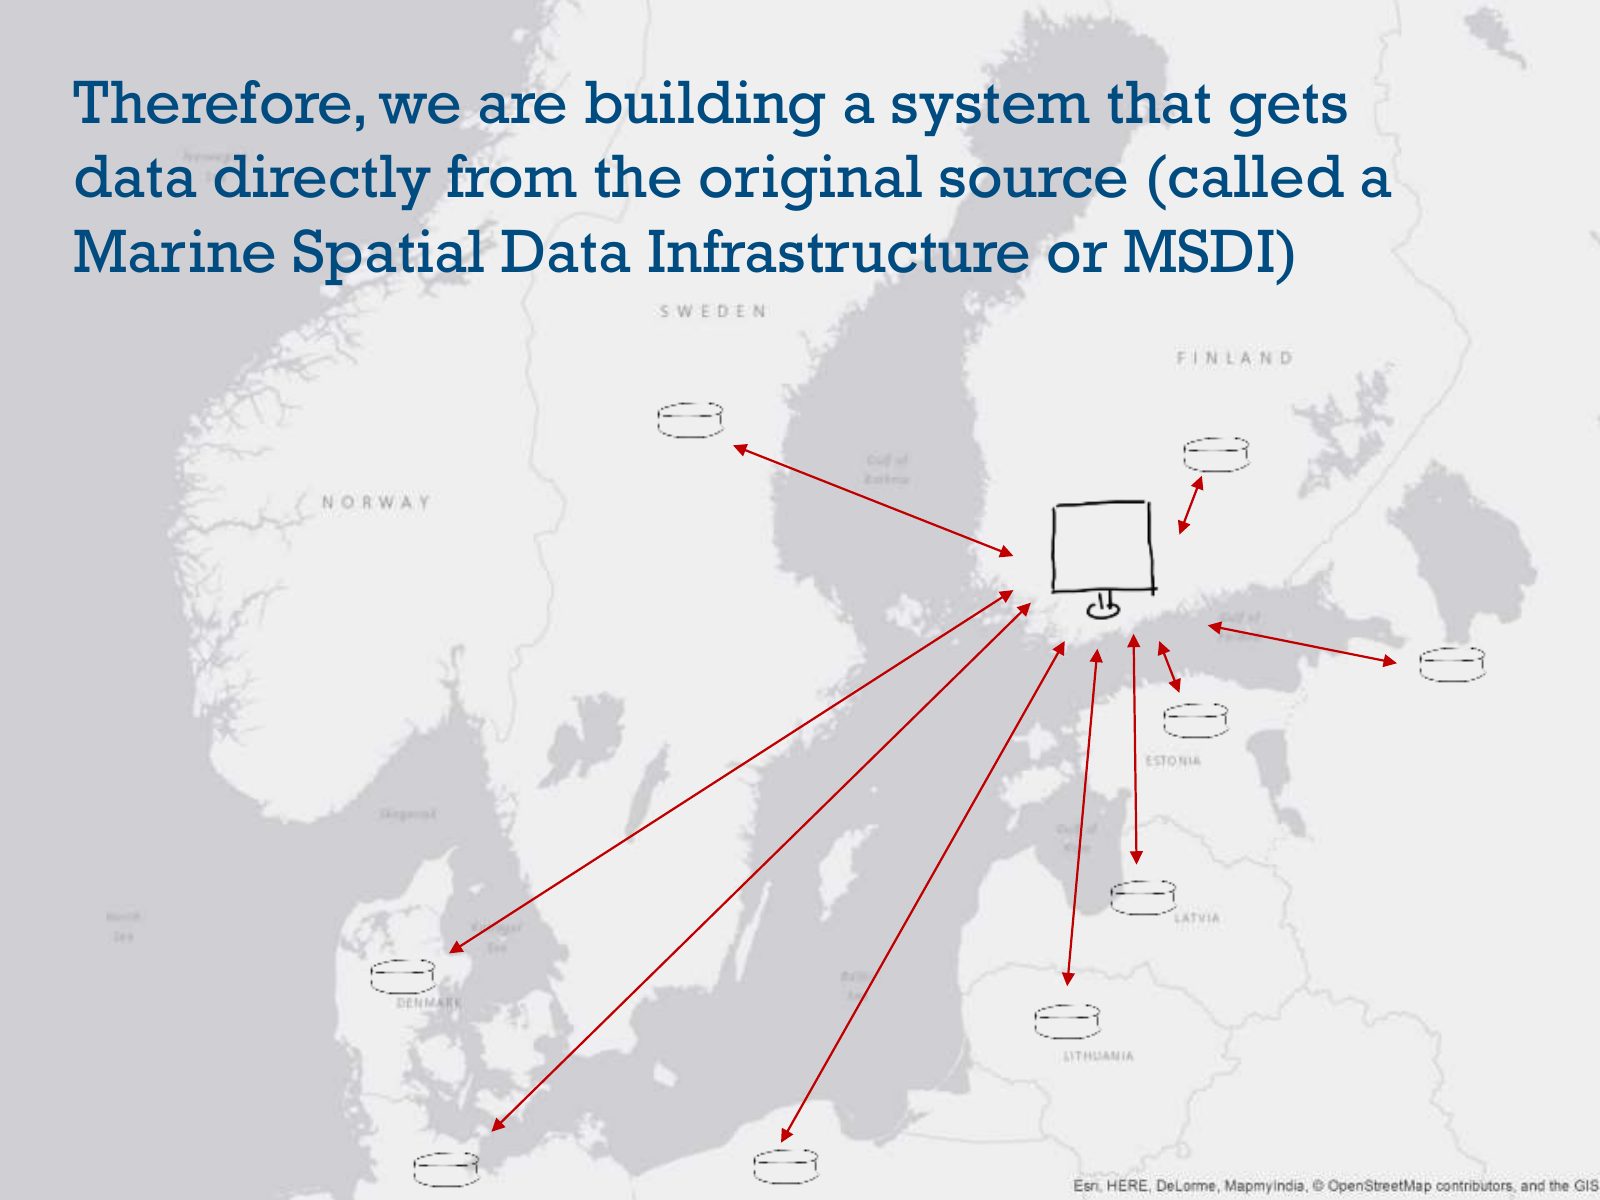
Slide 68 of 95: Therefore, we are building a system that gets data directly from the original source (called a Marine Spatial Data Infrastructure or MSDI)
Slide 69 of 95: This won’t happen tomorrow and it won’t work for all data though.
Slide 70 of 95: Good. Now we are wiser than 70 slides ago.
Slide 71 of 95: Yes! We learned that the Baltic Sea is fragile and it was getting sick…
Slide 72 of 95: …that the Helsinki Convention was signed to avoid an environmental catastrophe…
Slide 73 of 95: …and we saw how much GIS is helping to avoid that catastrophe
Slide 74 of 95: But what is the situation in the Baltic Sea NOW?
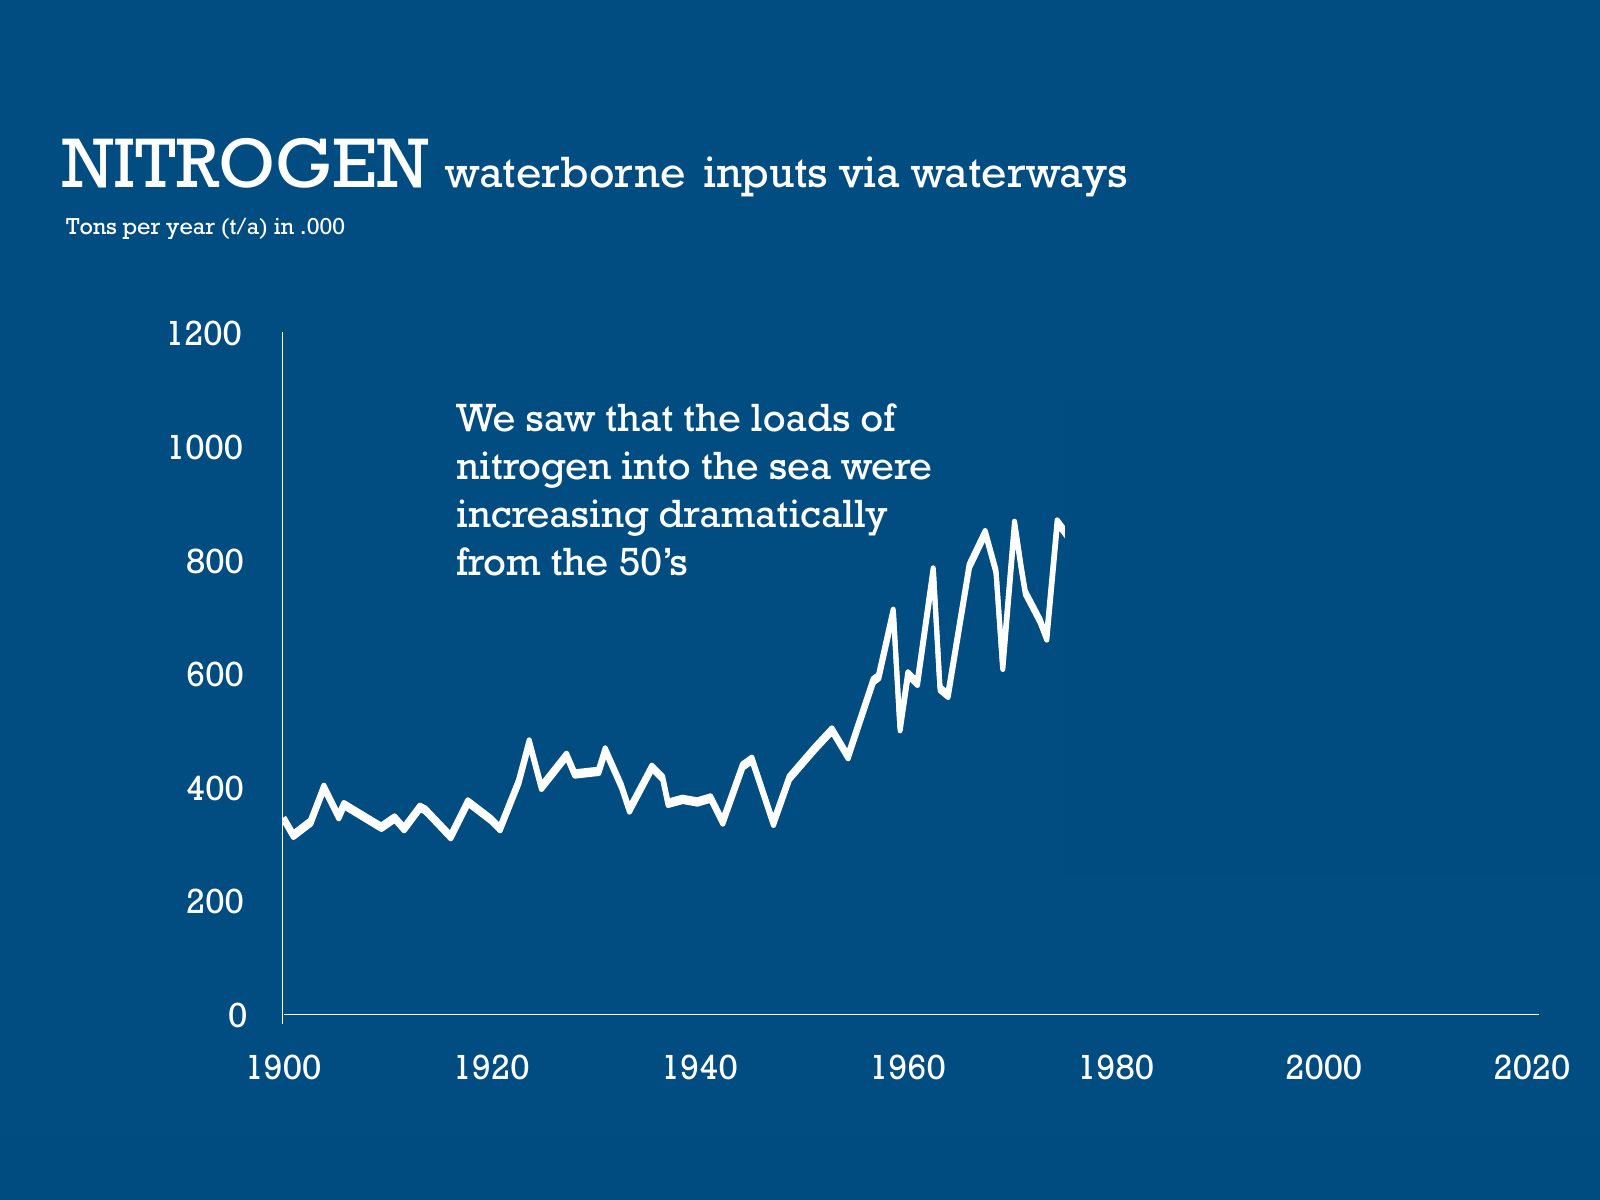
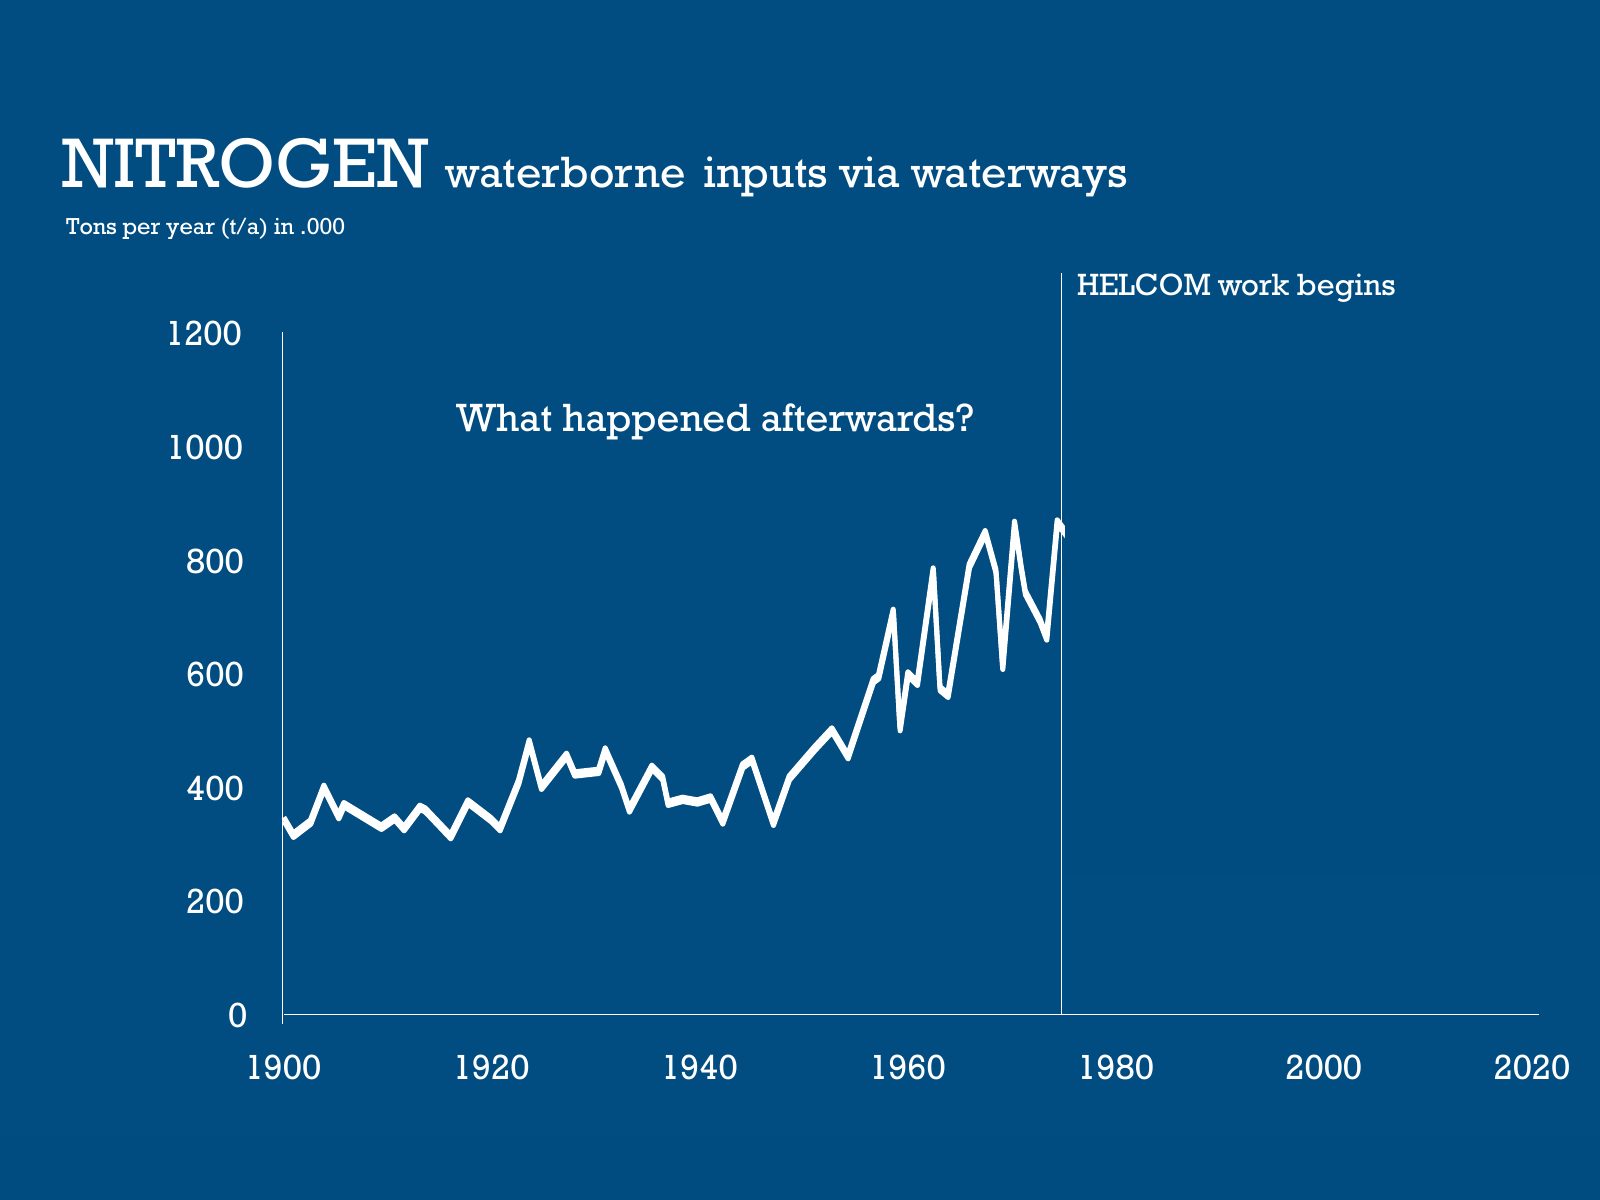
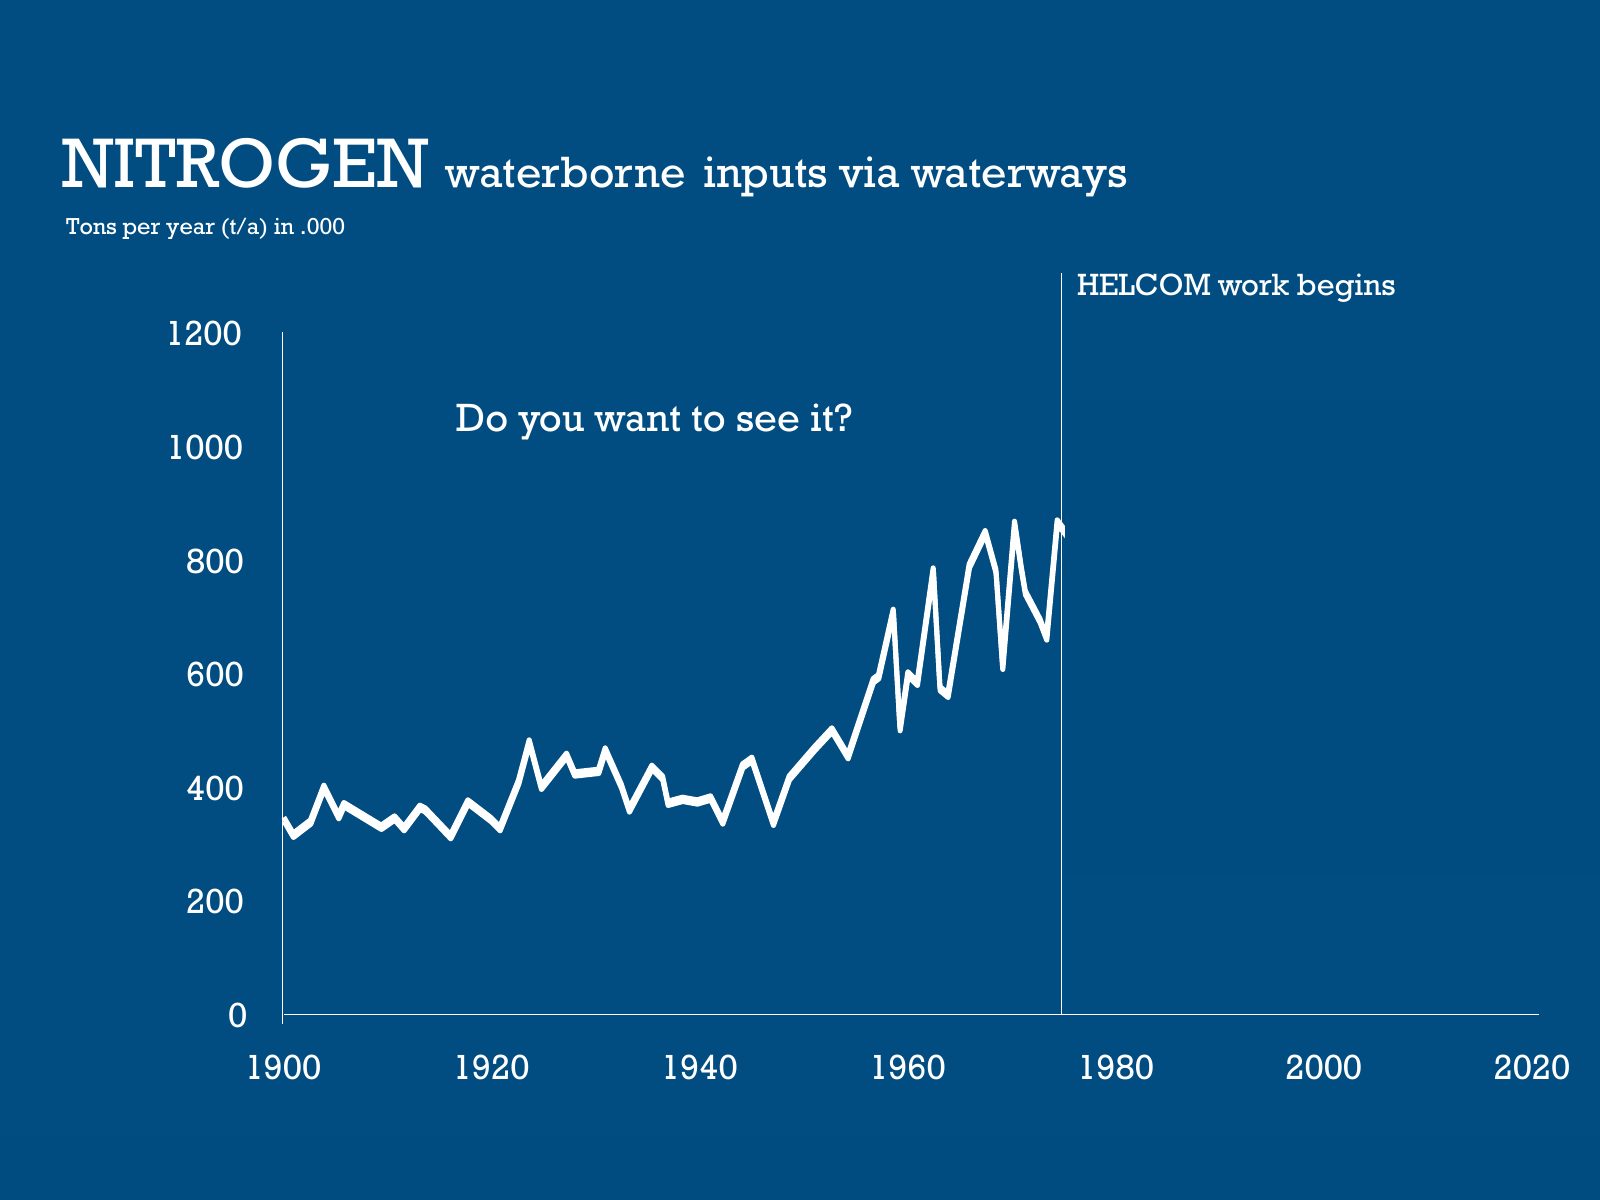
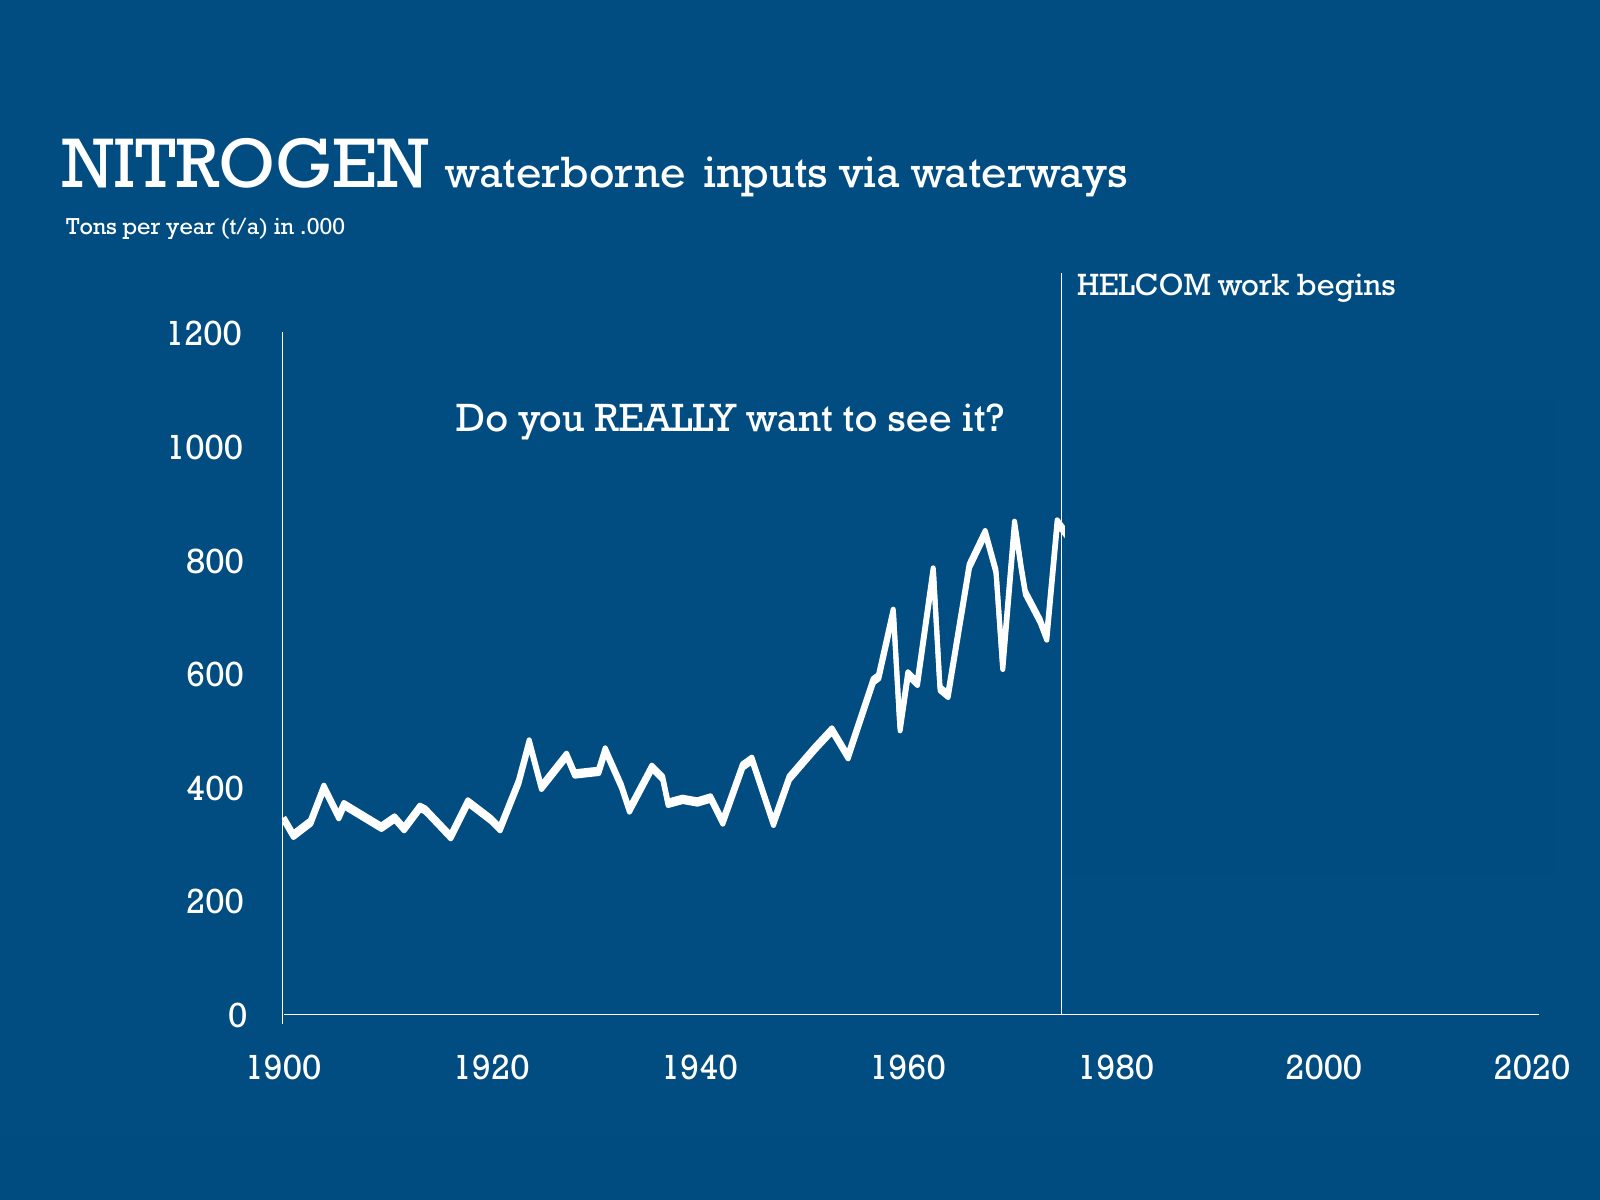
Slide 75 of 95: NITROGEN waterborne inputs via waterways Tons per year (t/a) in .000 1200 We saw that the loads of 1000 nitrogen into the sea were increasing dramatically 80…
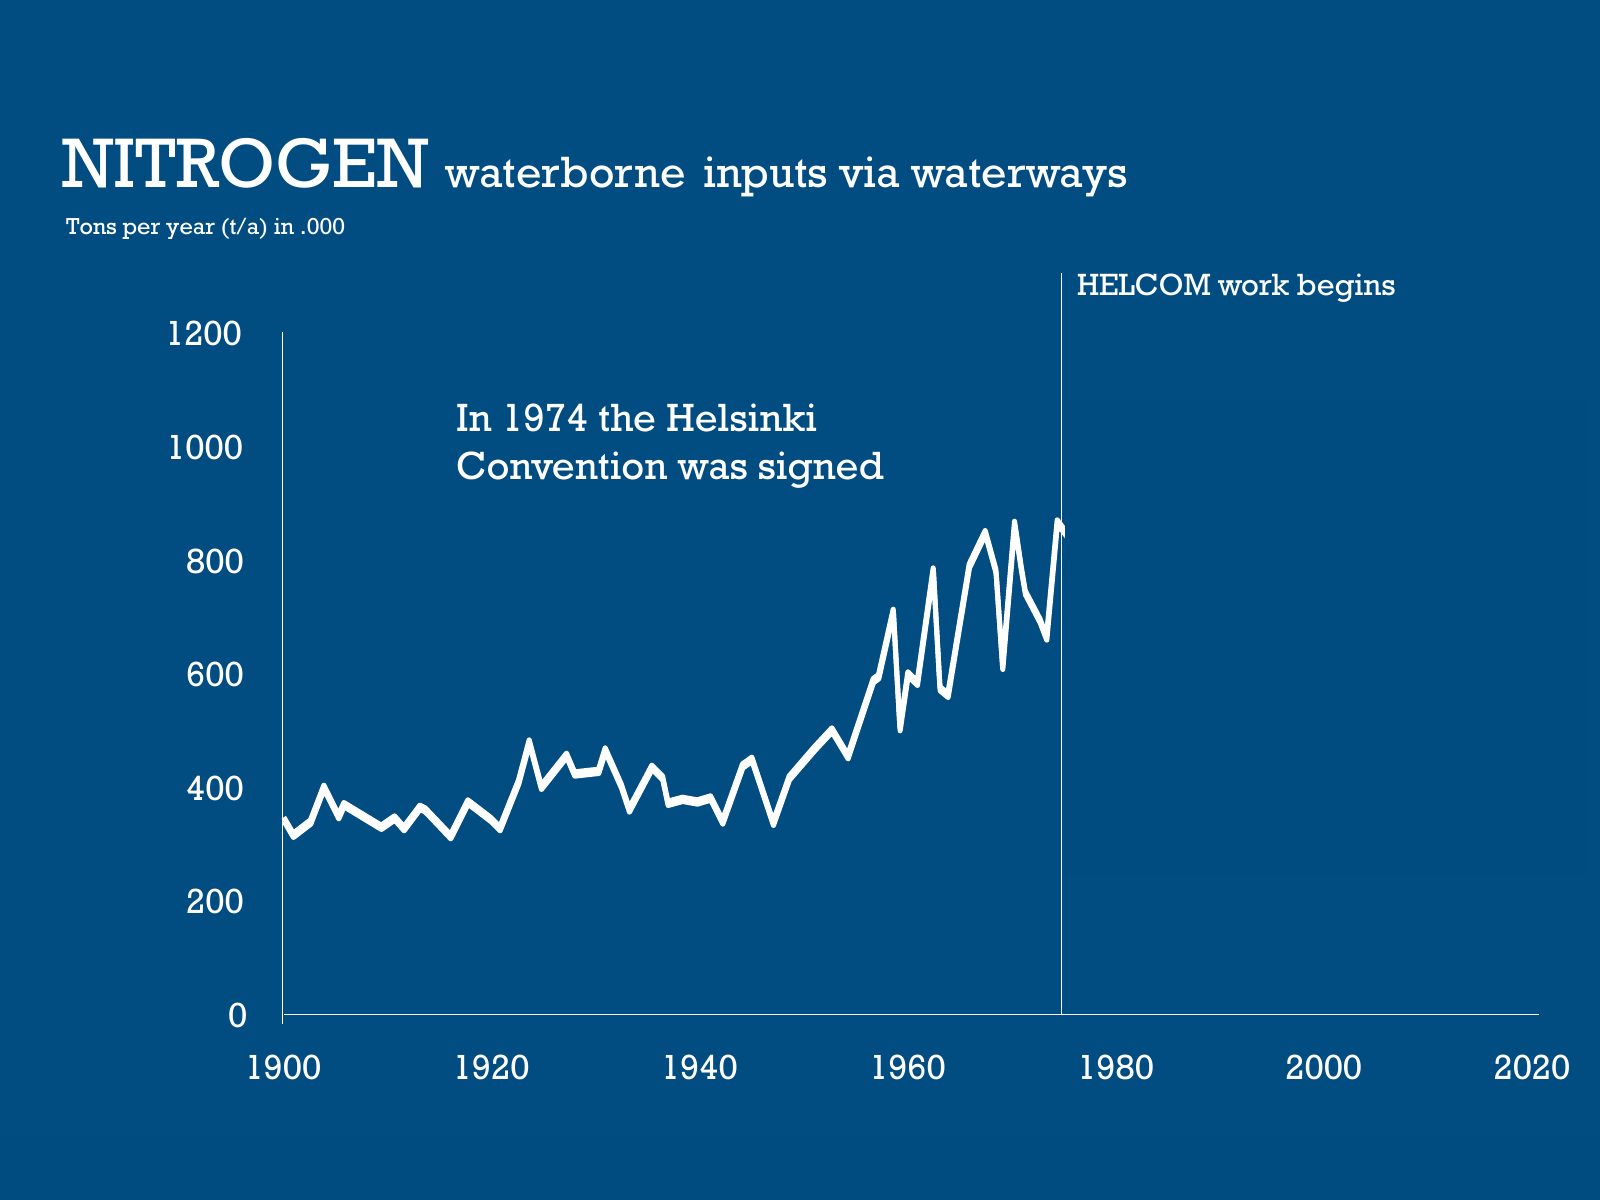
Slide 76 of 95: NITROGEN waterborne inputs via waterways Tons per year (t/a) in .000 HELCOM work begins 1200 In 1974 the Helsinki 1000 Convention was signed 800 600 400 200…
Slide 77 of 95: NITROGEN waterborne inputs via waterways Tons per year (t/a) in .000 HELCOM work begins 1200 What happened afterwards? 1000 800 600 400 200 0 1900 1920 1940…
Slide 78 of 95: NITROGEN waterborne inputs via waterways Tons per year (t/a) in .000 HELCOM work begins 1200 Do you want to see it? 1000 800 600 400 200 0 1900 1920 1940 196…
Slide 79 of 95: NITROGEN waterborne inputs via waterways Tons per year (t/a) in .000 HELCOM work begins 1200 Do you REALLY want to see it? 1000 800 600 400 200 0 1900 1920 1…
Slide 80 of 95: NITROGEN waterborne inputs via waterways Tons per year (t/a) in .000 HELCOM work begins 1200 Yes! After HELCOM started its 1000 activities the nitrogen loads…
Slide 81 of 95: PHOSPHORUS waterborne inputs via waterways Tons per year (t/a) in .000 HELCOM work begins 80 And what happened with 70 the phophorus loads? 60 50 40 30 20 10…
Slide 82 of 95: PHOSPHORUS waterborne inputs via waterways Tons per year (t/a) in .000 HELCOM work begins 80 Remember that excess of both 70 nitrogen and phosphorus contribu…
Slide 83 of 95: PHOSPHORUS waterborne inputs via waterways Tons per year (t/a) in .000 HELCOM work begins 80 Yes! The reduction of 70 phosphorus into the Baltic Sea decrease…
Slide 84 of 95: WATER CLARITY summer Secchi depth In meters HELCOM work begins 11 10 9 8 But what happened 7 with the water clarity? 6 1900 1920 1940 1960 1980 2000 2020
Slide 85 of 95: WATER CLARITY summer Secchi depth In meters HELCOM work begins 11 10 9 8 If there are less nitrogen and 7 phosphorus, in other words less polution, the water…
Slide 86 of 95: WATER CLARITY summer Secchi depth In meters HELCOM work begins 11 10 9 8 7 WRONG! Nitrogen, phosphorus and other contaminants are decreasing but this reducti…
Slide 87 of 95: In this report you can see that there is really a lot to do still. The state of the Baltic Sea can be summarized in 3 messages http://stateofthebalticsea.hel…
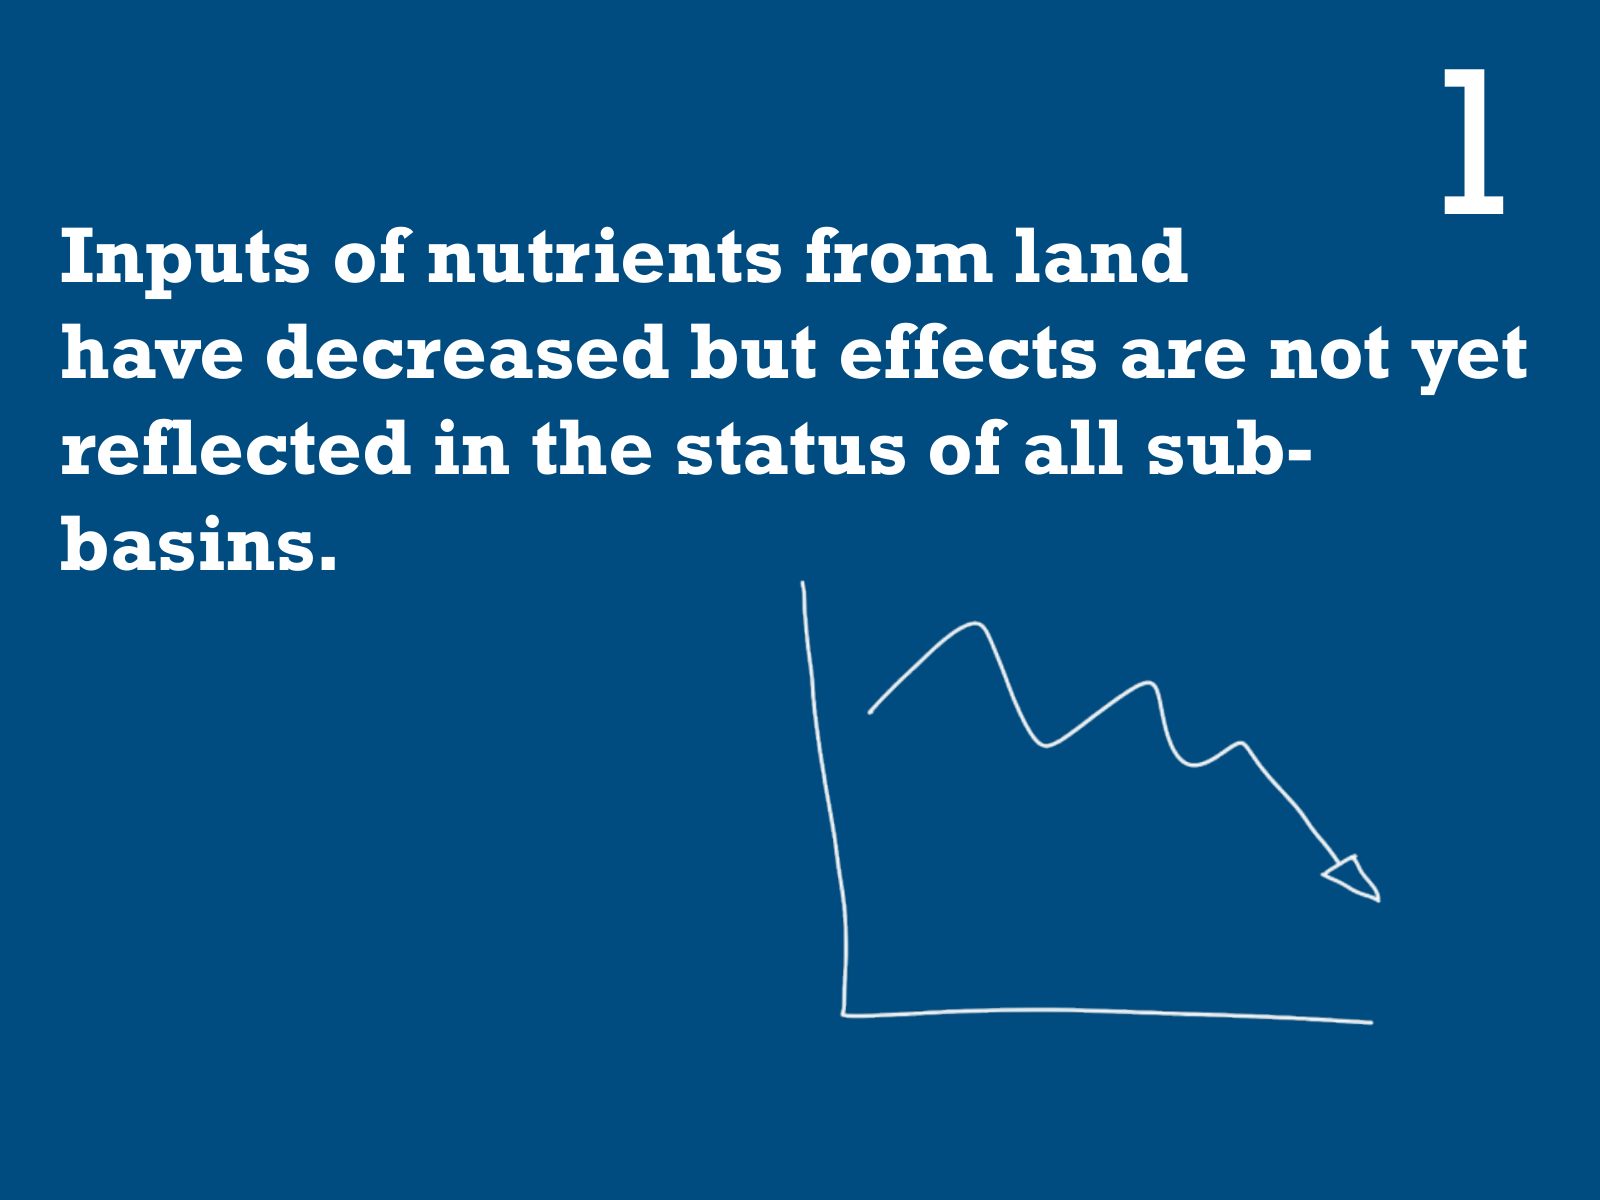
Slide 88 of 95: Inputs of nutrients from land 1 have decreased but effects are not yet reflected in the status of all sub- basins.
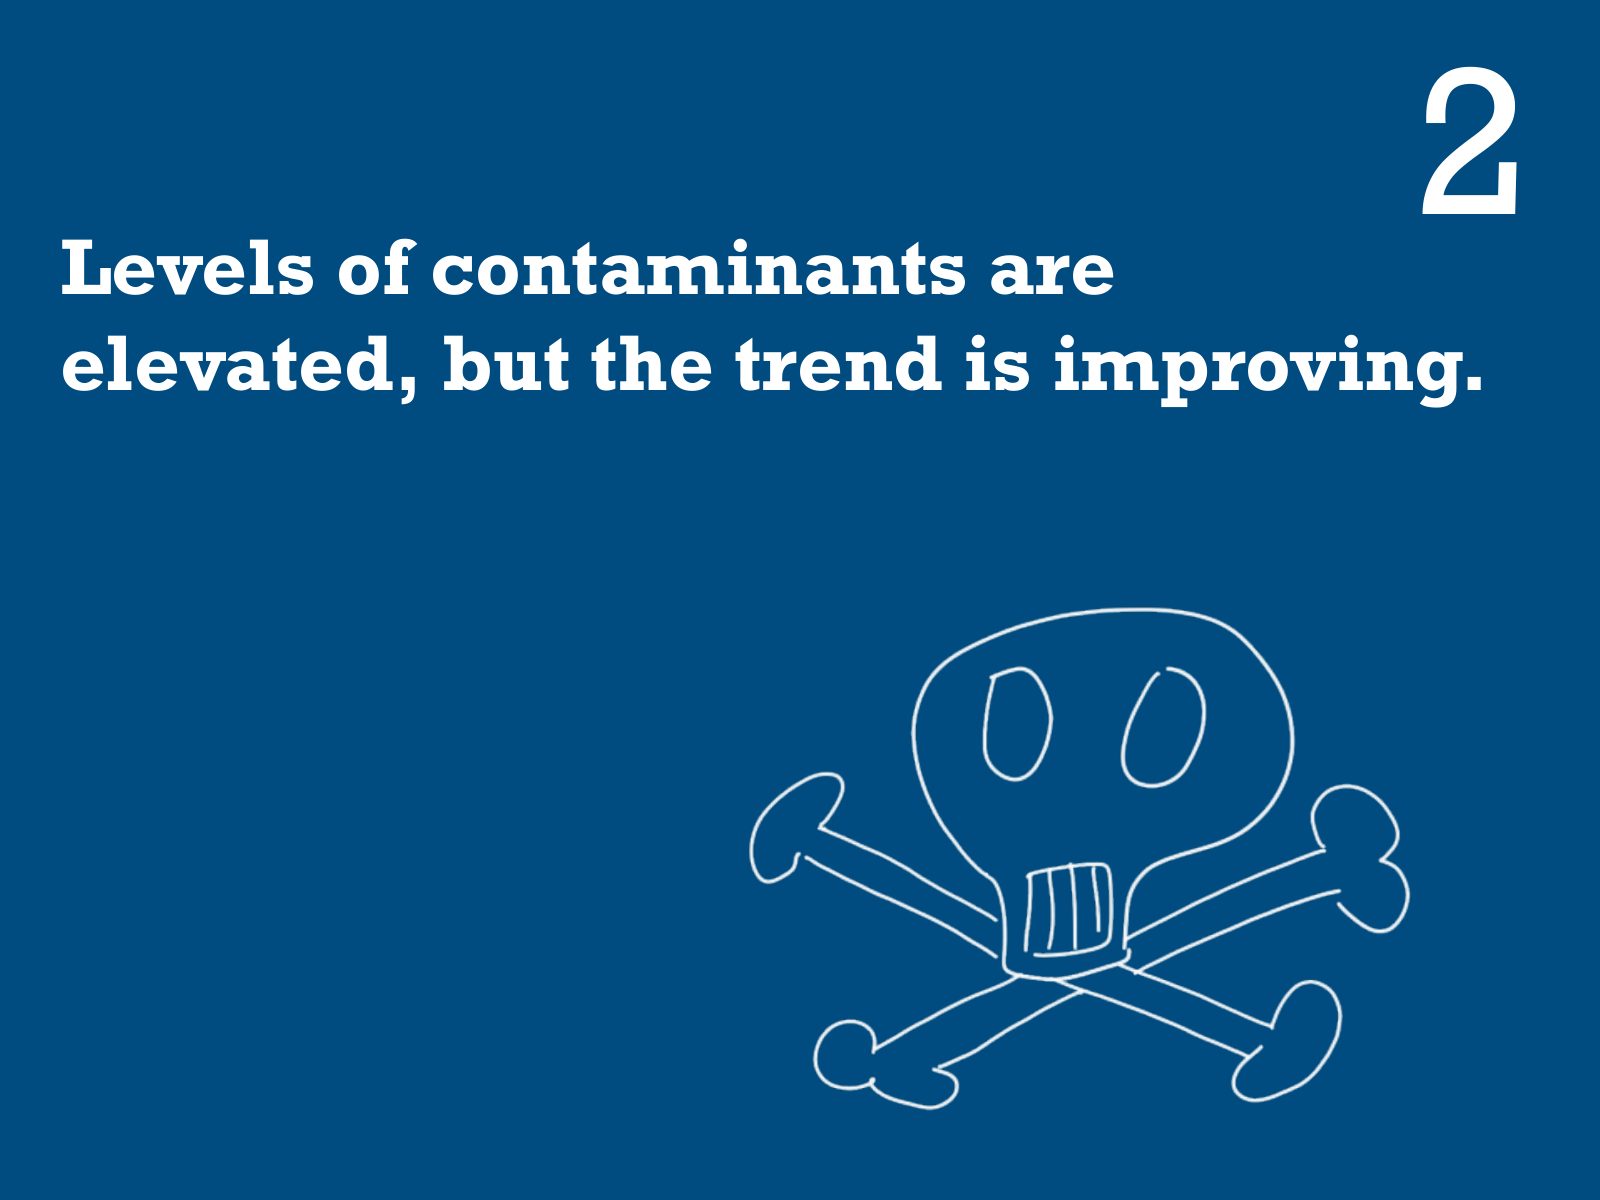
Slide 89 of 95: Levels of contaminants are 2 elevated, but the trend is improving.
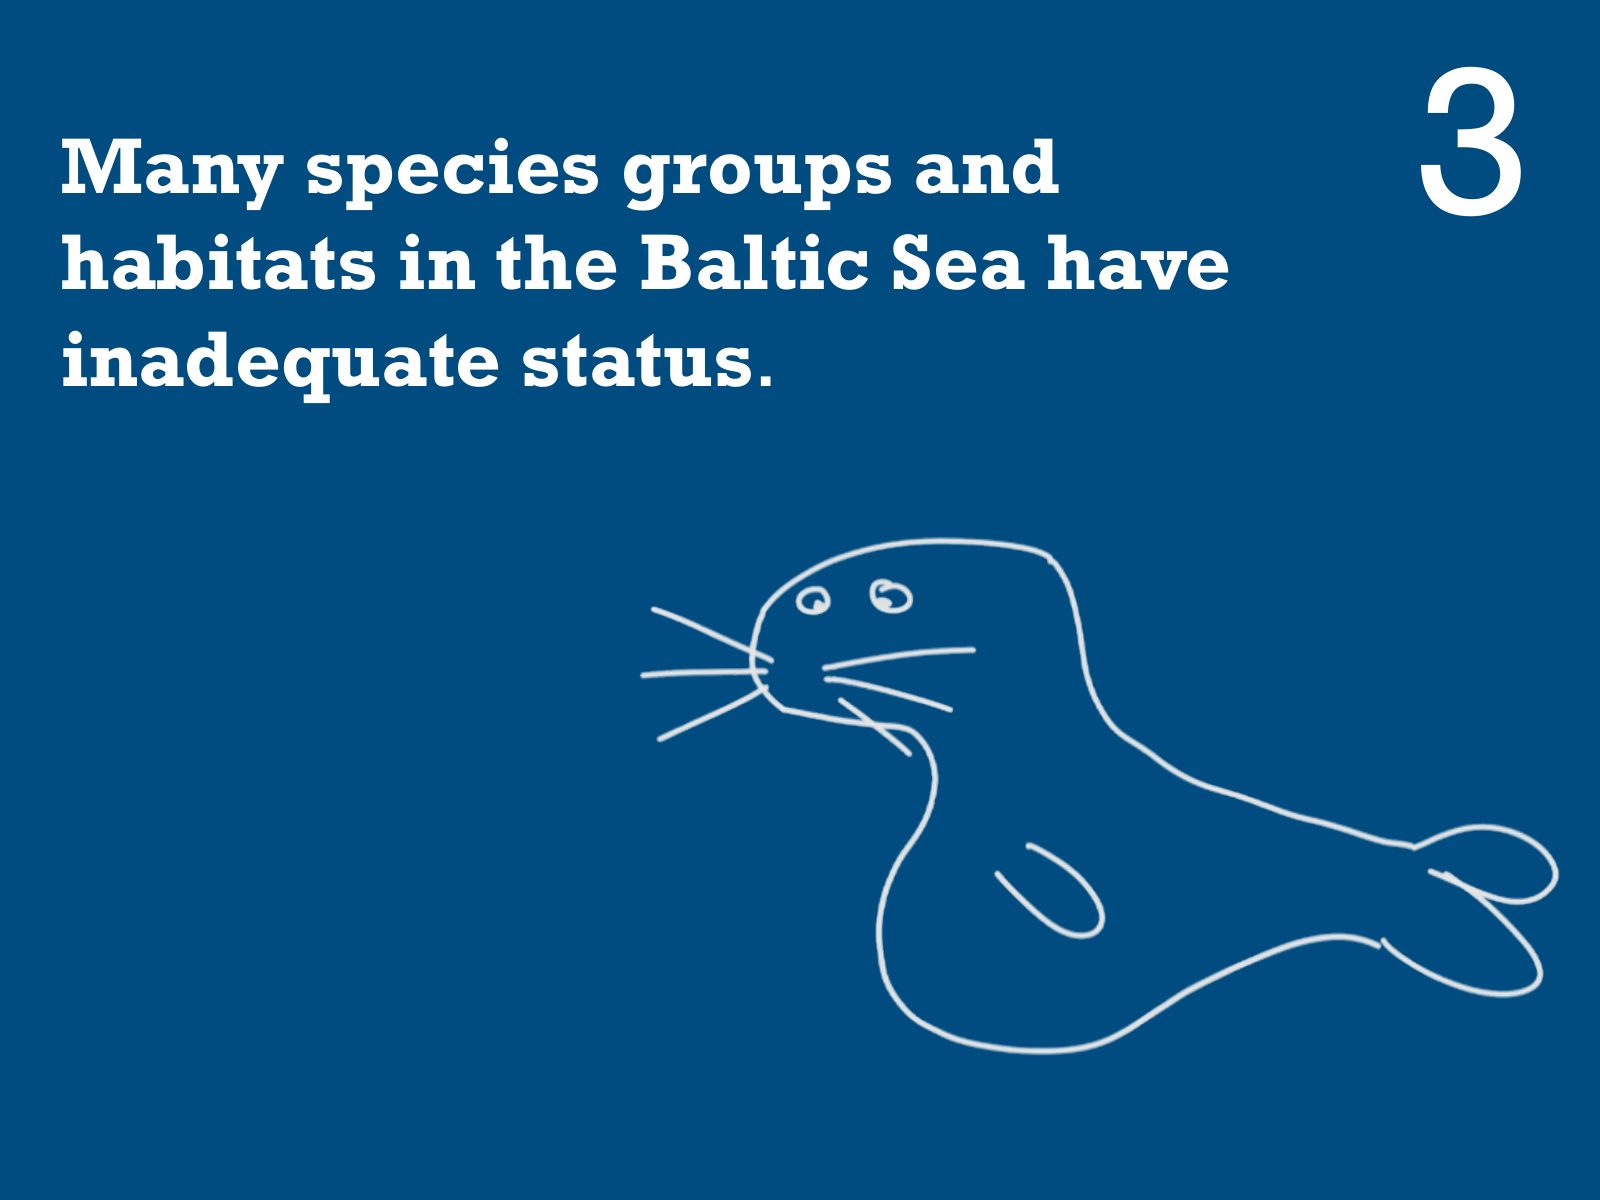
Slide 90 of 95: Many species groups and habitats in the Baltic Sea have 3 inadequate status.
Slide 91 of 95: And the main message is that progress has been made
Slide 92 of 95: And the main message is that progress has been made but
Slide 93 of 95: And the main message is that progress has been made but there is still a lot of work to do
Slide 94 of 95: That’s all folks! Hope you enjoyed!
Slide 95 of 95: picture slide without text
1 / 95
Swipe, use the arrows or the keyboard arrow keys. Download the slides (PDF, 2.1 MB)

← All stories