The HELCOM Maritime Assessment: how to visualize complex problems so that everybody understands

2019 · 75 slides · Data viz & presentation

A geographer and a biologist show how they tried to make complex Baltic Sea issues understandable through visualization.
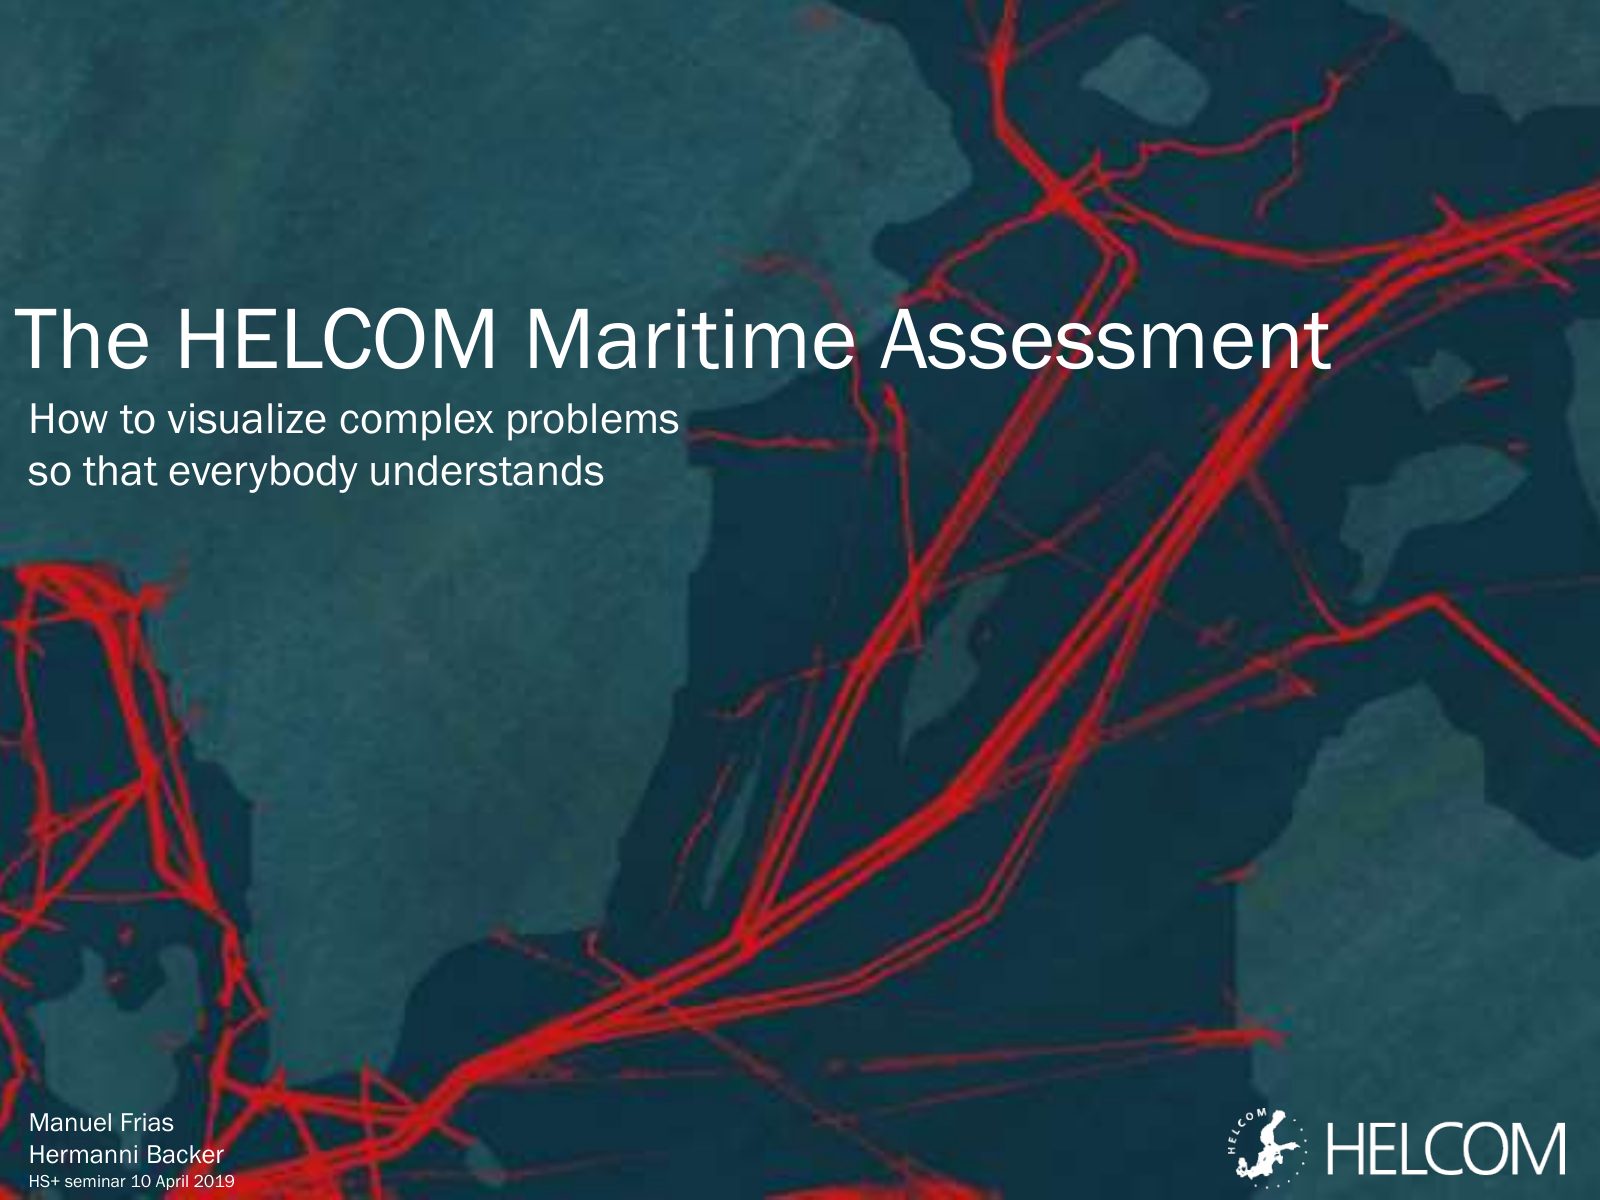
Slide 1 of 75: The HELCOM Maritime Assessment How to visualize complex problems so that everybody understands Manuel Frias Hermanni Backer HS+ seminar 10 April 2019
Slide 2 of 75: Hello, I am a geographer with no formal education in visual design
Slide 3 of 75: I am a biologist. I don't have any formal training in design or data visualization either. But we have something in common
Slide 4 of 75: We are interested in visualizing data so that as many as possible can understand
Slide 5 of 75: We are going to show you our attempt to make understandable complex issues in the Baltic Sea. We’ll put the report Maritime Assessment as an example
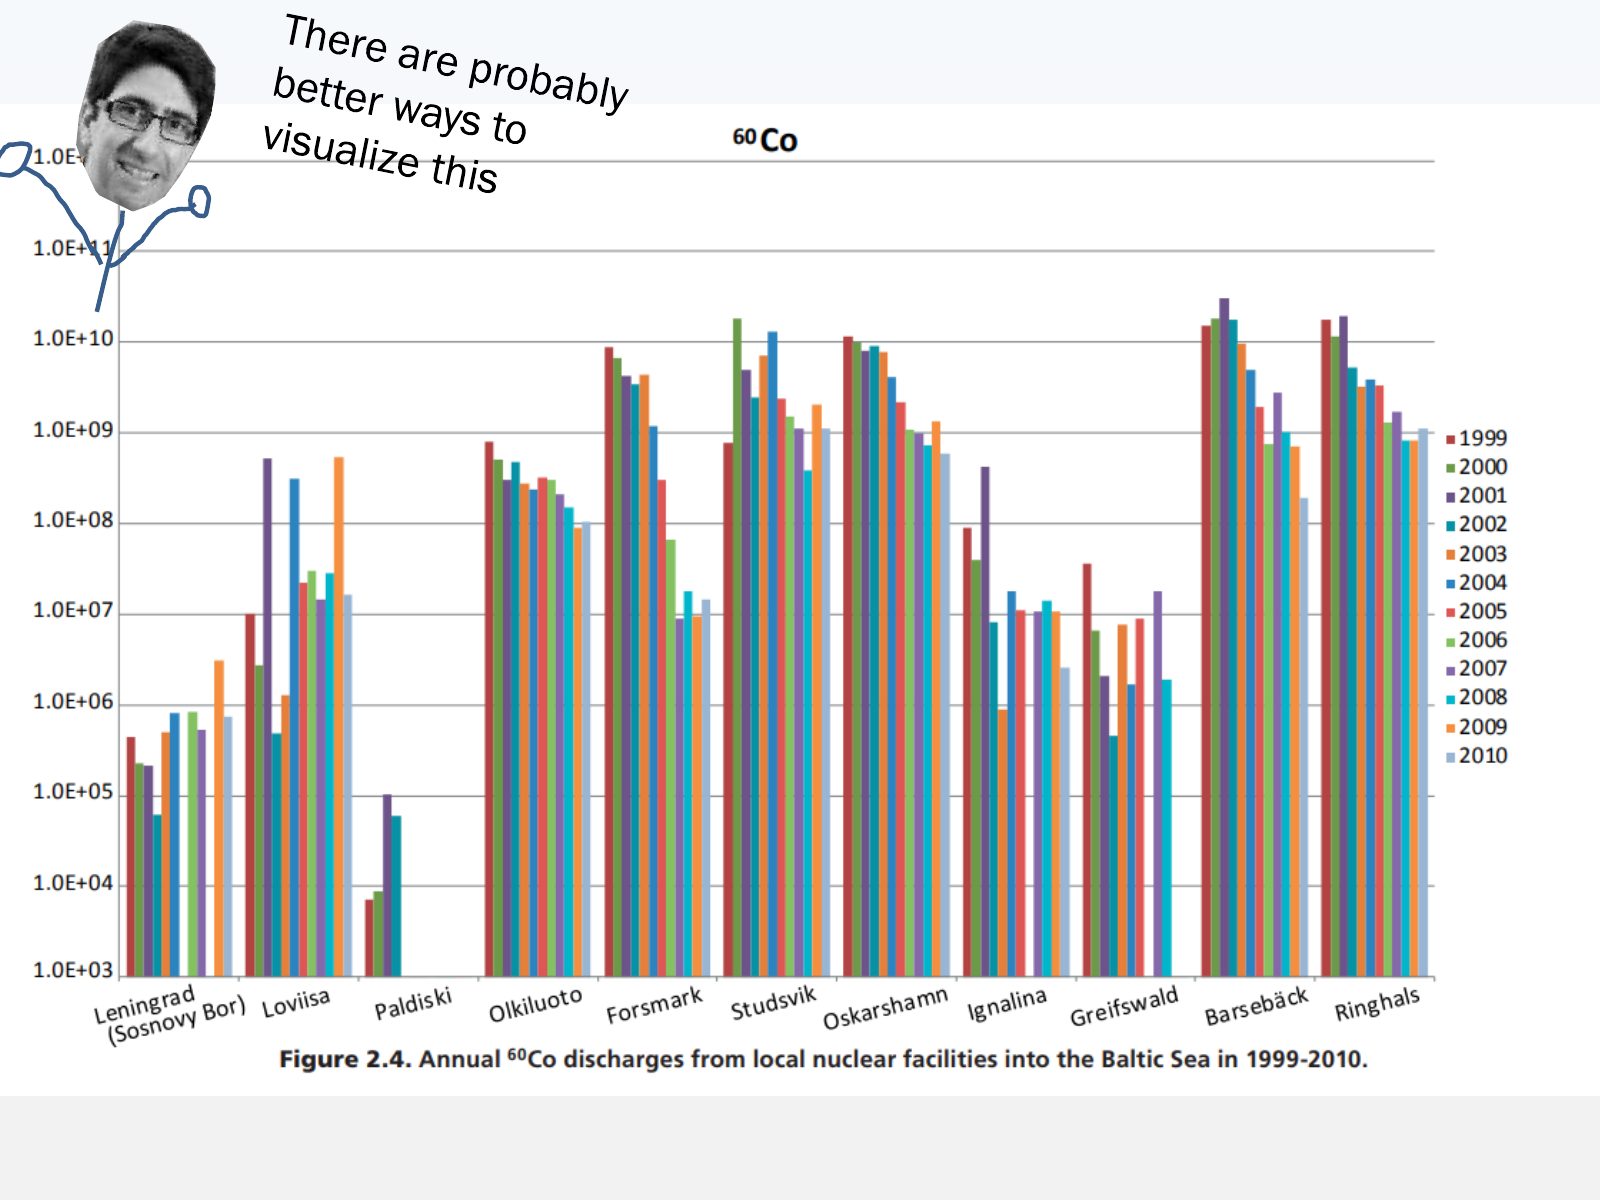
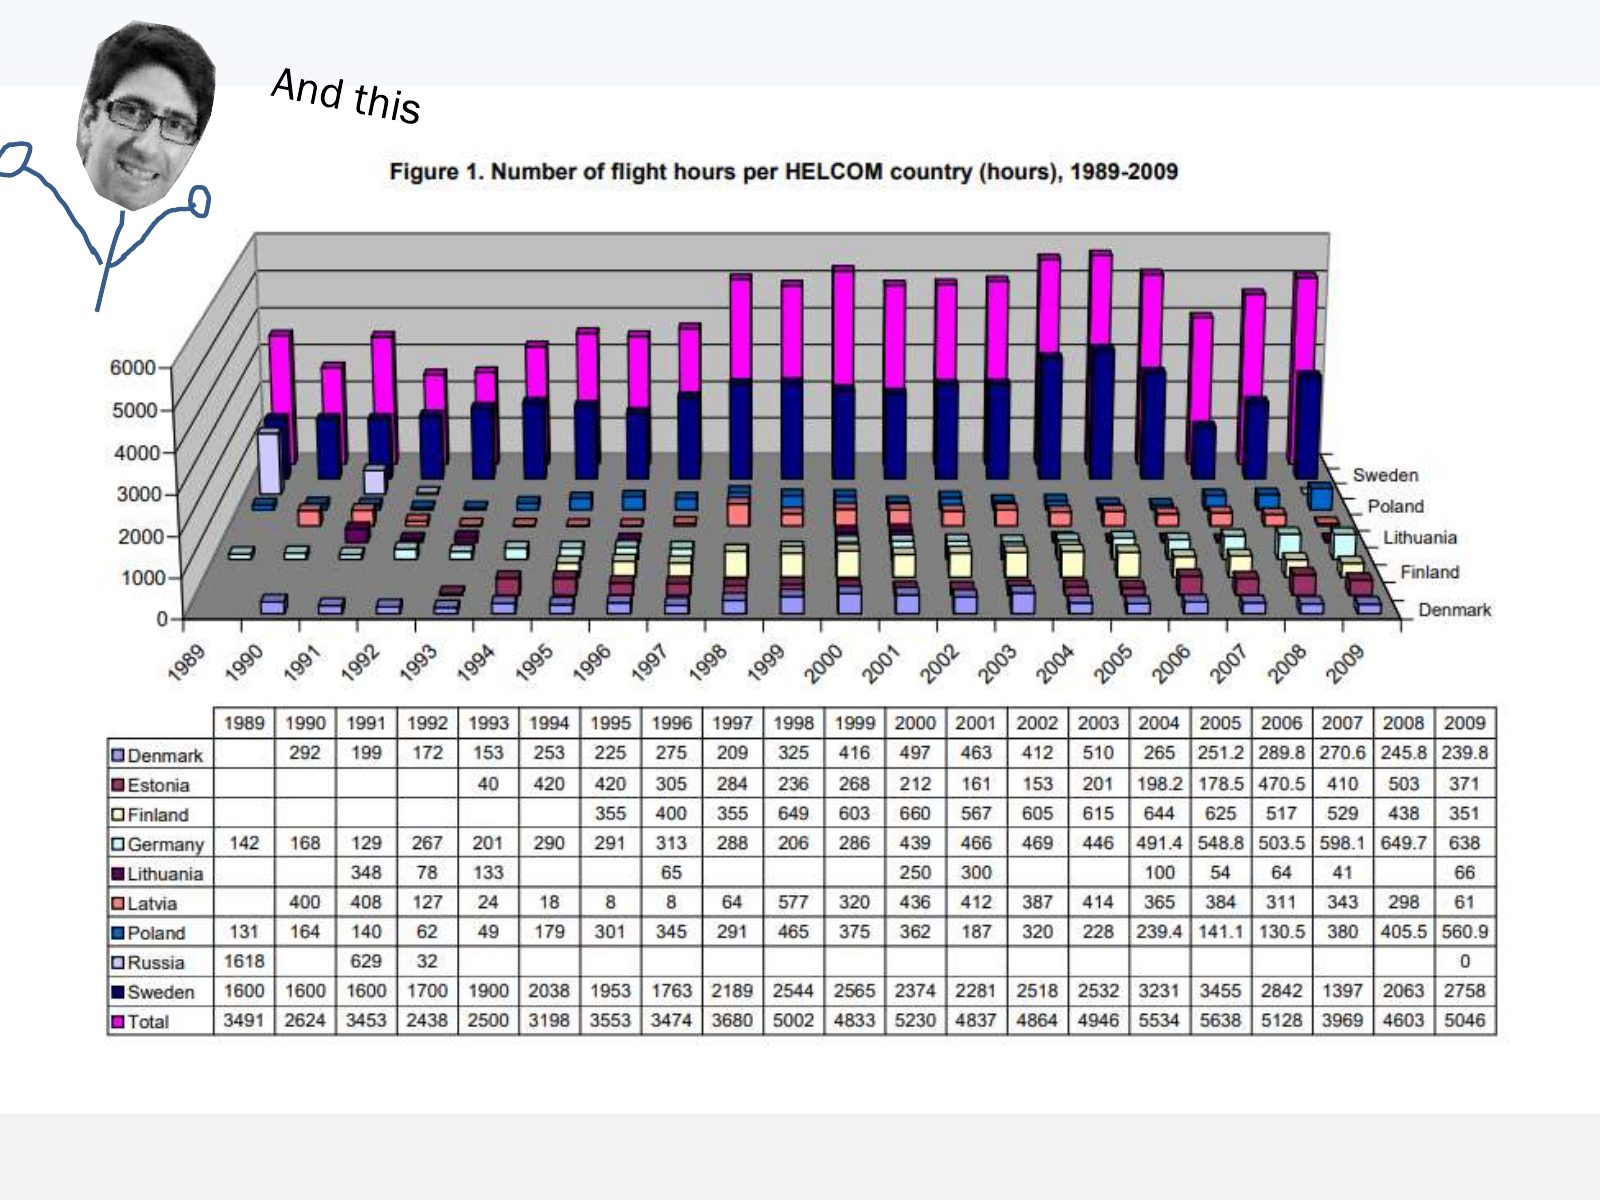
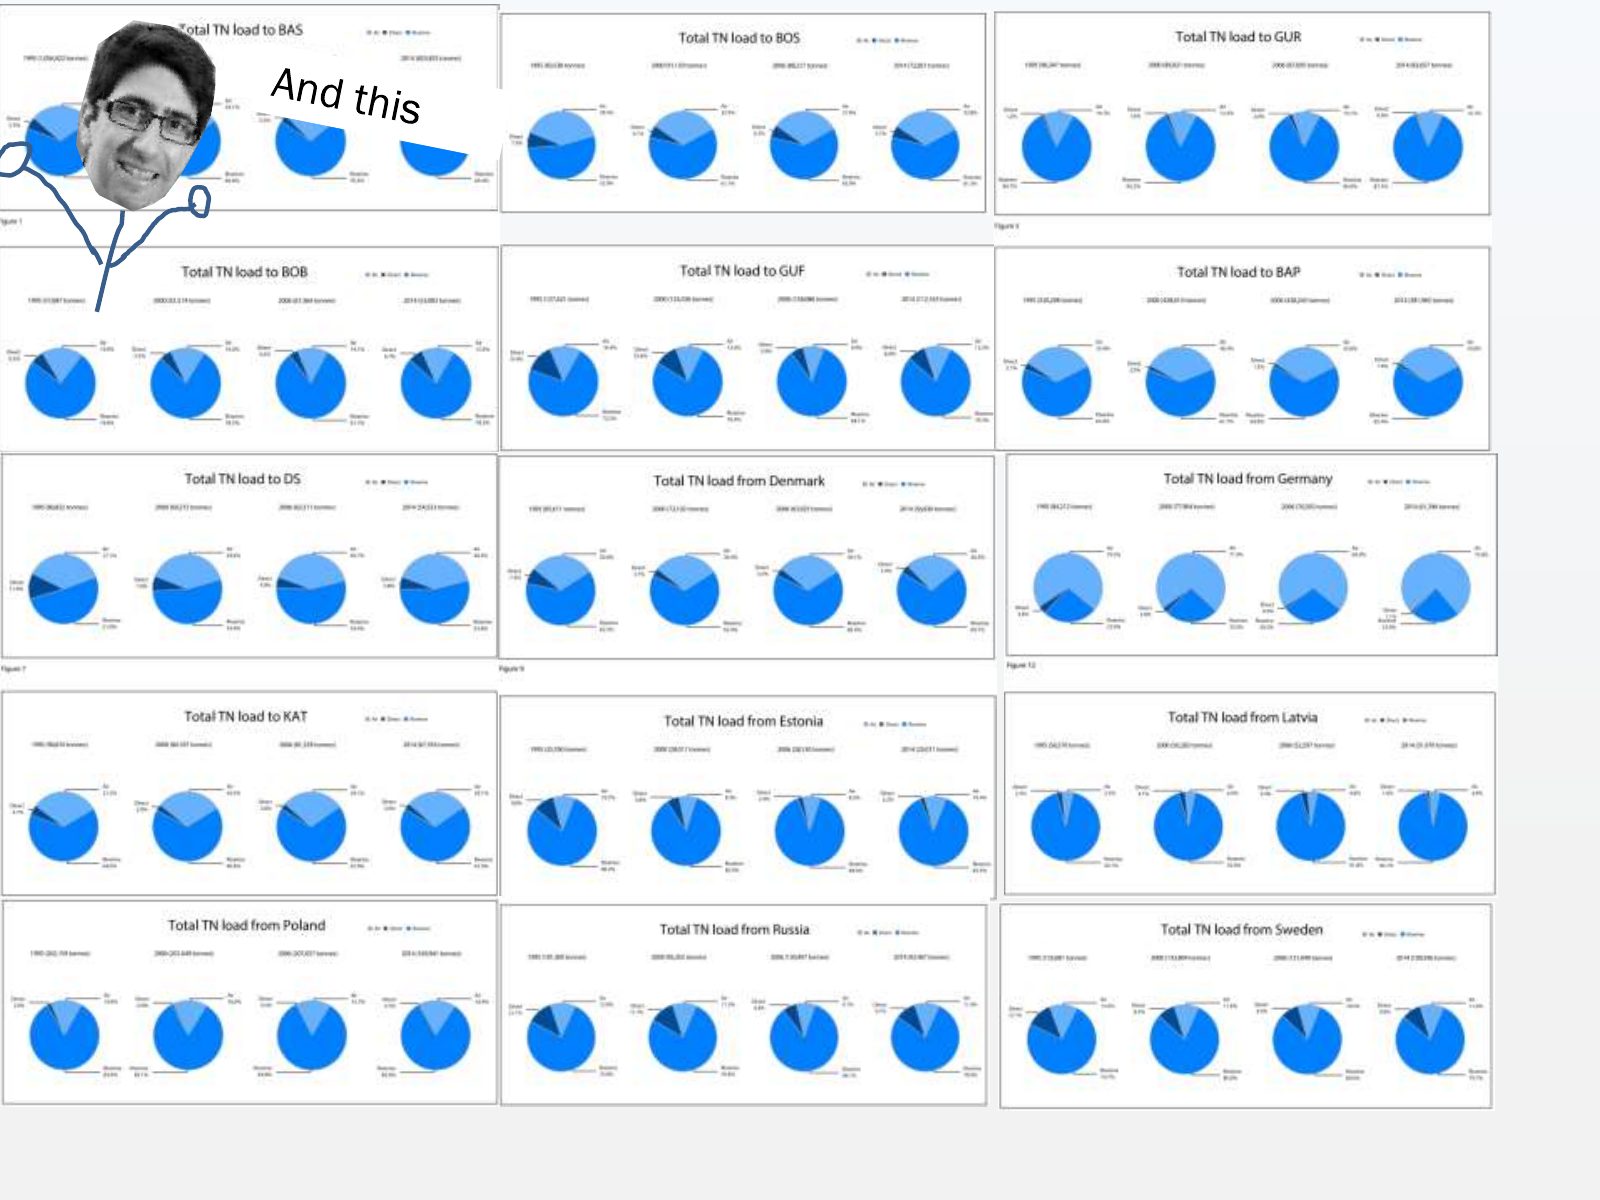
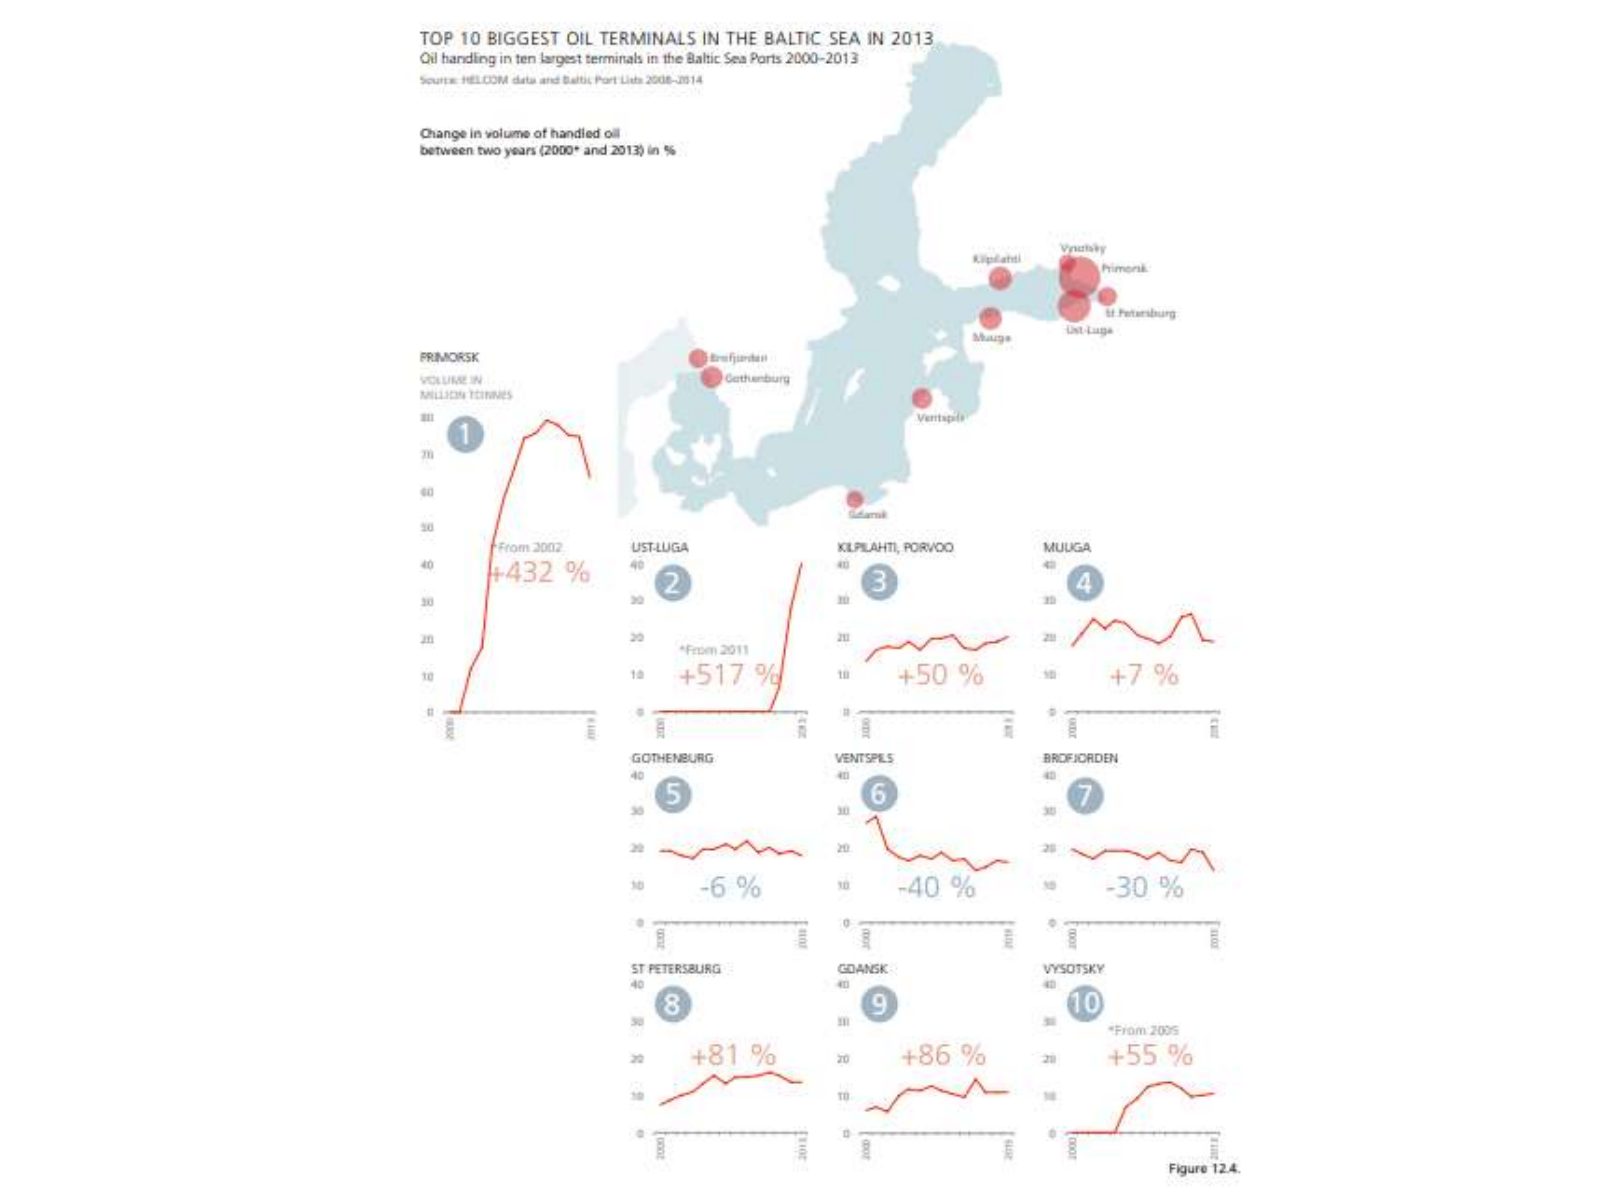
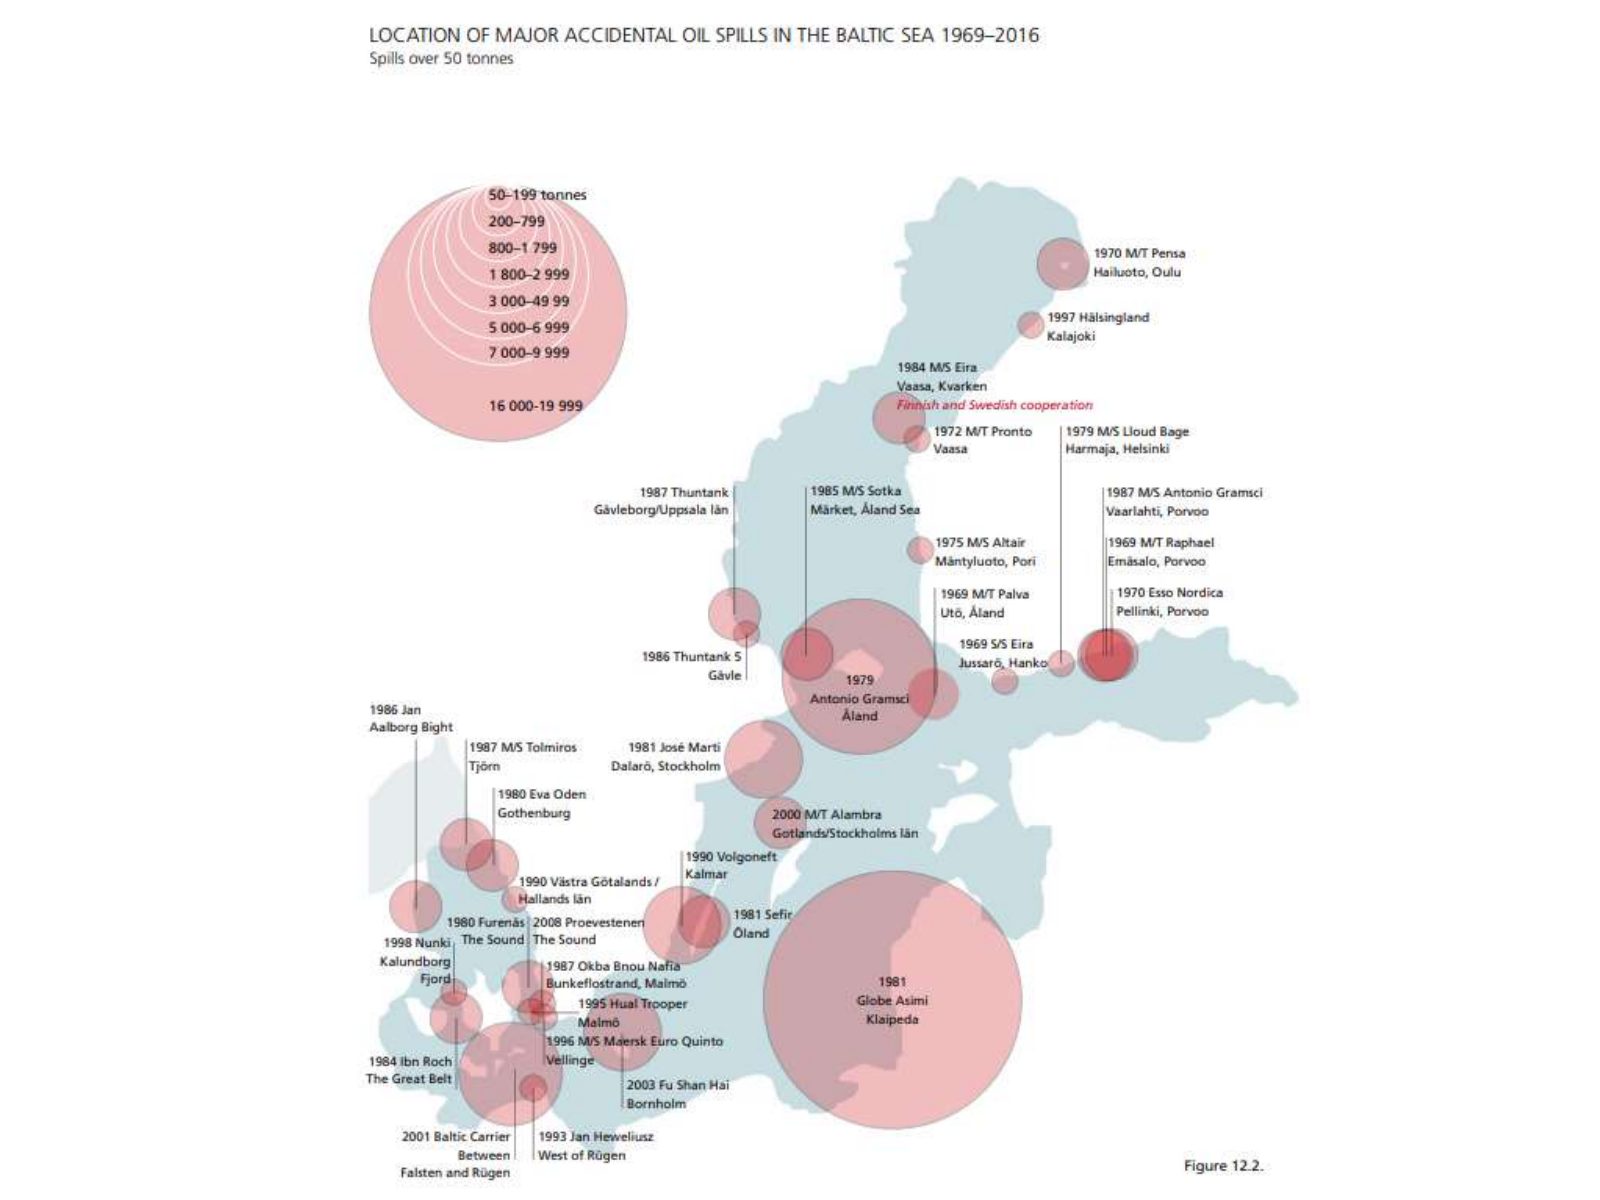
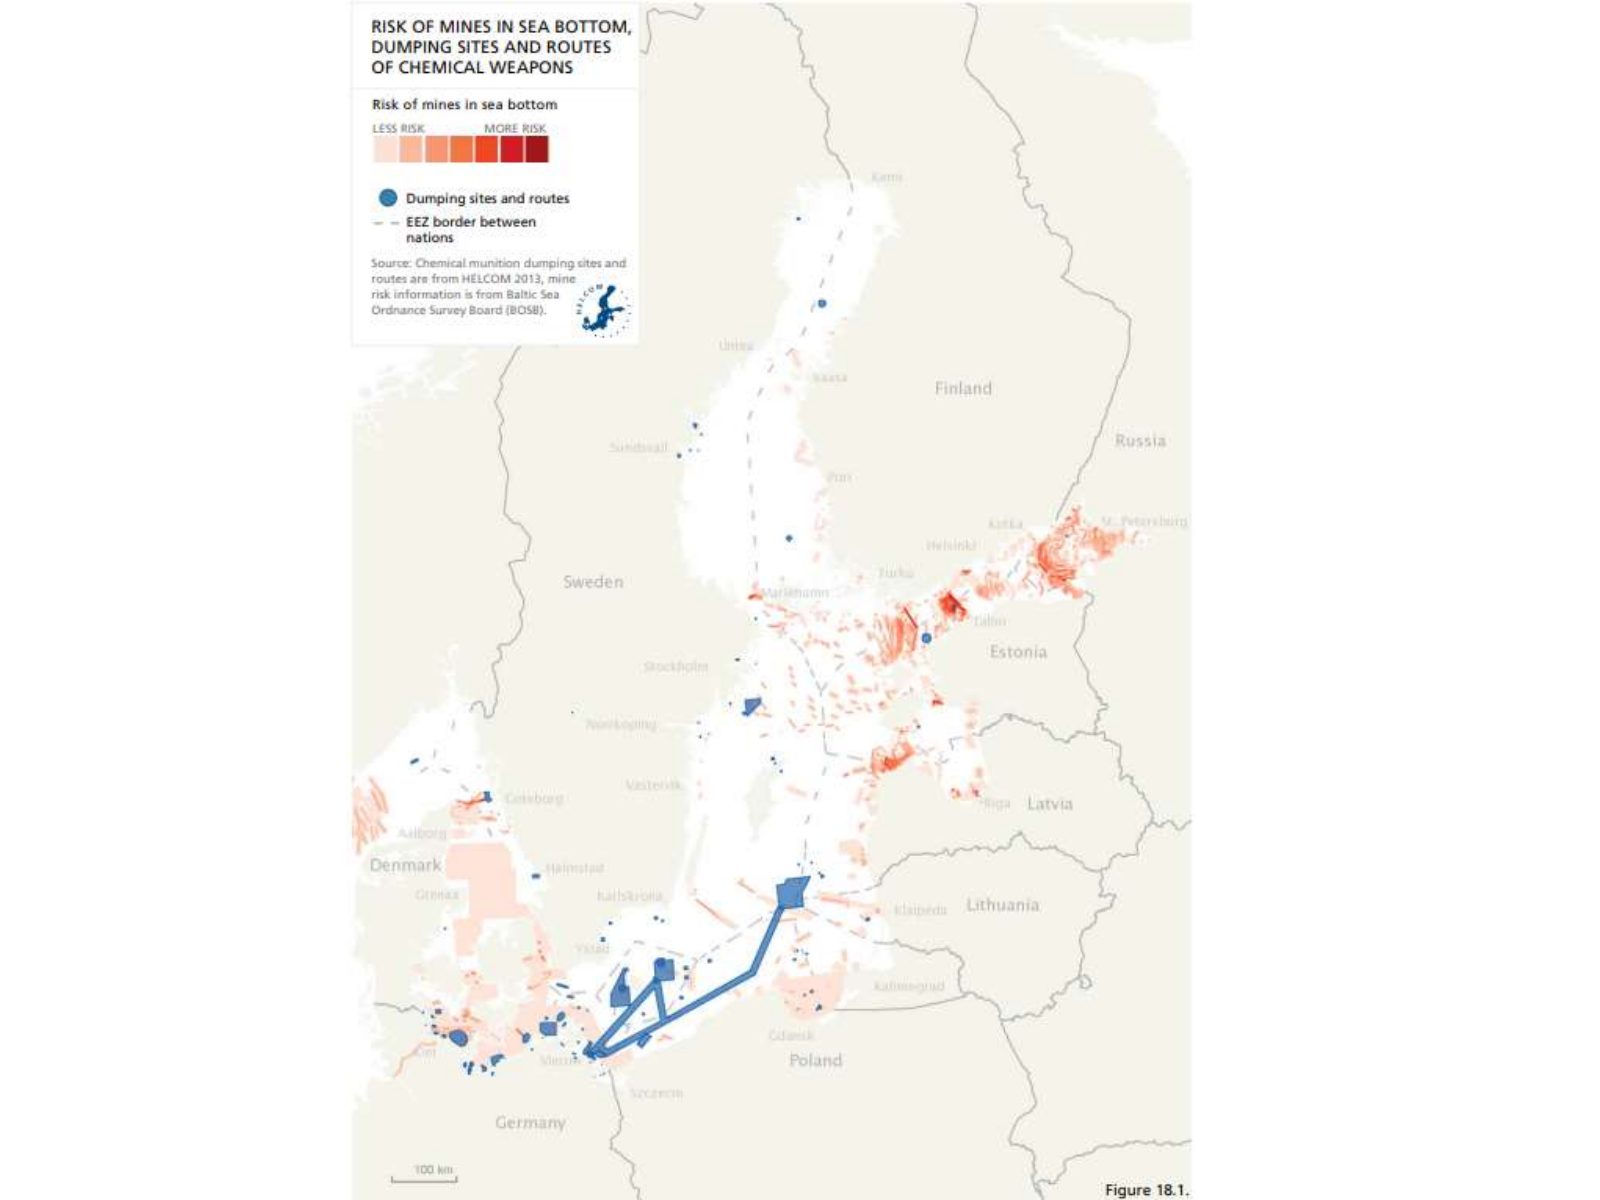
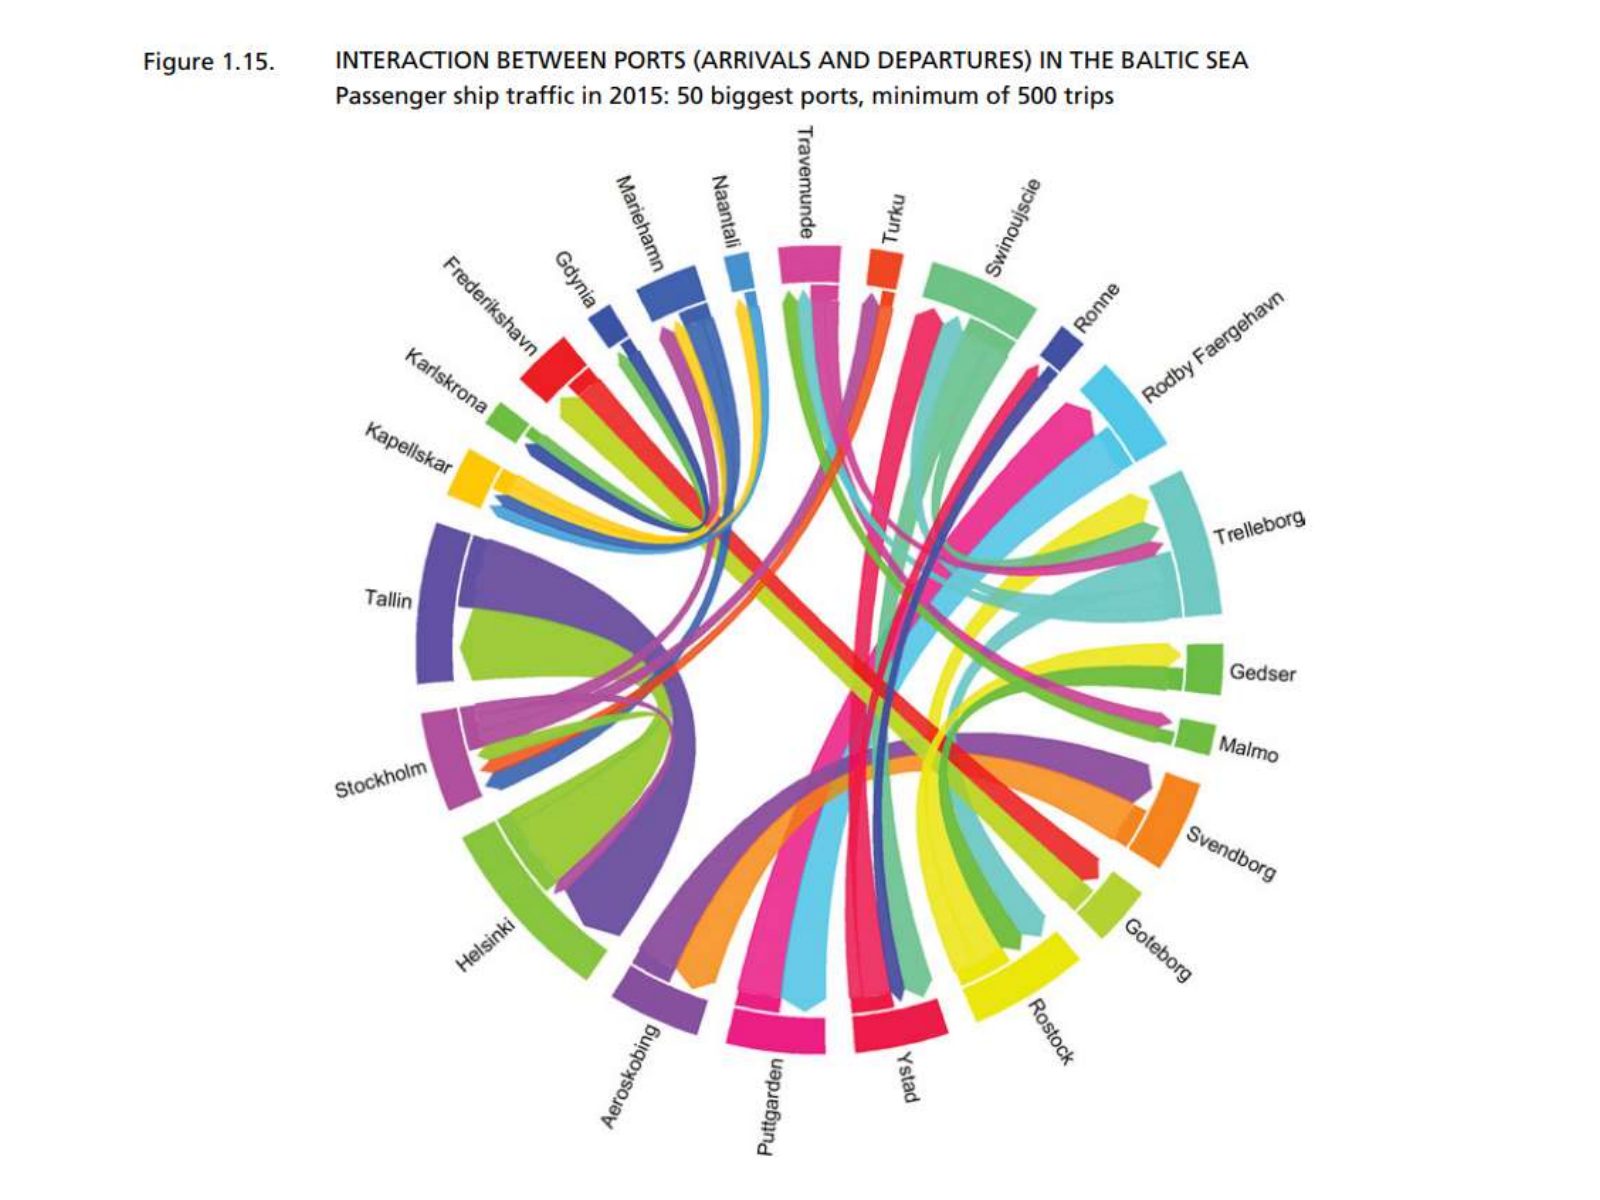
Slide 6 of 75: Scientific data is usually very difficult to visualize. Let us show you some examples
Slide 7 of 75: picture slide without text
Slide 8 of 75: picture slide without text
Slide 9 of 75: picture slide without text
Slide 10 of 75: But before showing you the Maritime Assessment let me explain this thing called HELCOM
Slide 11 of 75: To understand HELCOM we need to talk about a sea that has many problems
Slide 12 of 75: The Baltic Sea is unique and fragile
Slide 13 of 75: There are four characteristics that make the Baltic Sea unique and fragile
Slide 14 of 75: Many people living around; it’s a small area; there are low levels of salt and the Baltic is not so deep!
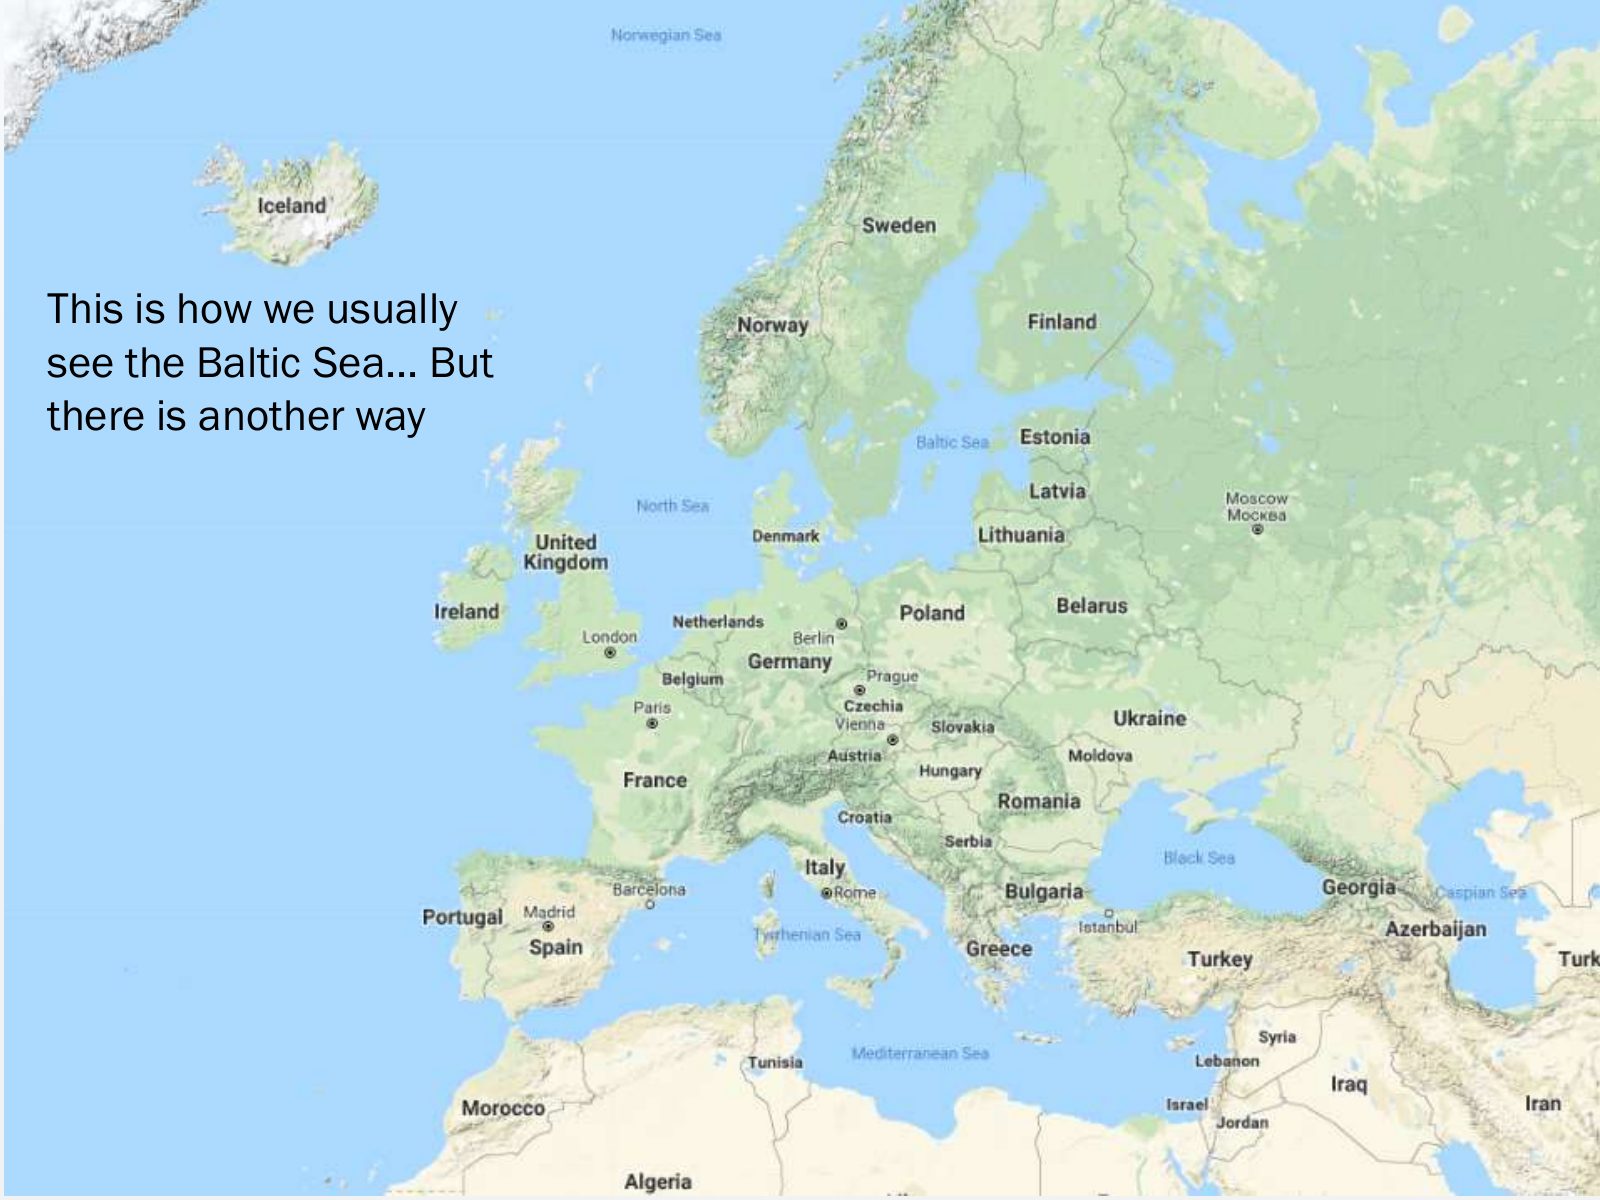
Slide 15 of 75: This is how we usually see the Baltic Sea... But there is another way
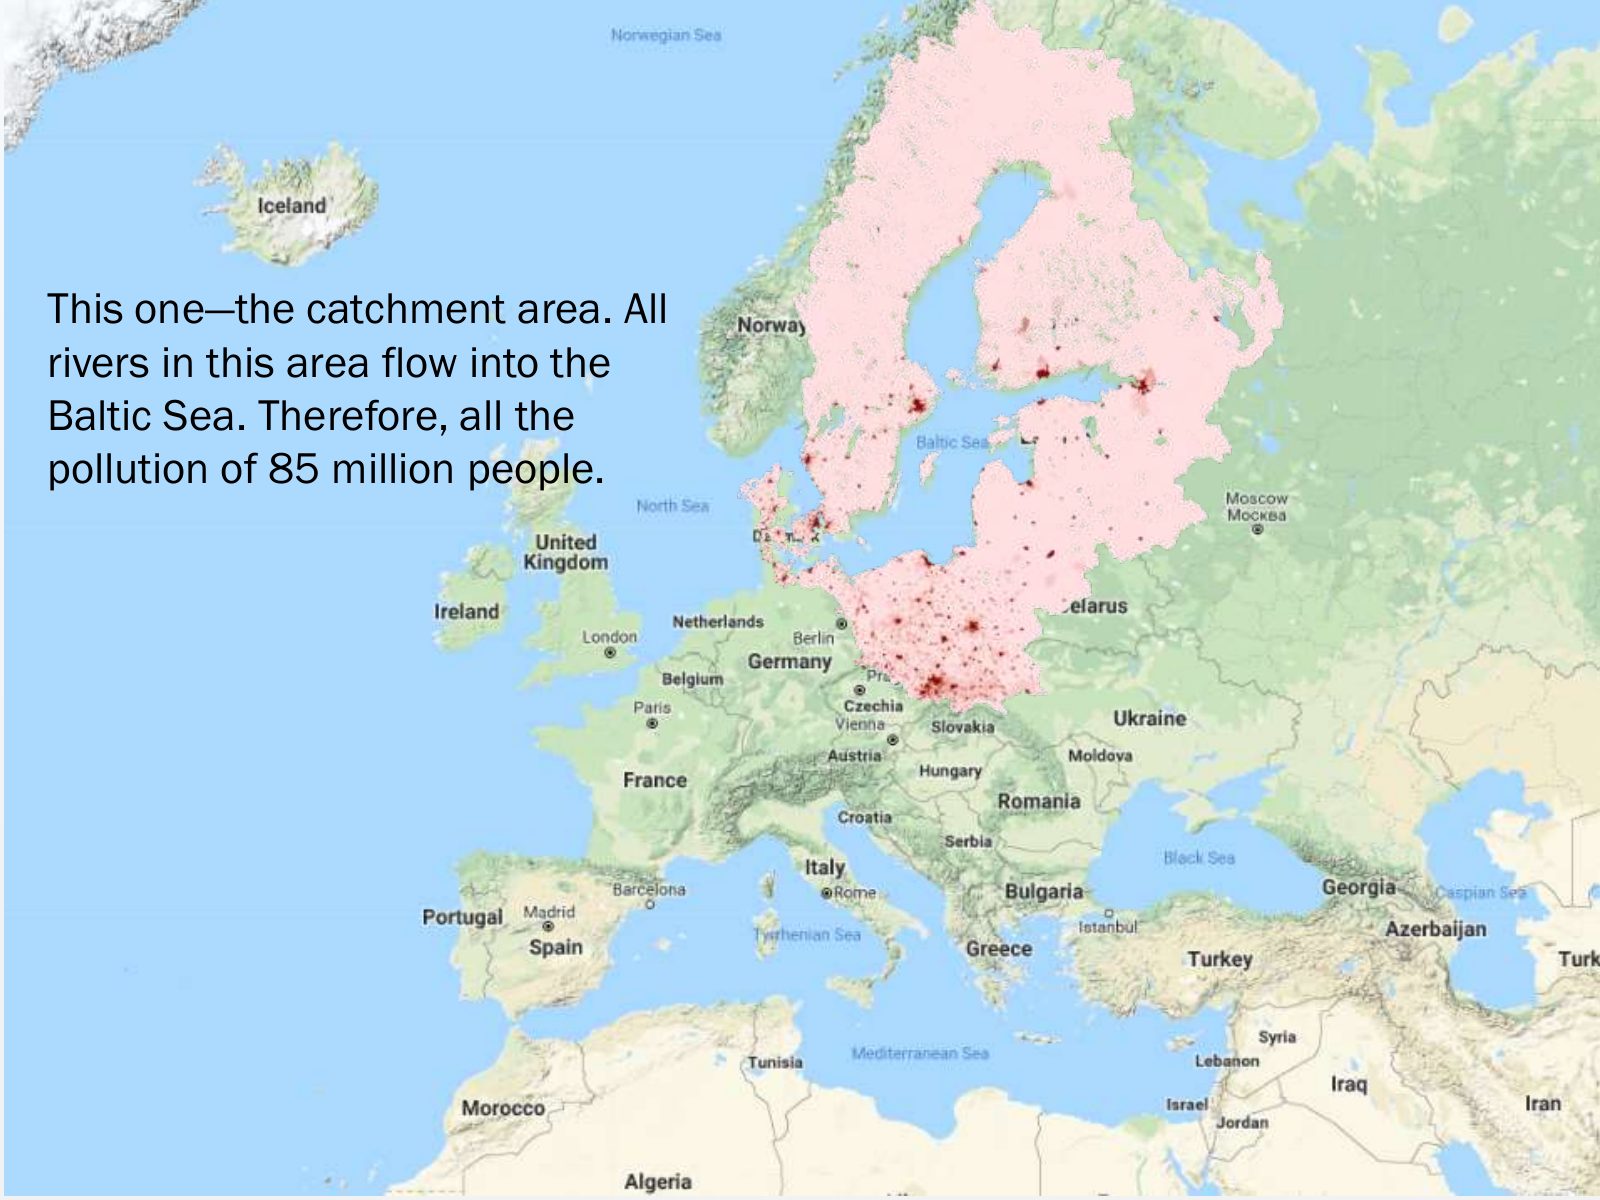
Slide 16 of 75: This one—the catchment area. All rivers in this area flow into the Baltic Sea. Therefore, all the pollution of 85 million people.
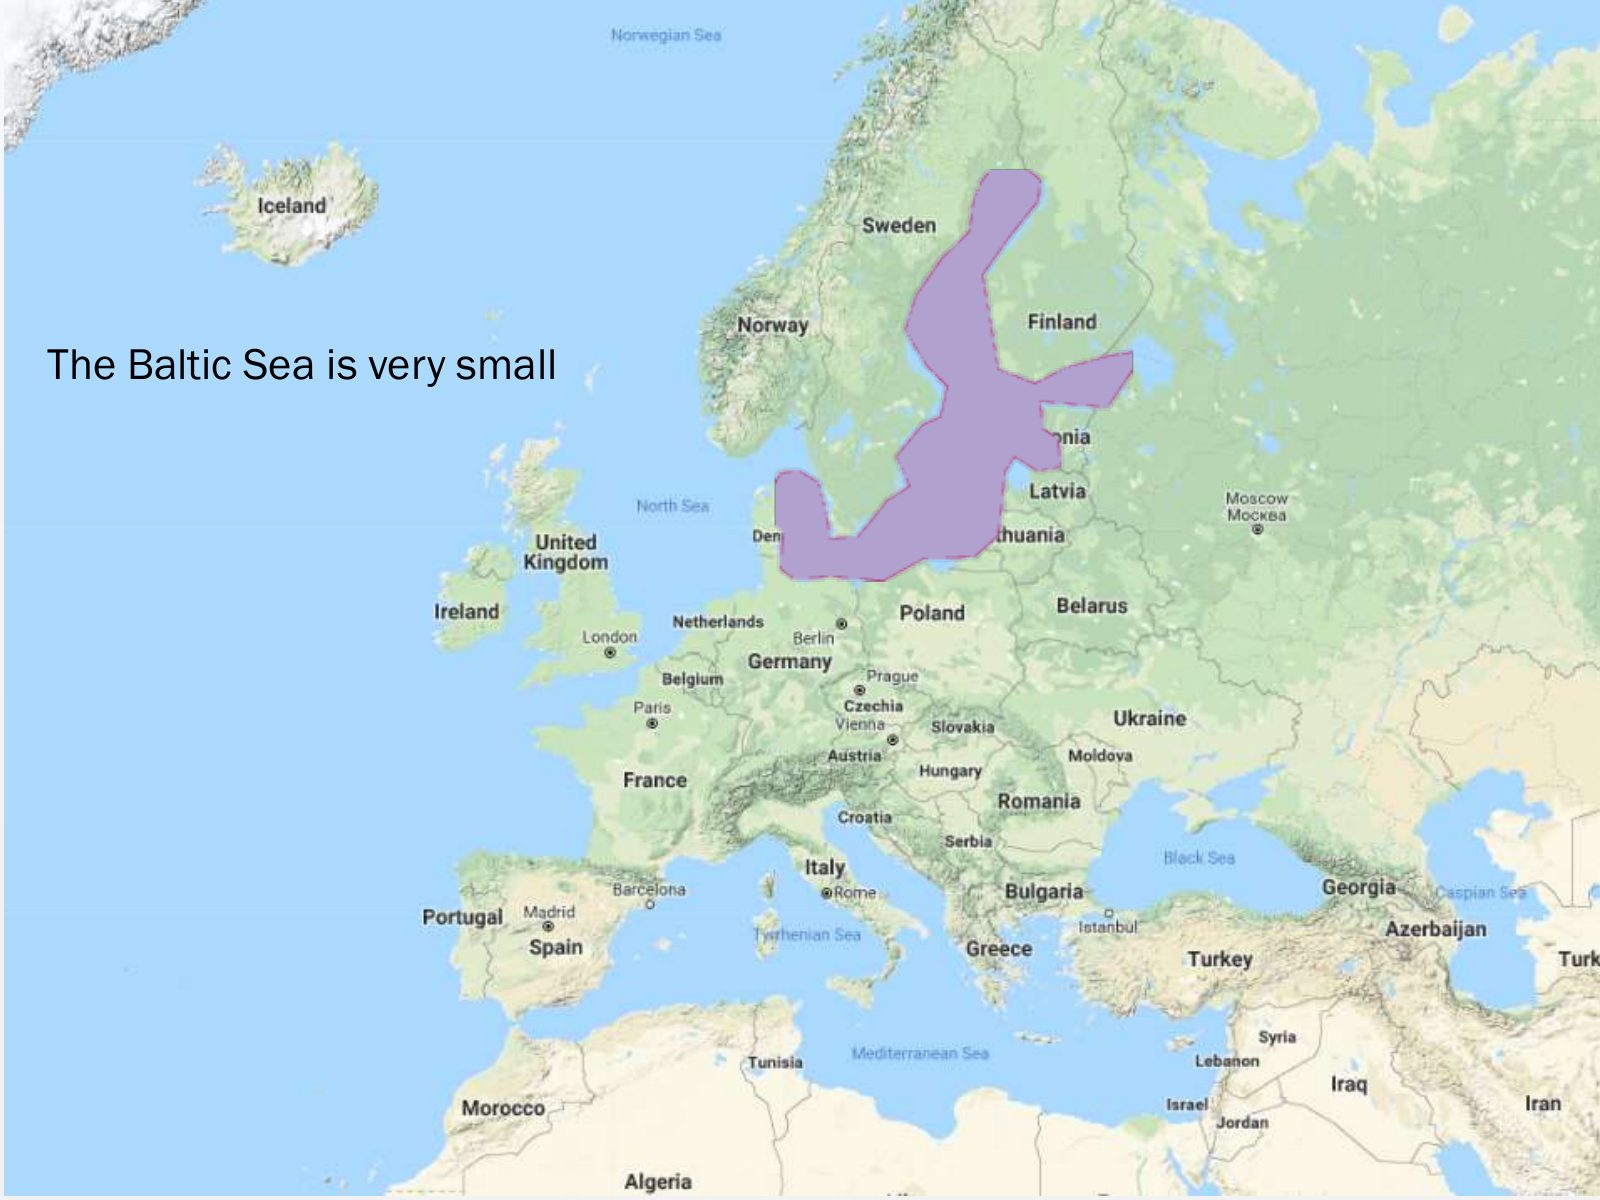
Slide 17 of 75: The Baltic Sea is very small
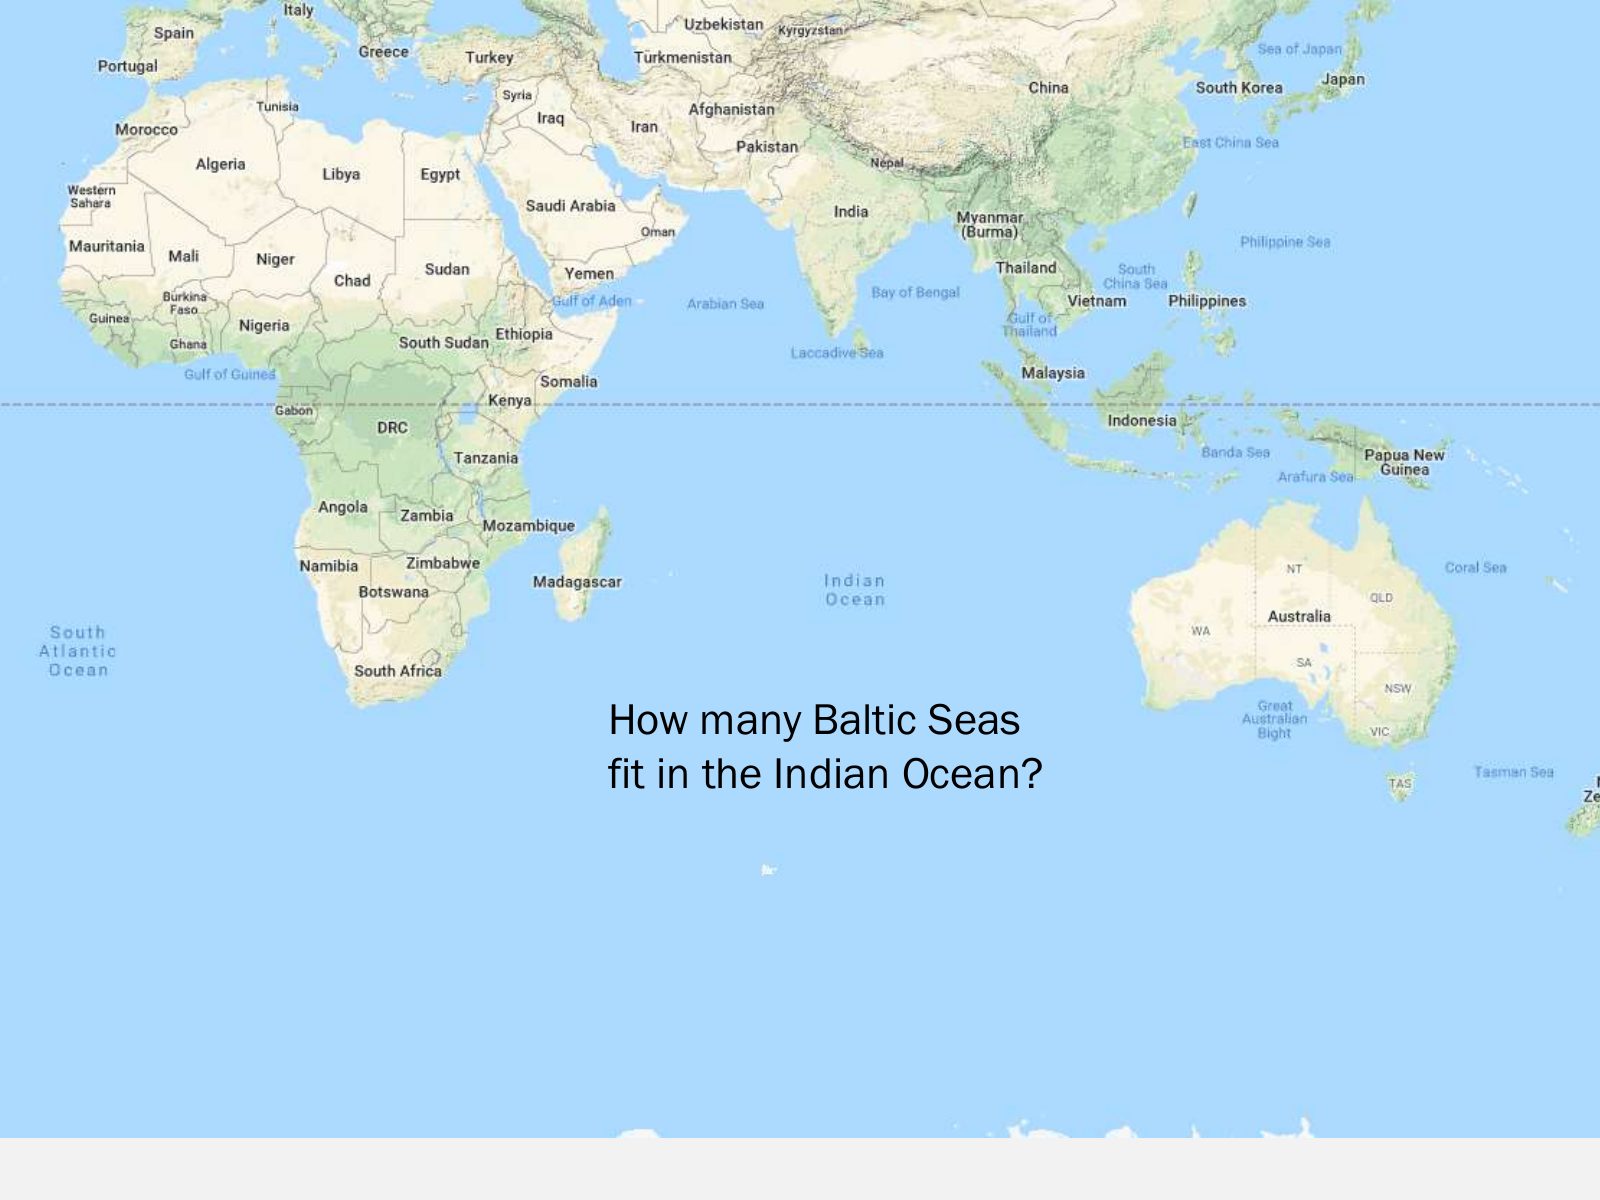
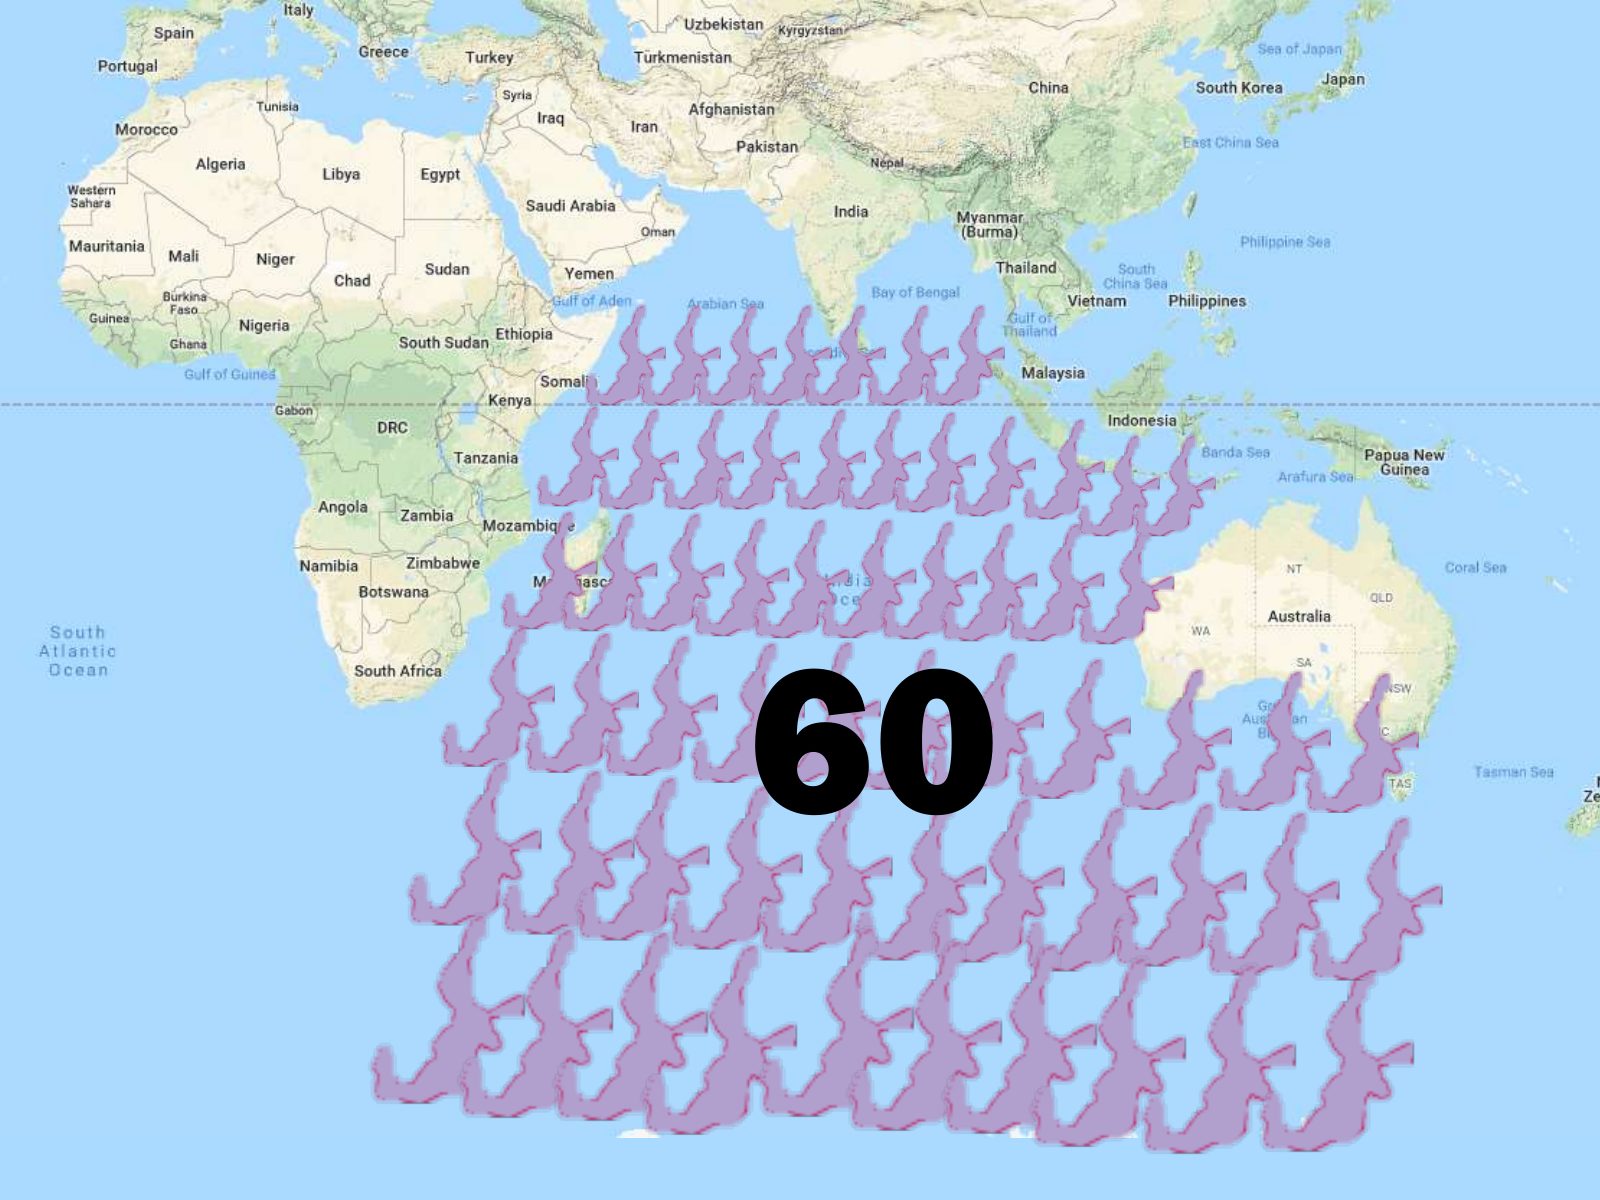
Slide 18 of 75: How many Baltic Seas fit in the Indian Ocean?
Slide 19 of 75: 60
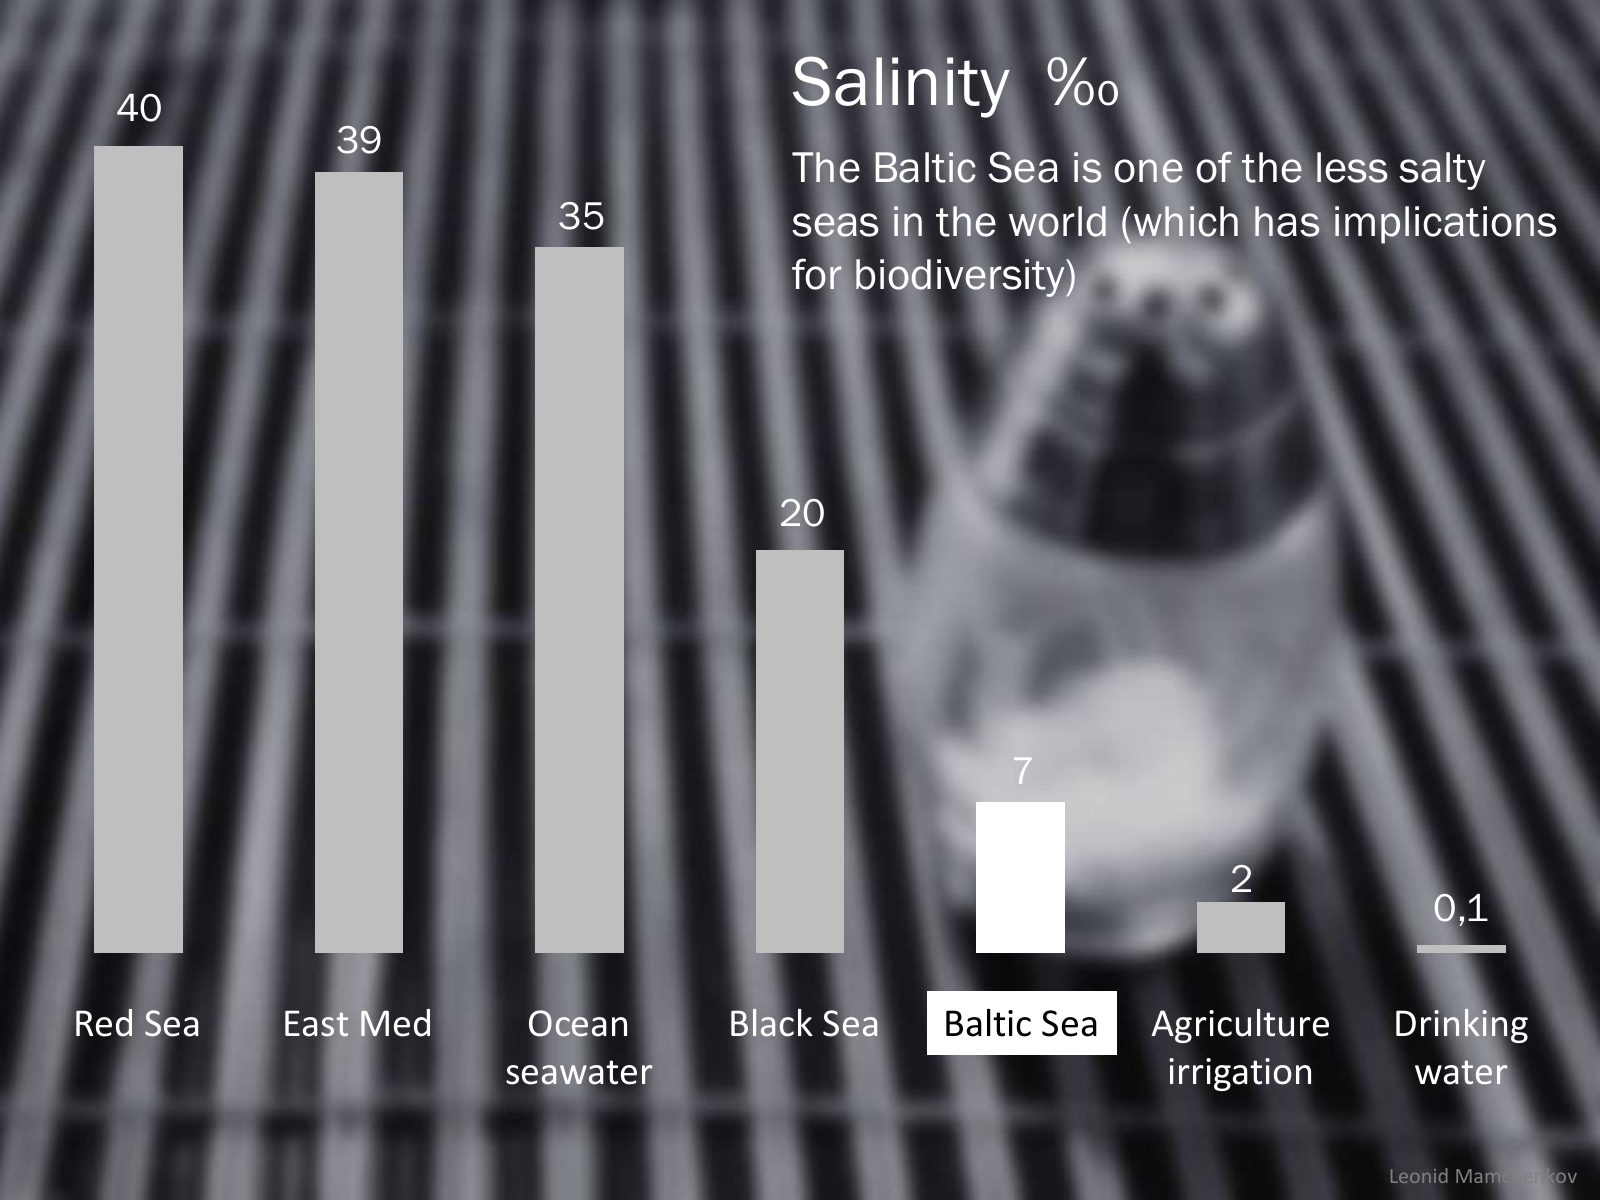
Slide 20 of 75: 40 Salinity ‰ 39 The Baltic Sea is one of the less salty 35 seas in the world (which has implications for biodiversity) 20 7 2 0,1 Red Sea East Med Ocean Bla…
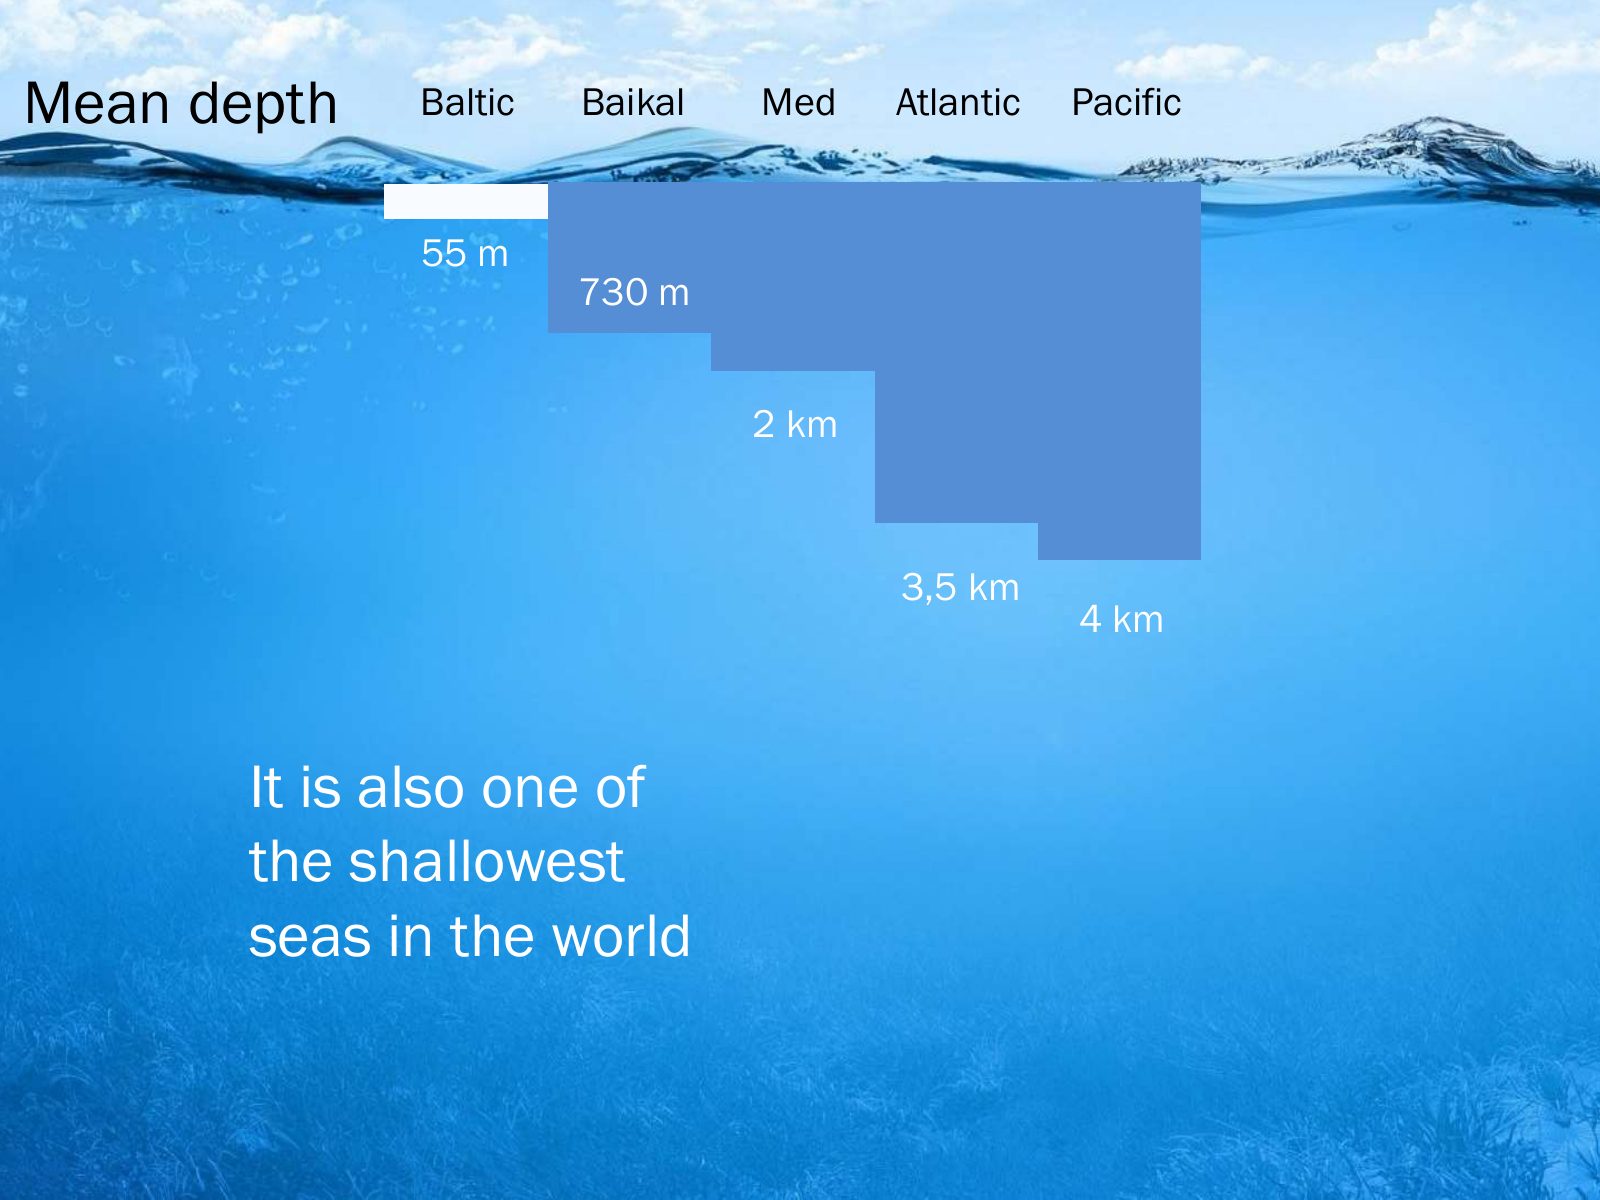
Slide 21 of 75: Mean depth Baltic Baikal Med Atlantic Pacific 55 m 730 m 2 km 3,5 km 4 km It is also one of the shallowest seas in the world
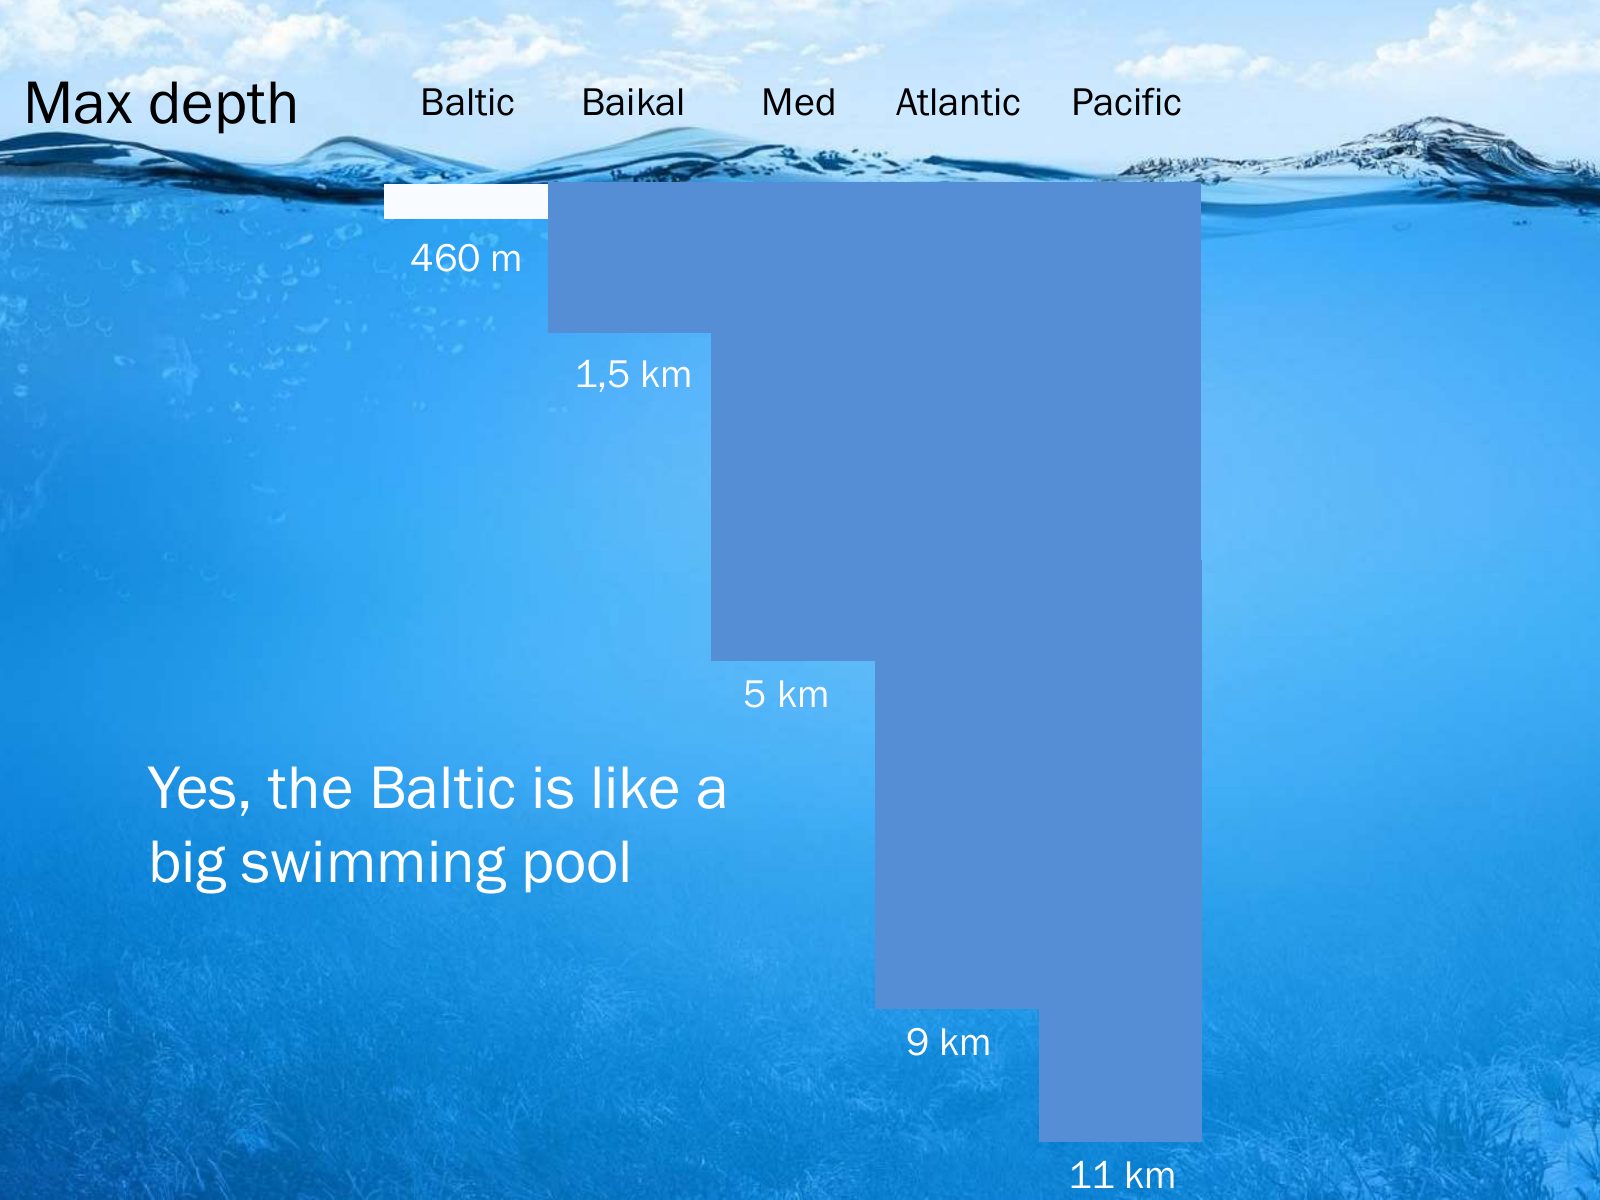
Slide 22 of 75: Max depth Baltic Baikal Med Atlantic Pacific 460 m 1,5 km 5 km Yes, the Baltic is like a big swimming pool 9 km 11 km
Slide 23 of 75: The Baltic Sea is unique. These special charactieristic make it very fragile.
Slide 24 of 75: Our dear sea has been so sick... and still is! That’s why HELCOM exists.
Slide 25 of 75: HELCOM? What’s that?
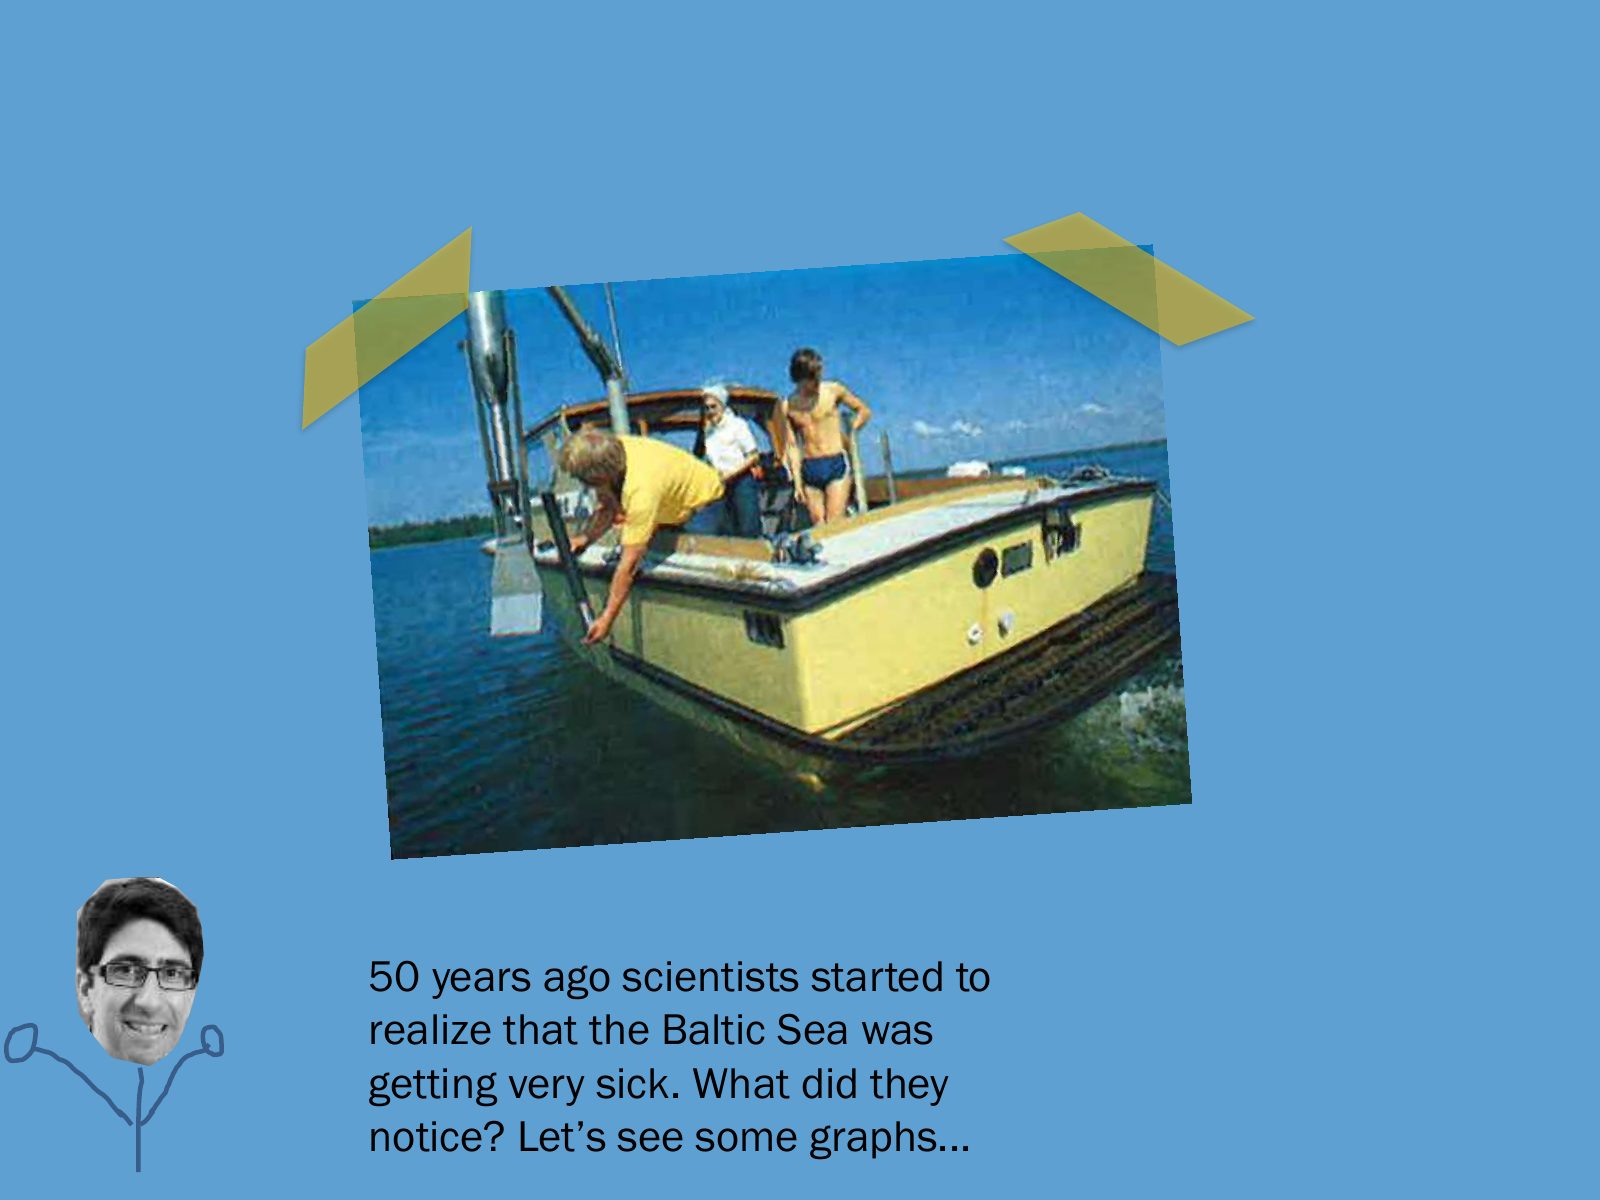
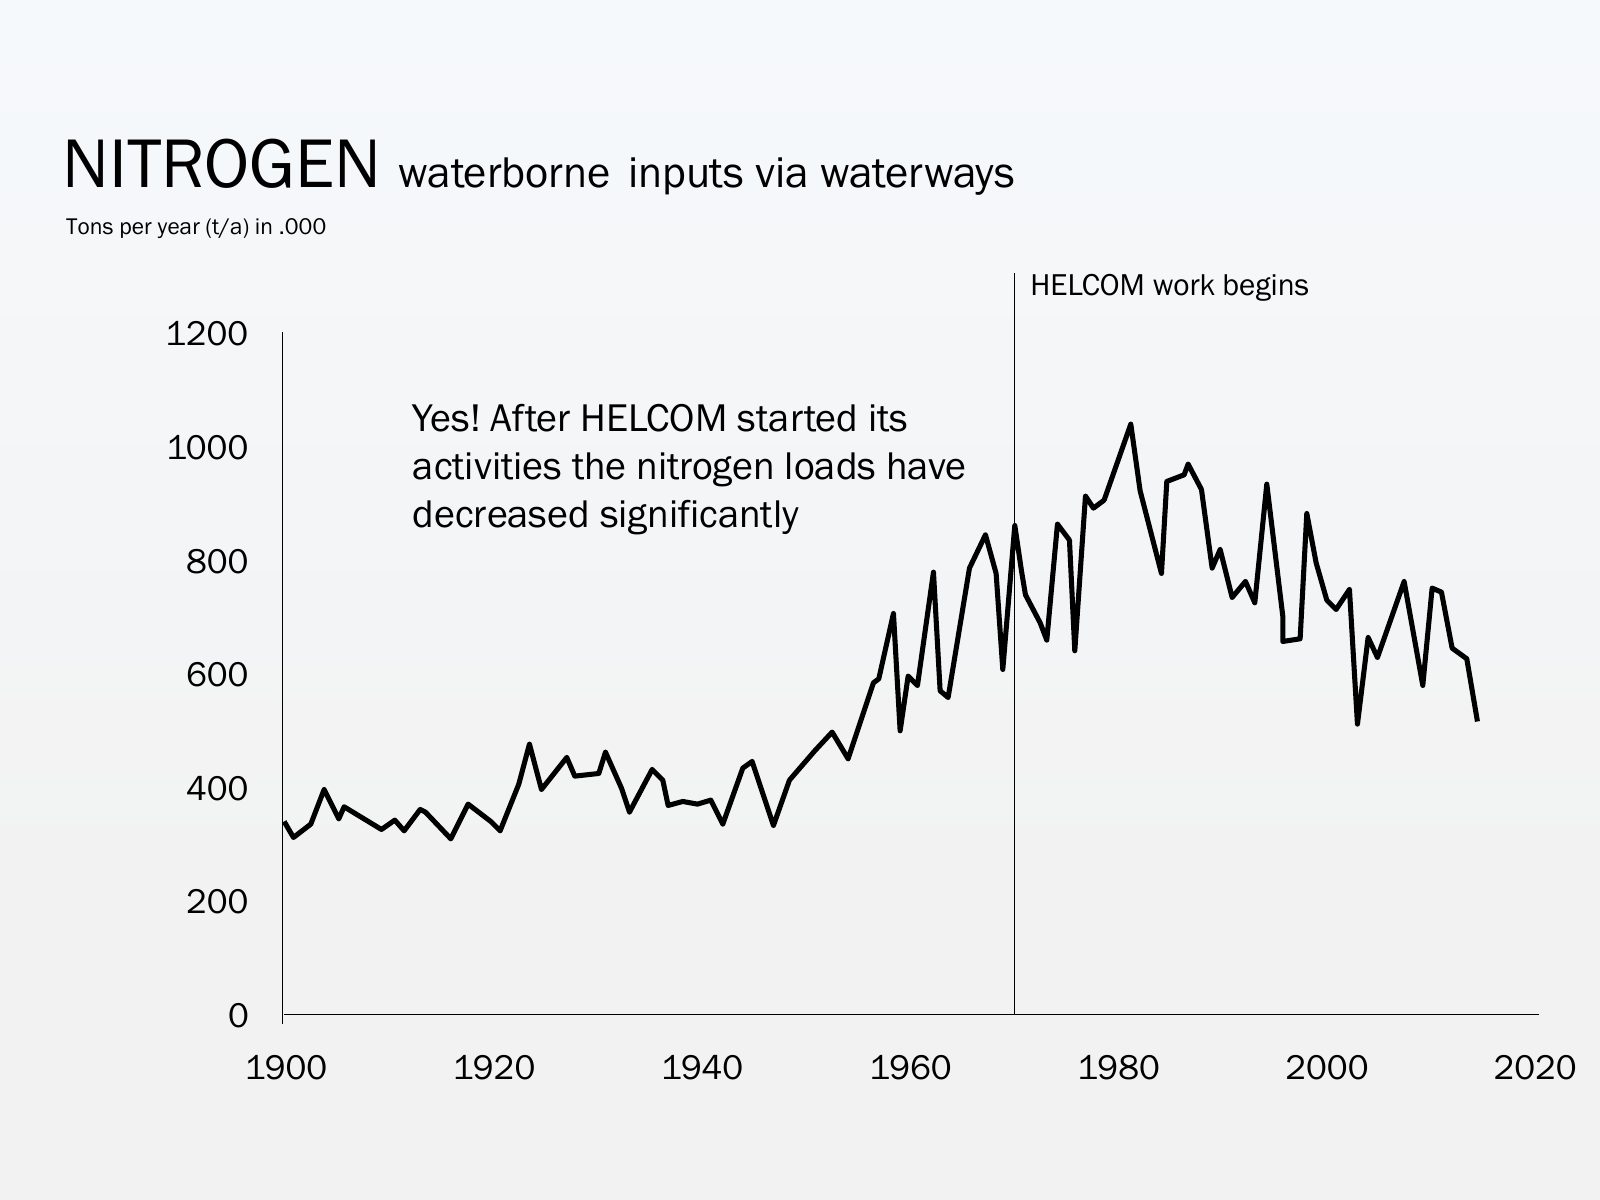
Slide 26 of 75: 50 years ago scientists started to realize that the Baltic Sea was getting very sick. What did they notice? Let’s see some graphs...
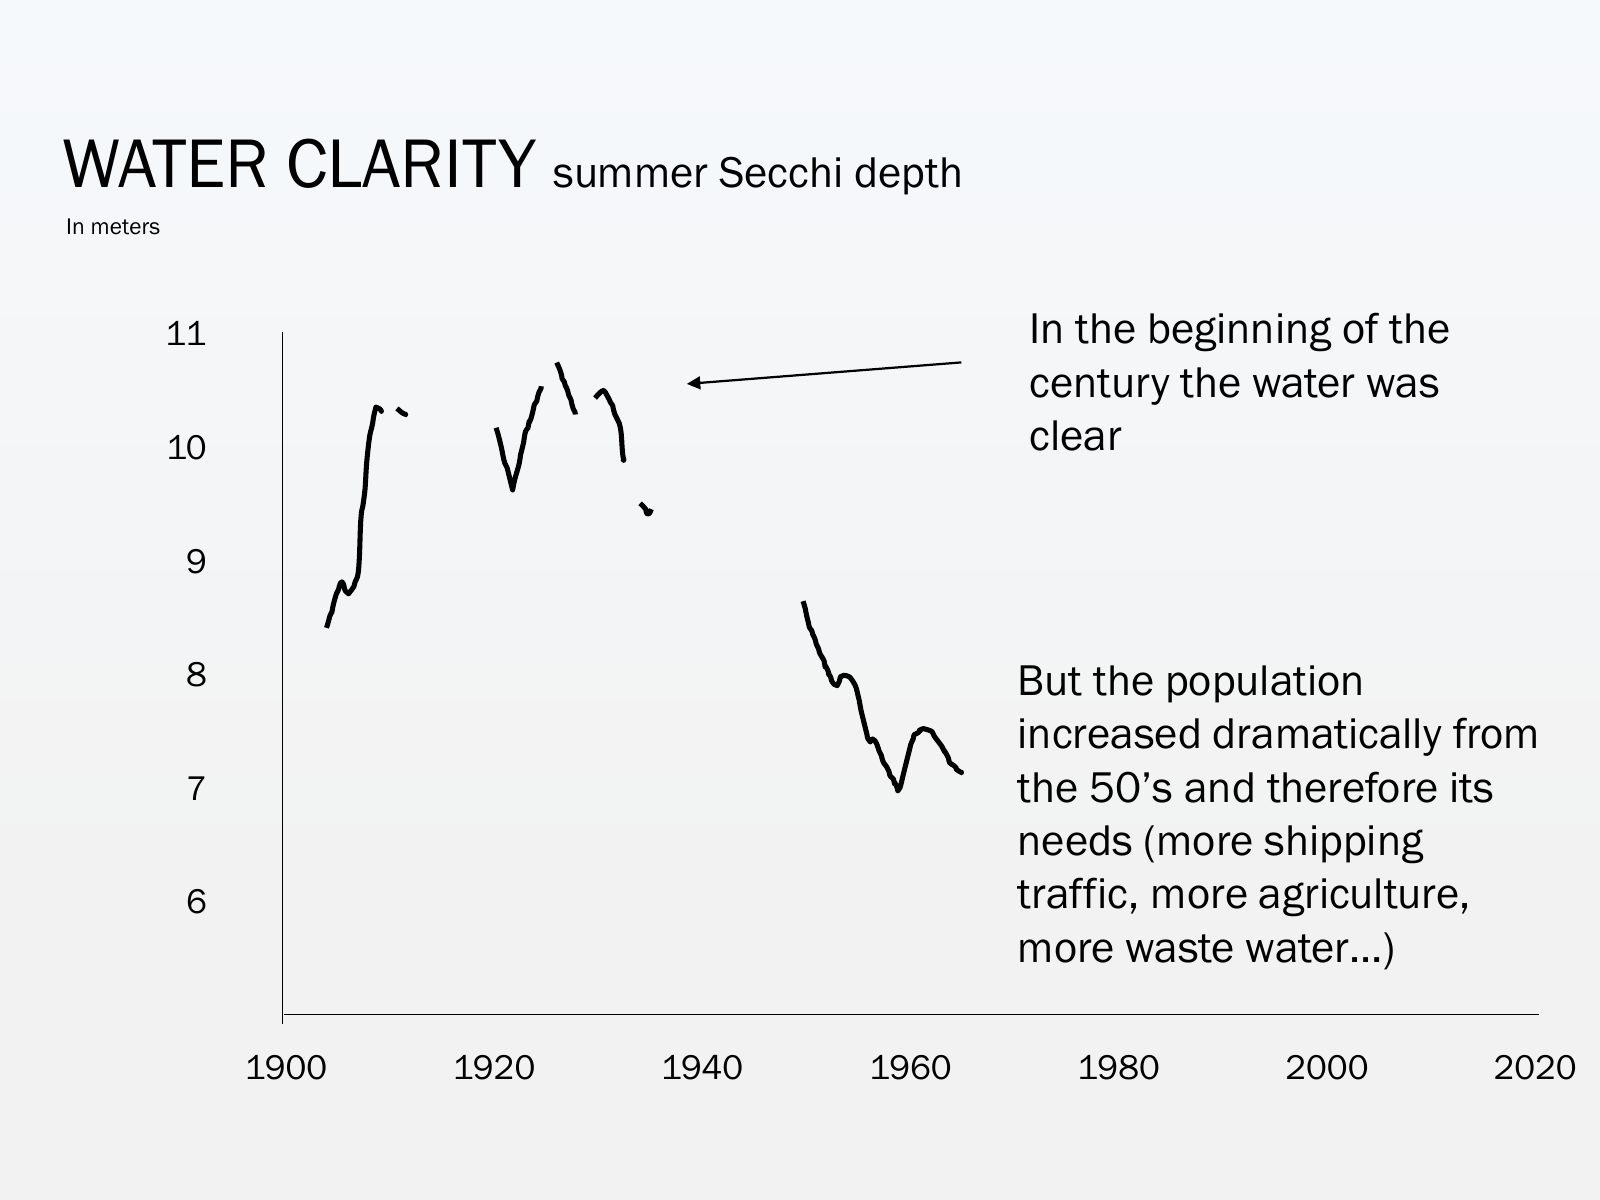
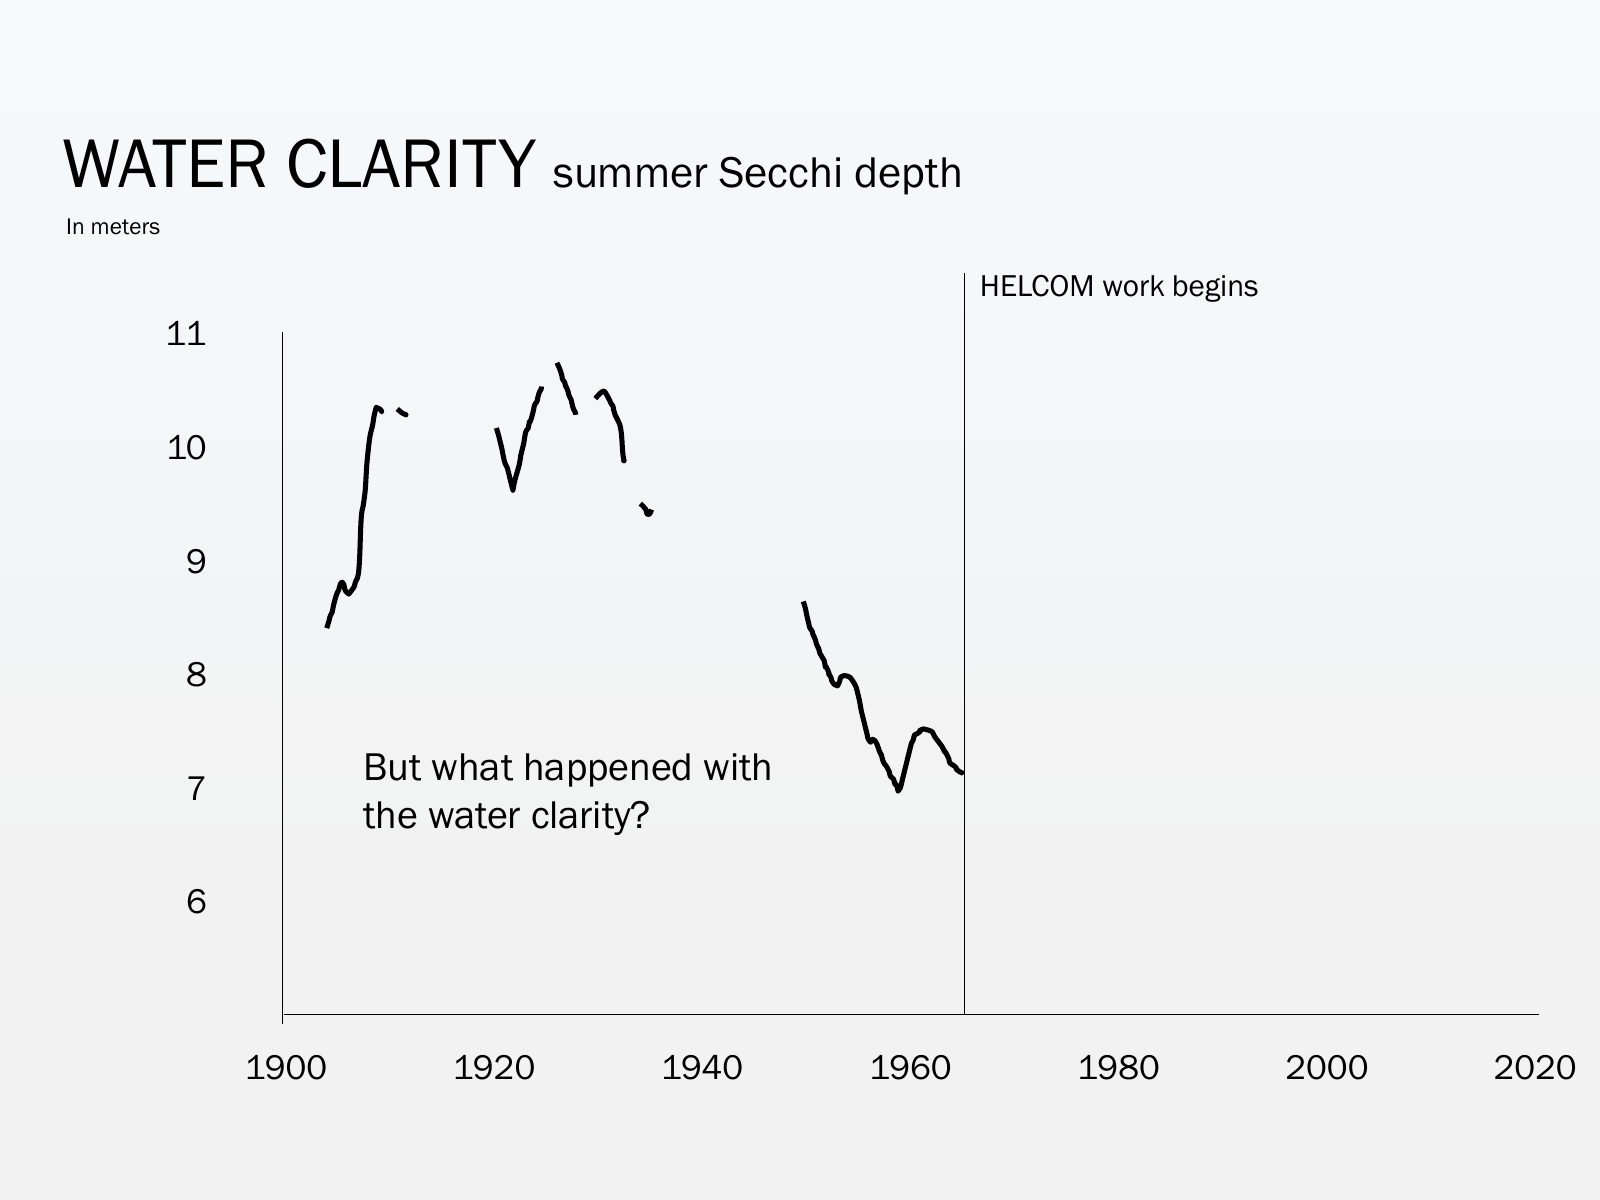
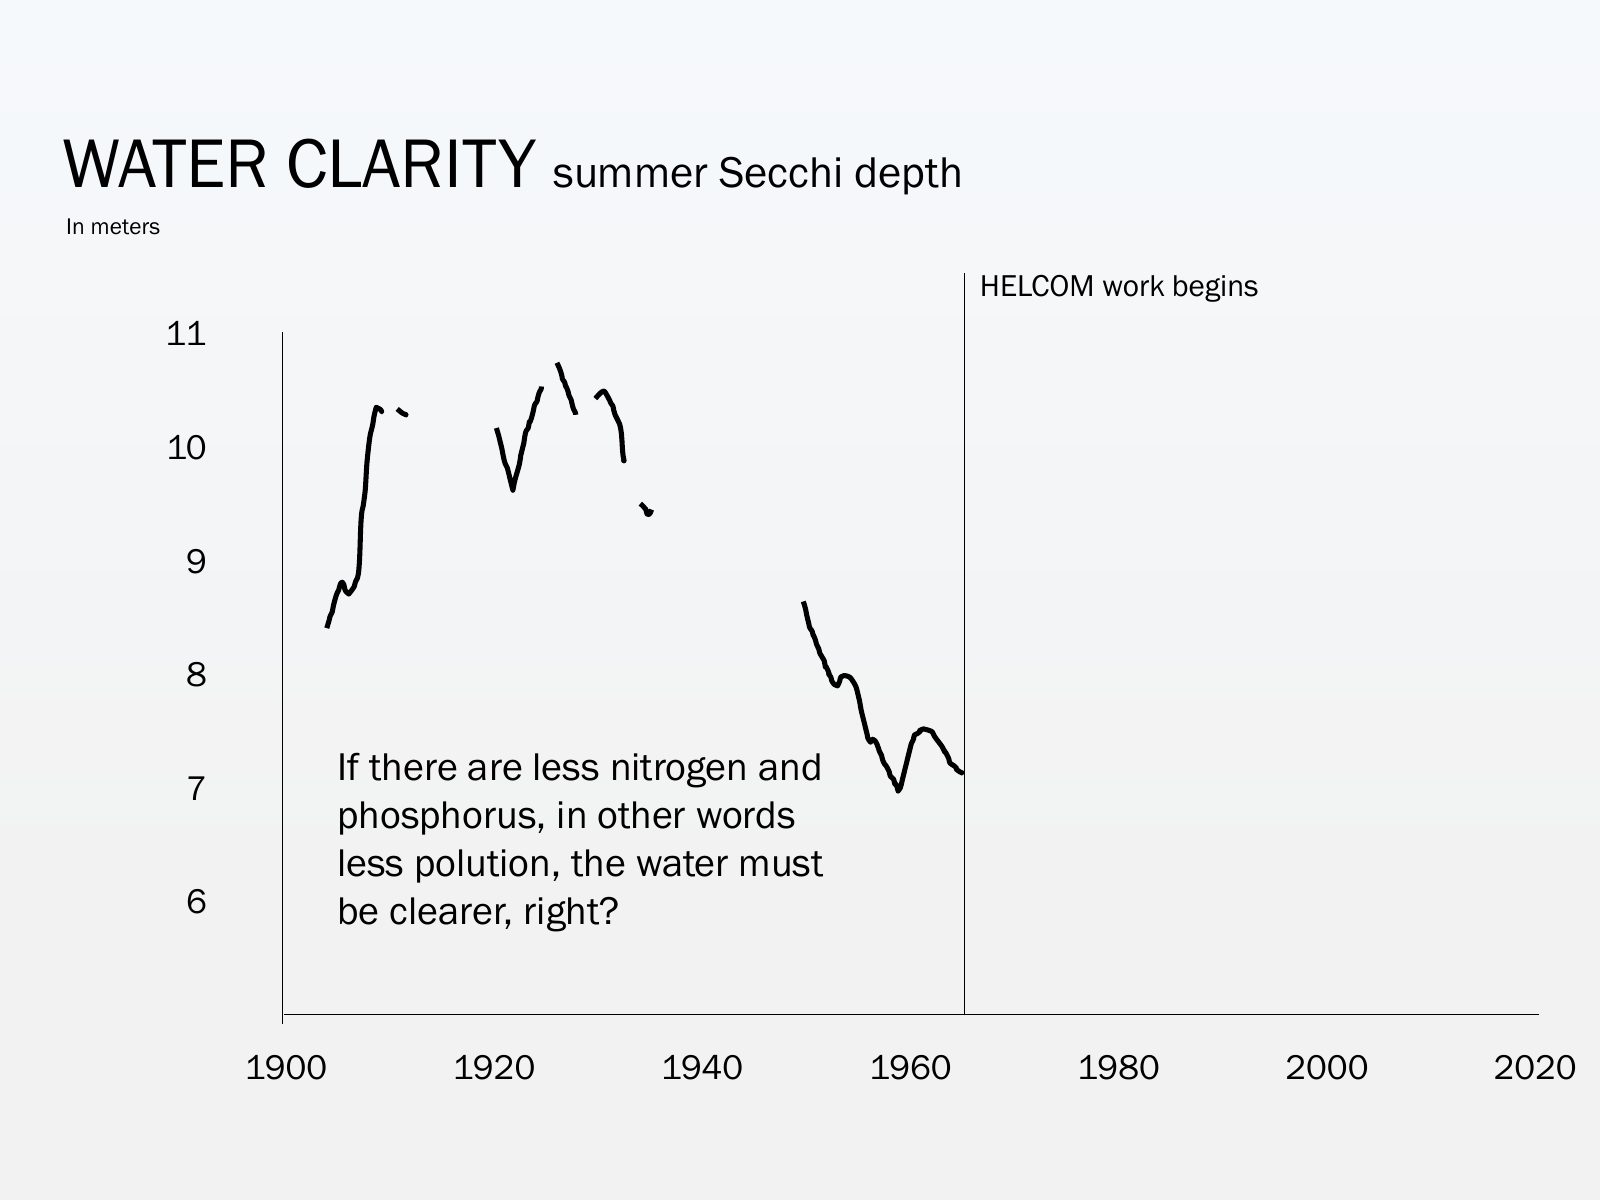
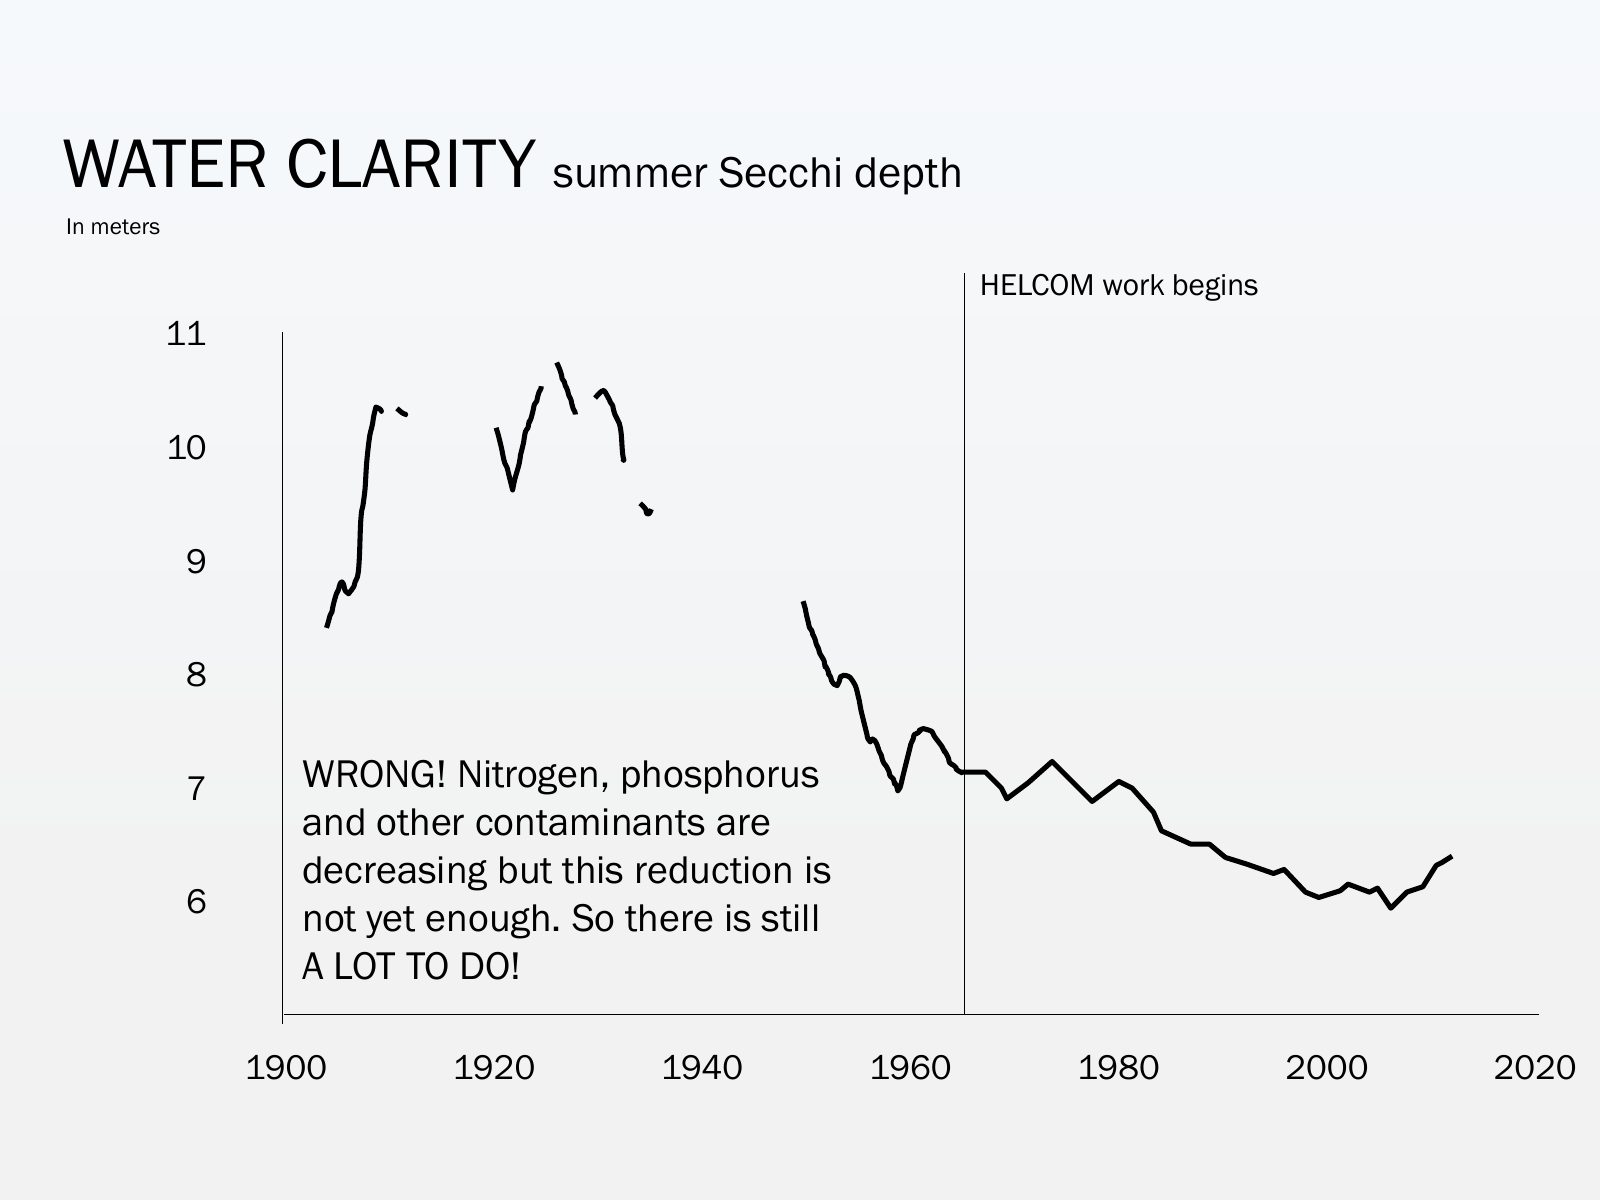
Slide 27 of 75: WATER CLARITY summer Secchi depth In meters 11 In the beginning of the century the water was 10 clear 9 8 But the population increased dramatically from 7 th…
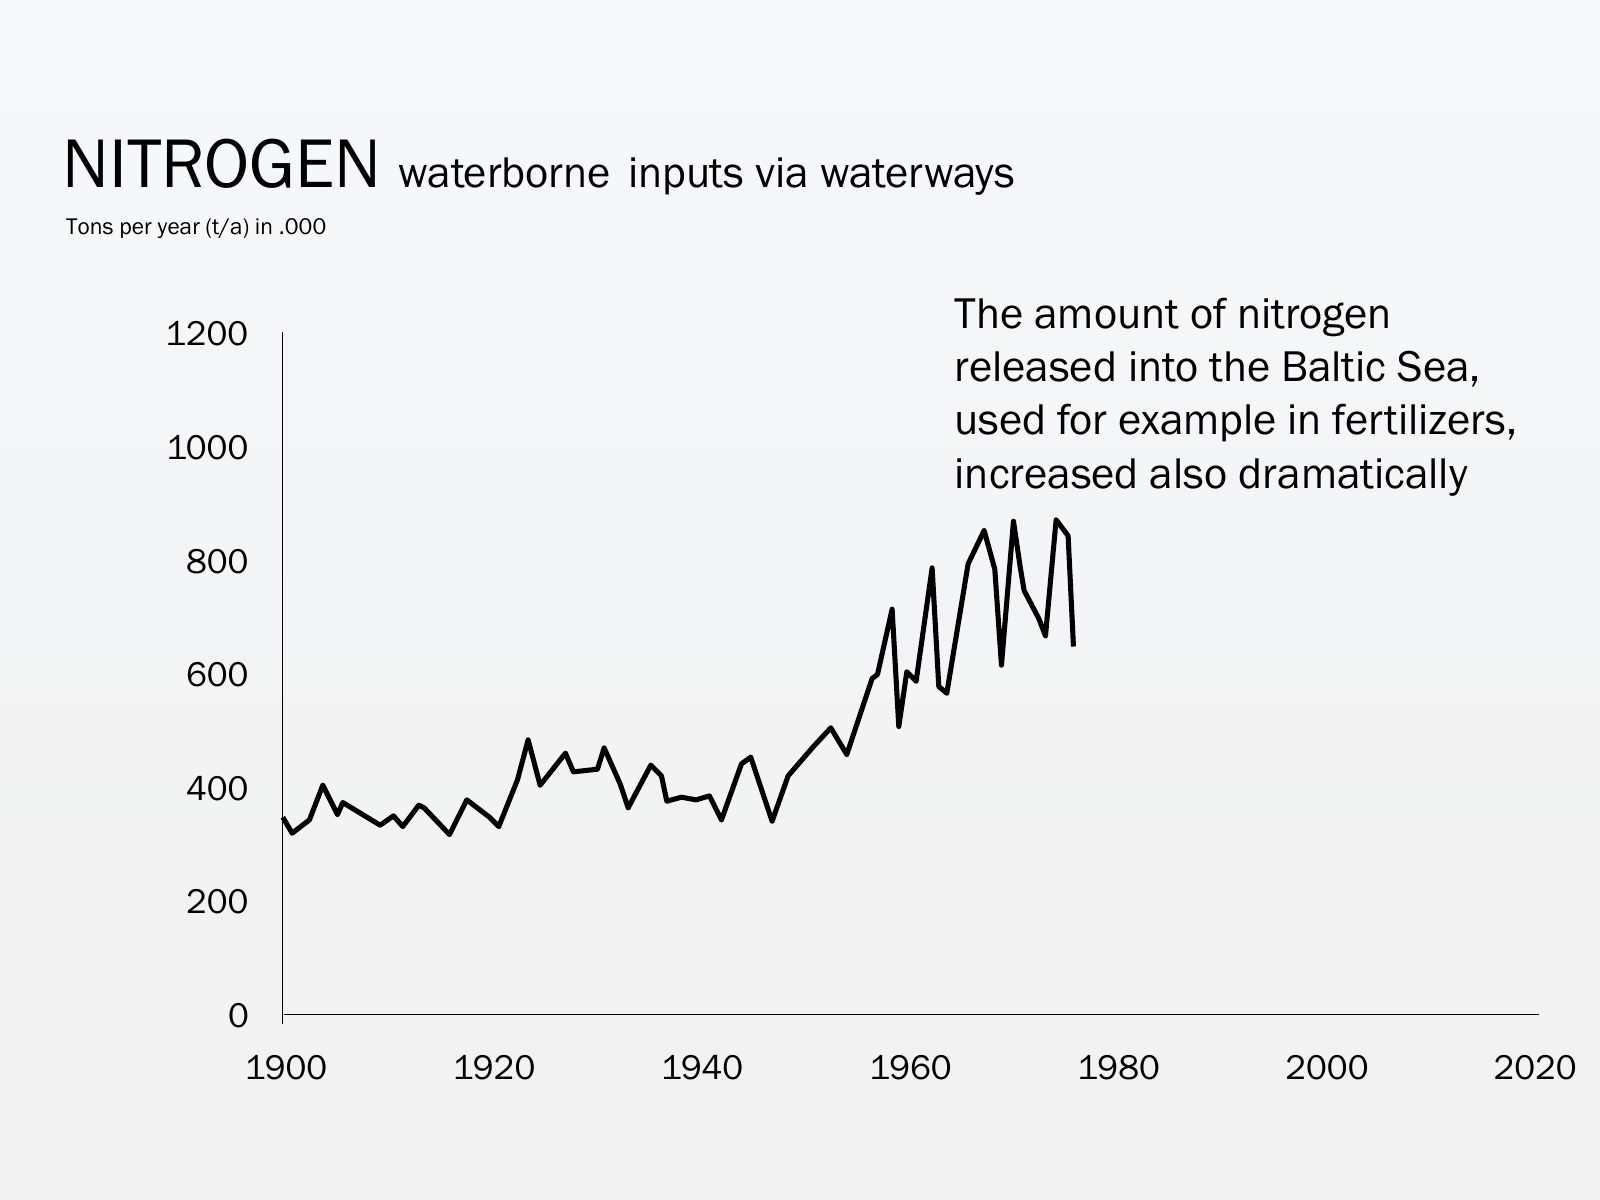
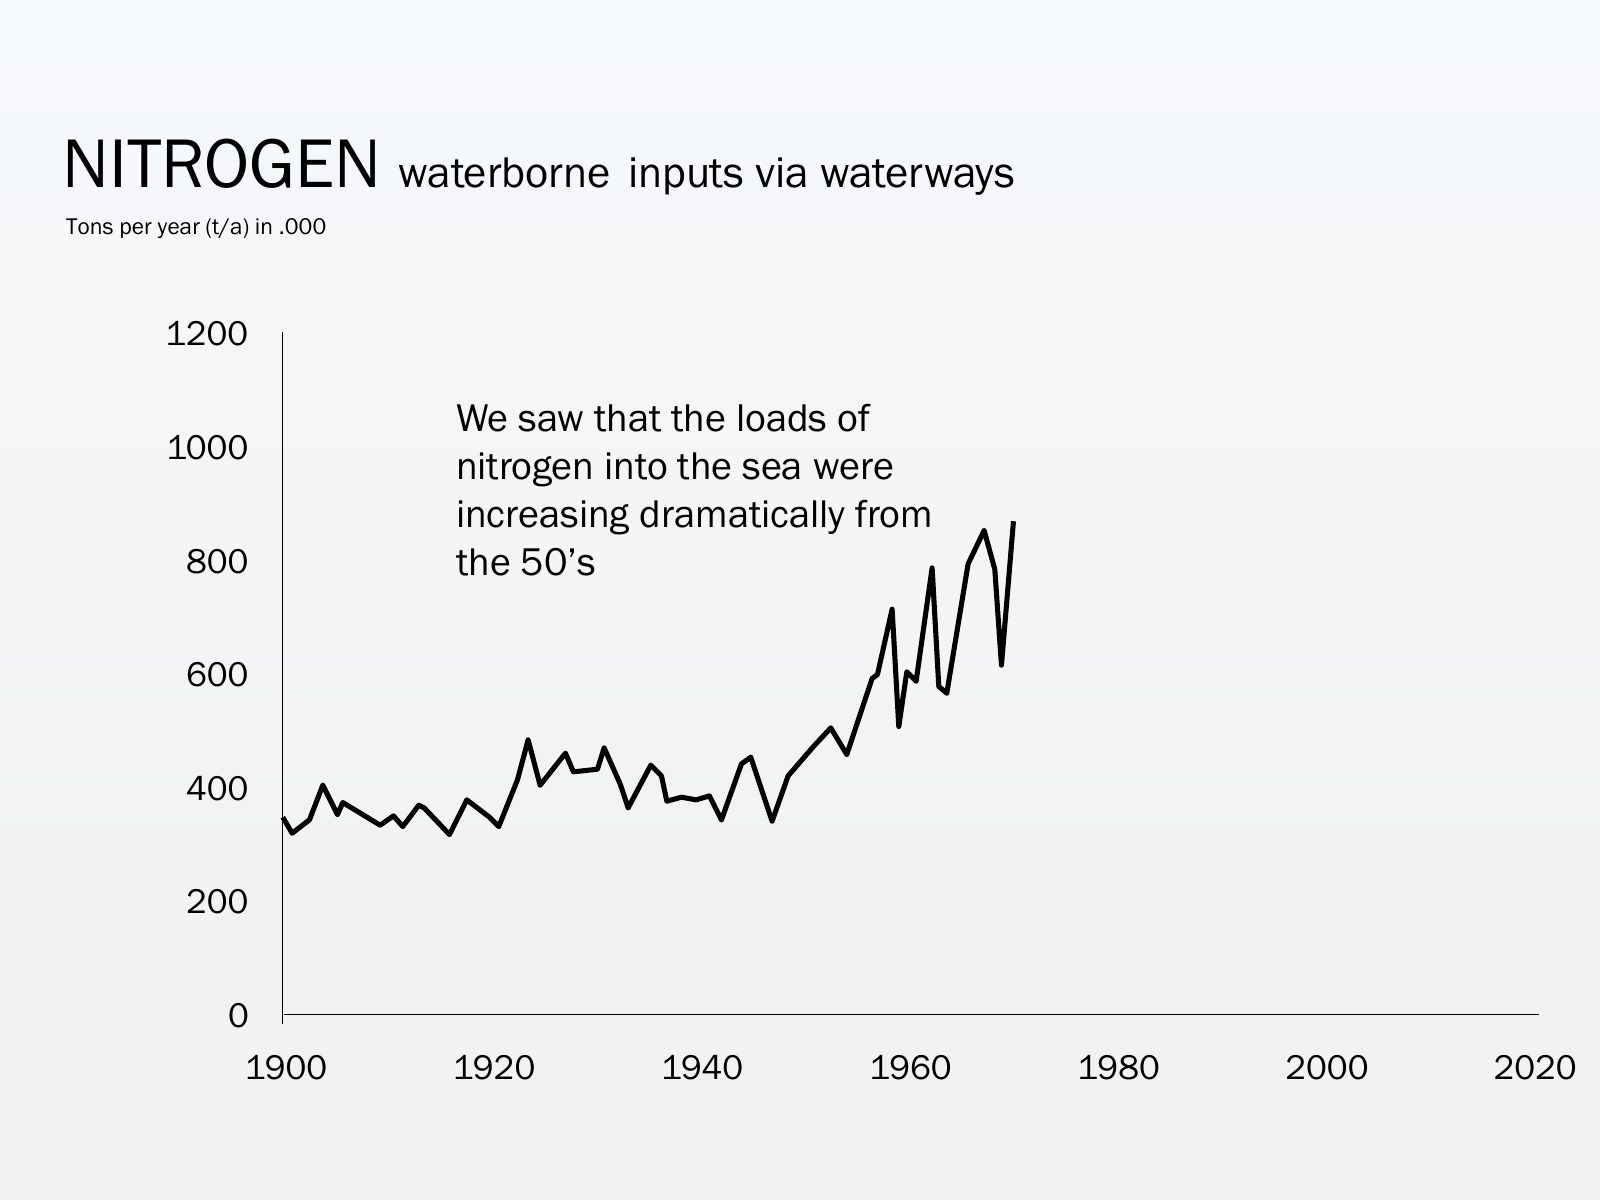
Slide 28 of 75: NITROGEN waterborne inputs via waterways Tons per year (t/a) in .000 1200 The amount of nitrogen released into the Baltic Sea, used for example in fertilizer…
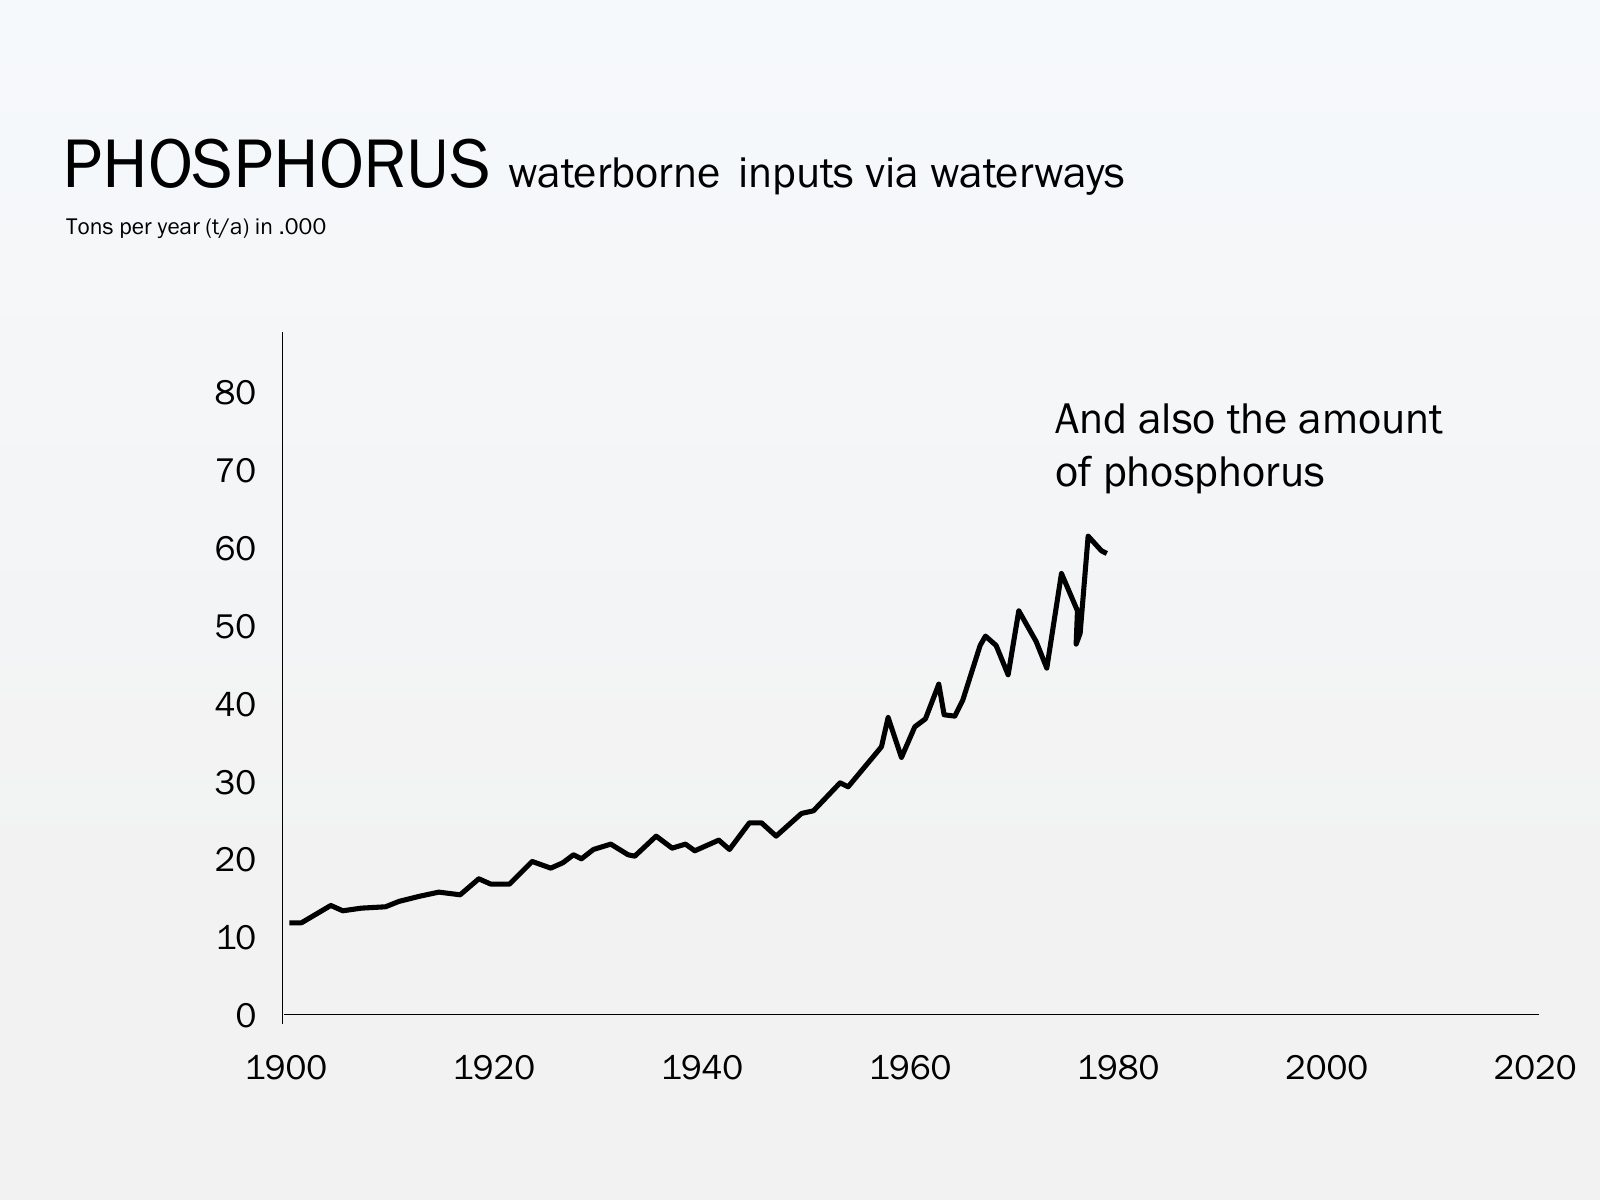
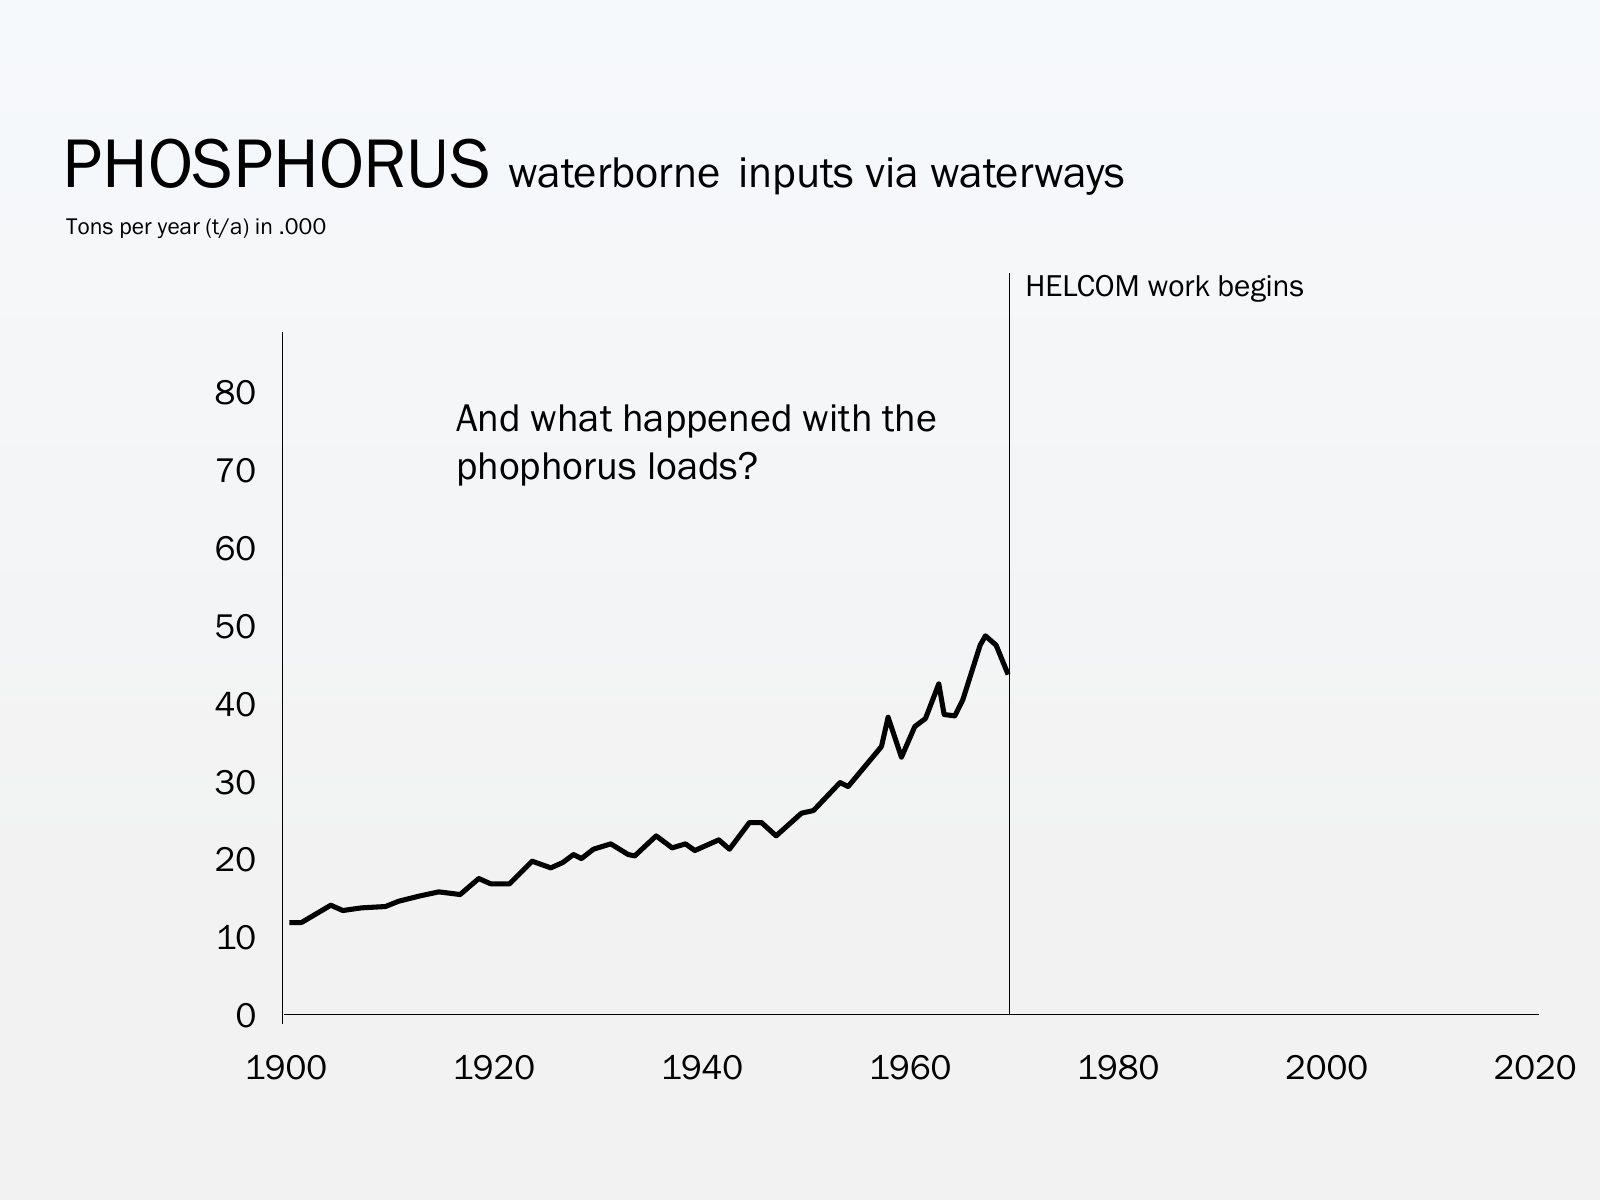
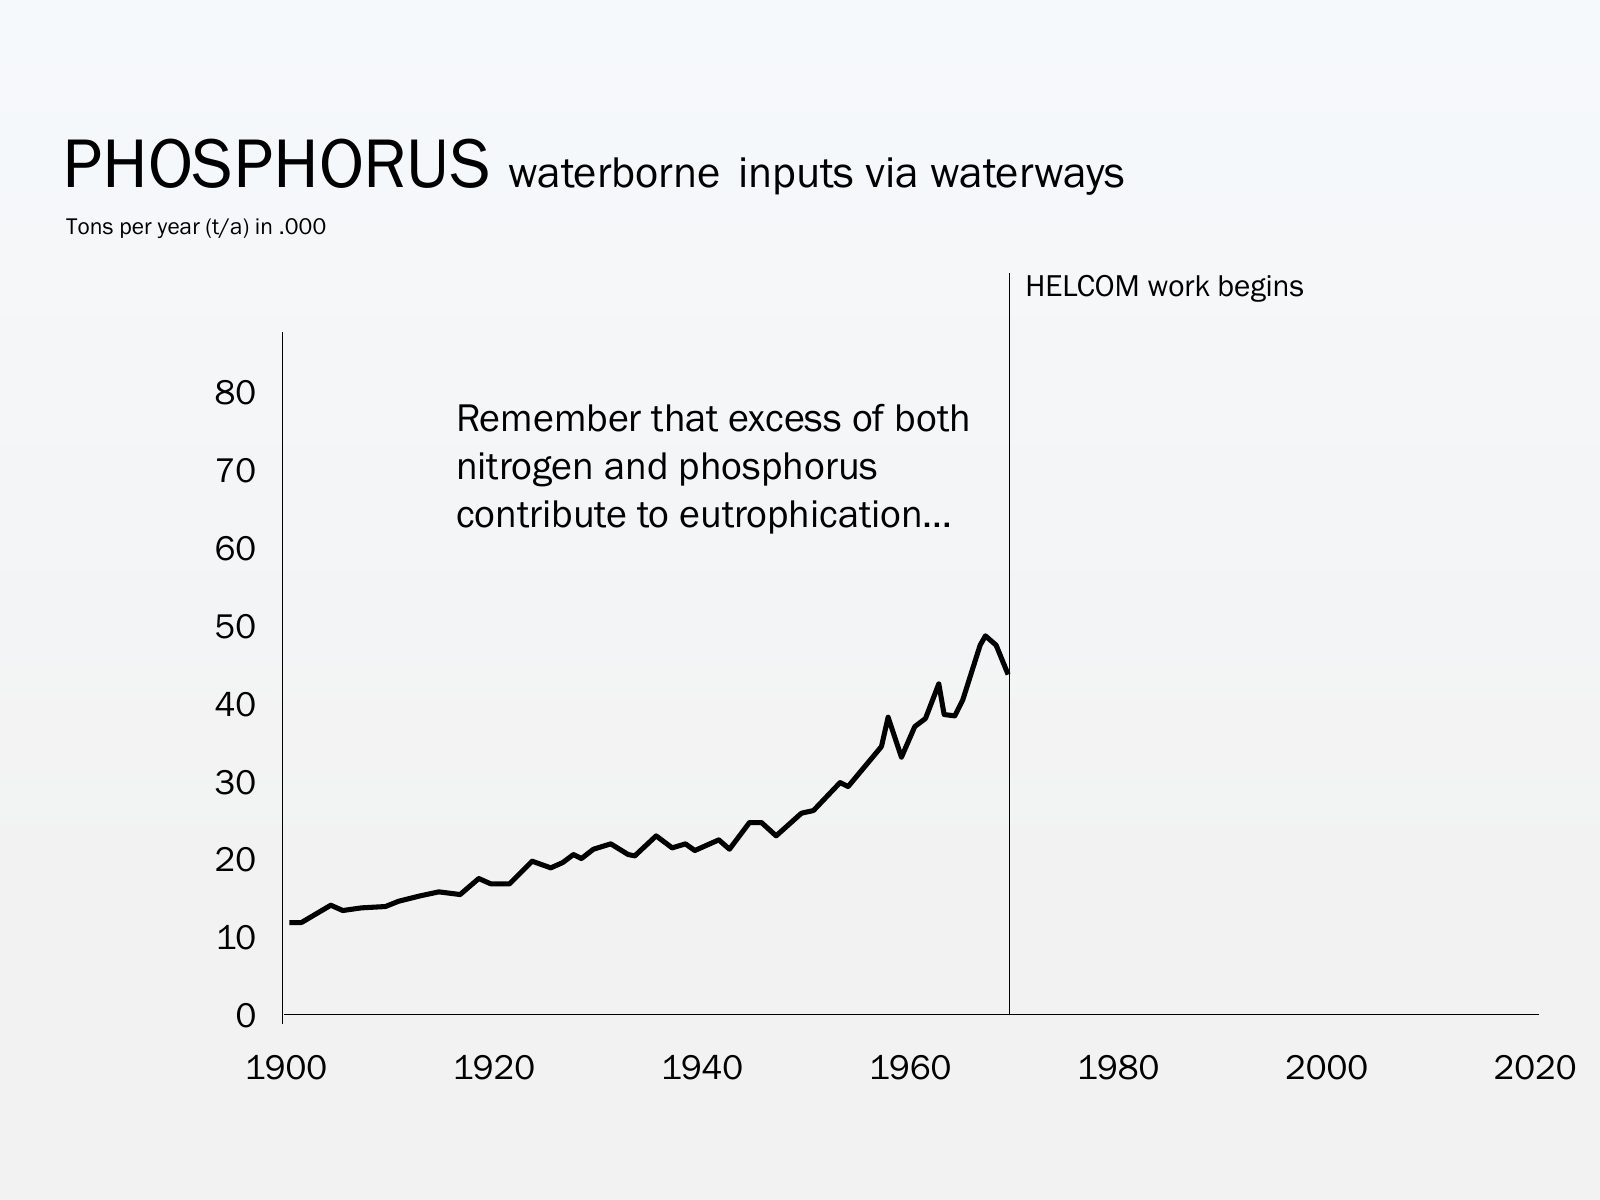
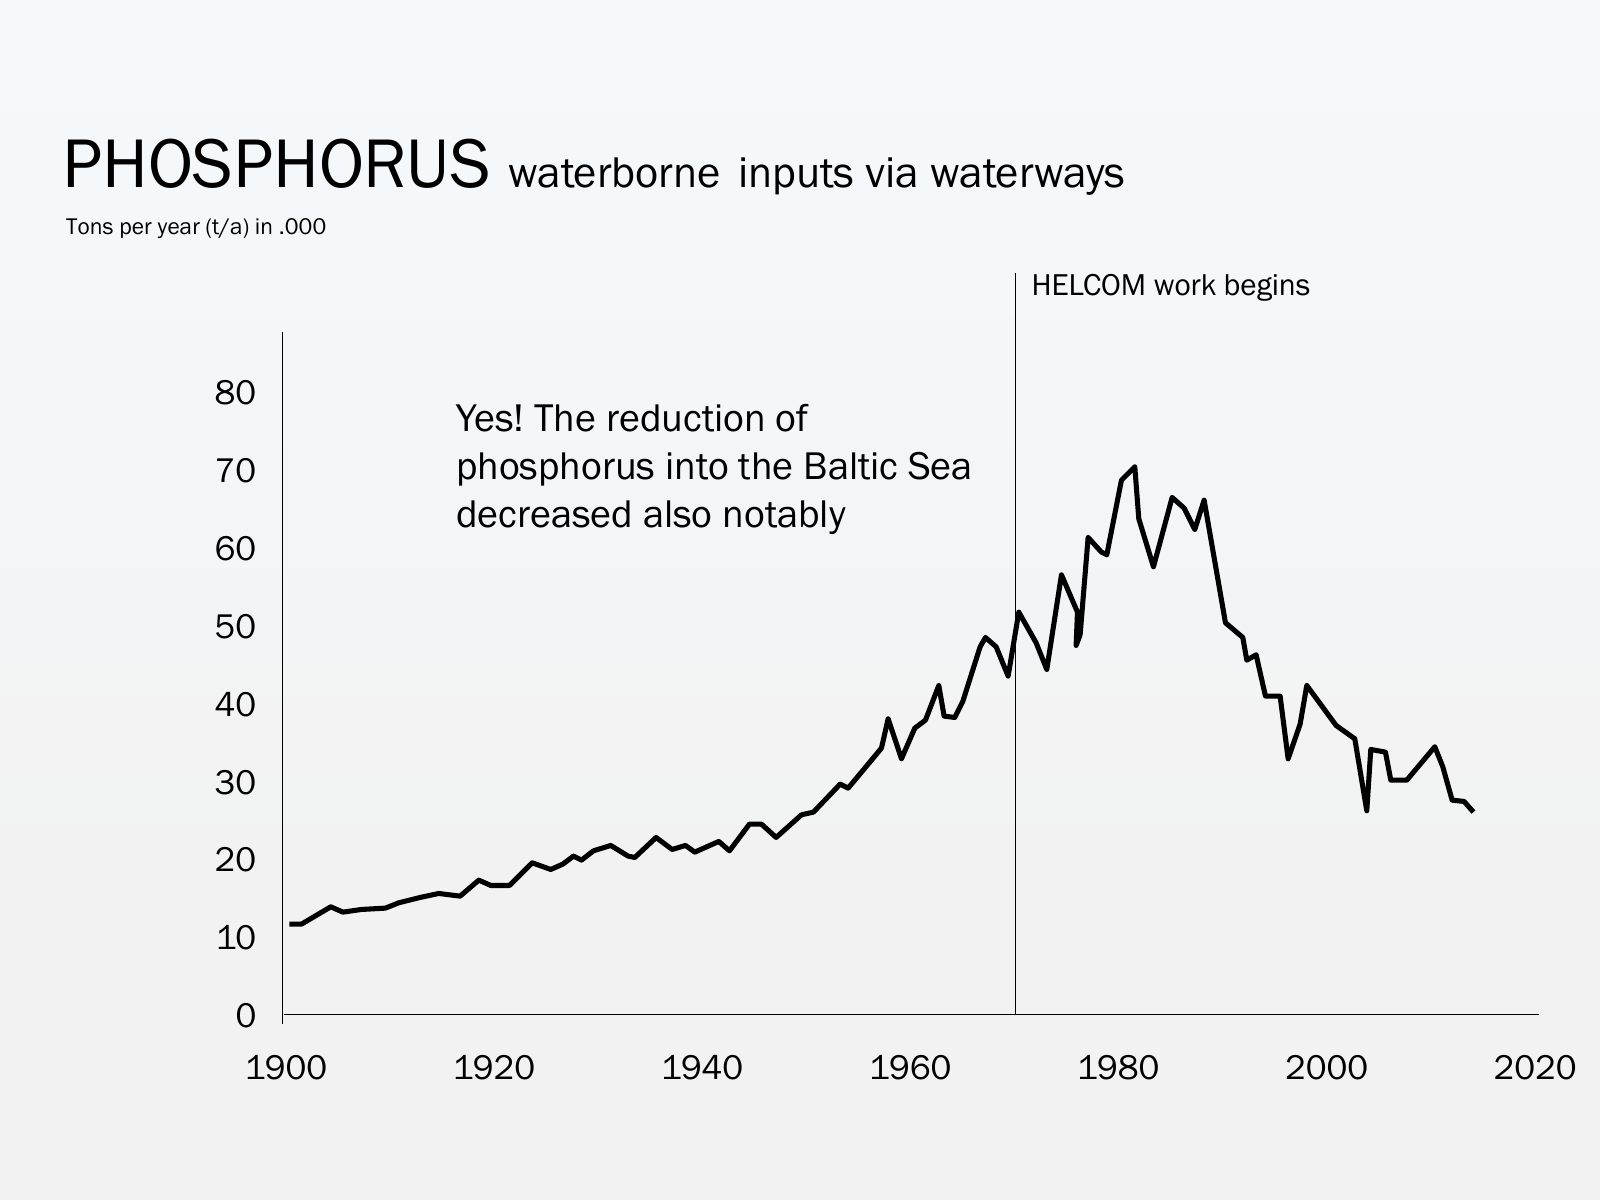
Slide 29 of 75: PHOSPHORUS waterborne inputs via waterways Tons per year (t/a) in .000 80 And also the amount 70 of phosphorus 60 50 40 30 20 10 0 1900 1920 1940 1960 1980 2…
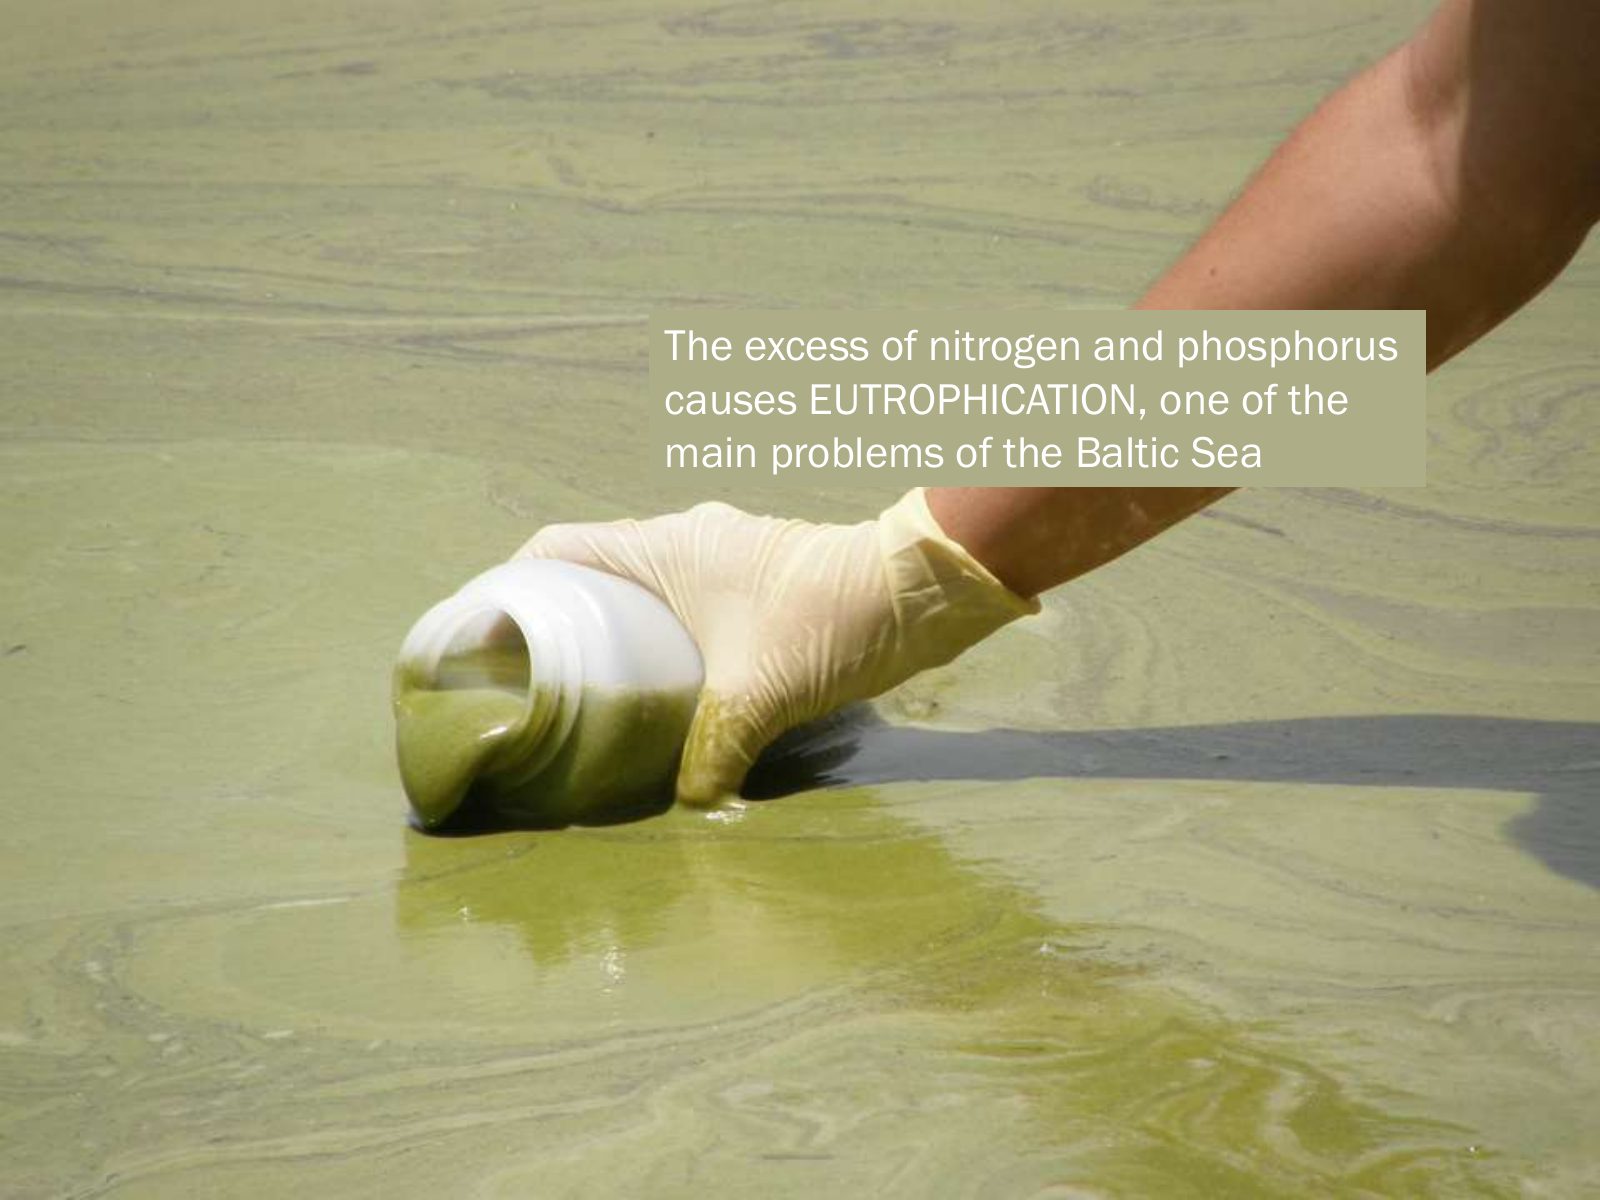
Slide 30 of 75: The excess of nitrogen and phosphorus causes EUTROPHICATION, one of the main problems of the Baltic Sea
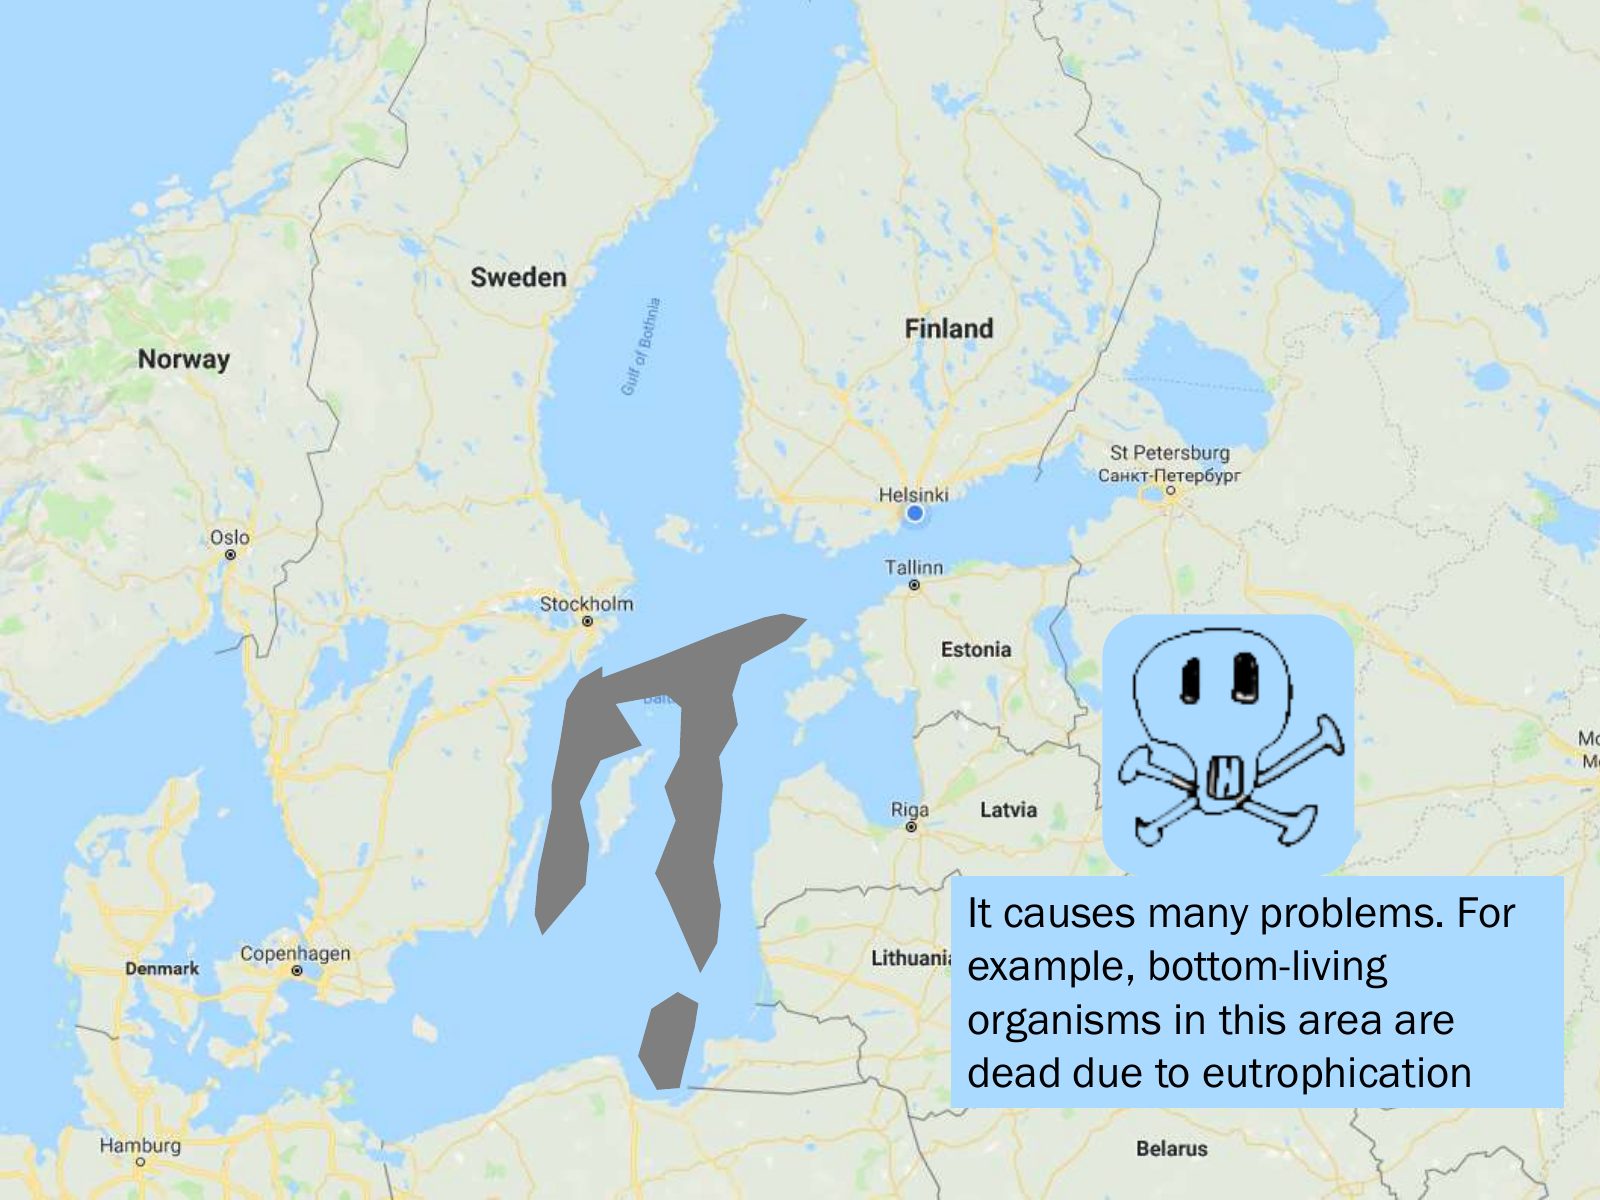
Slide 31 of 75: It causes many problems. For example, bottom-living organisms in this area are dead due to eutrophication
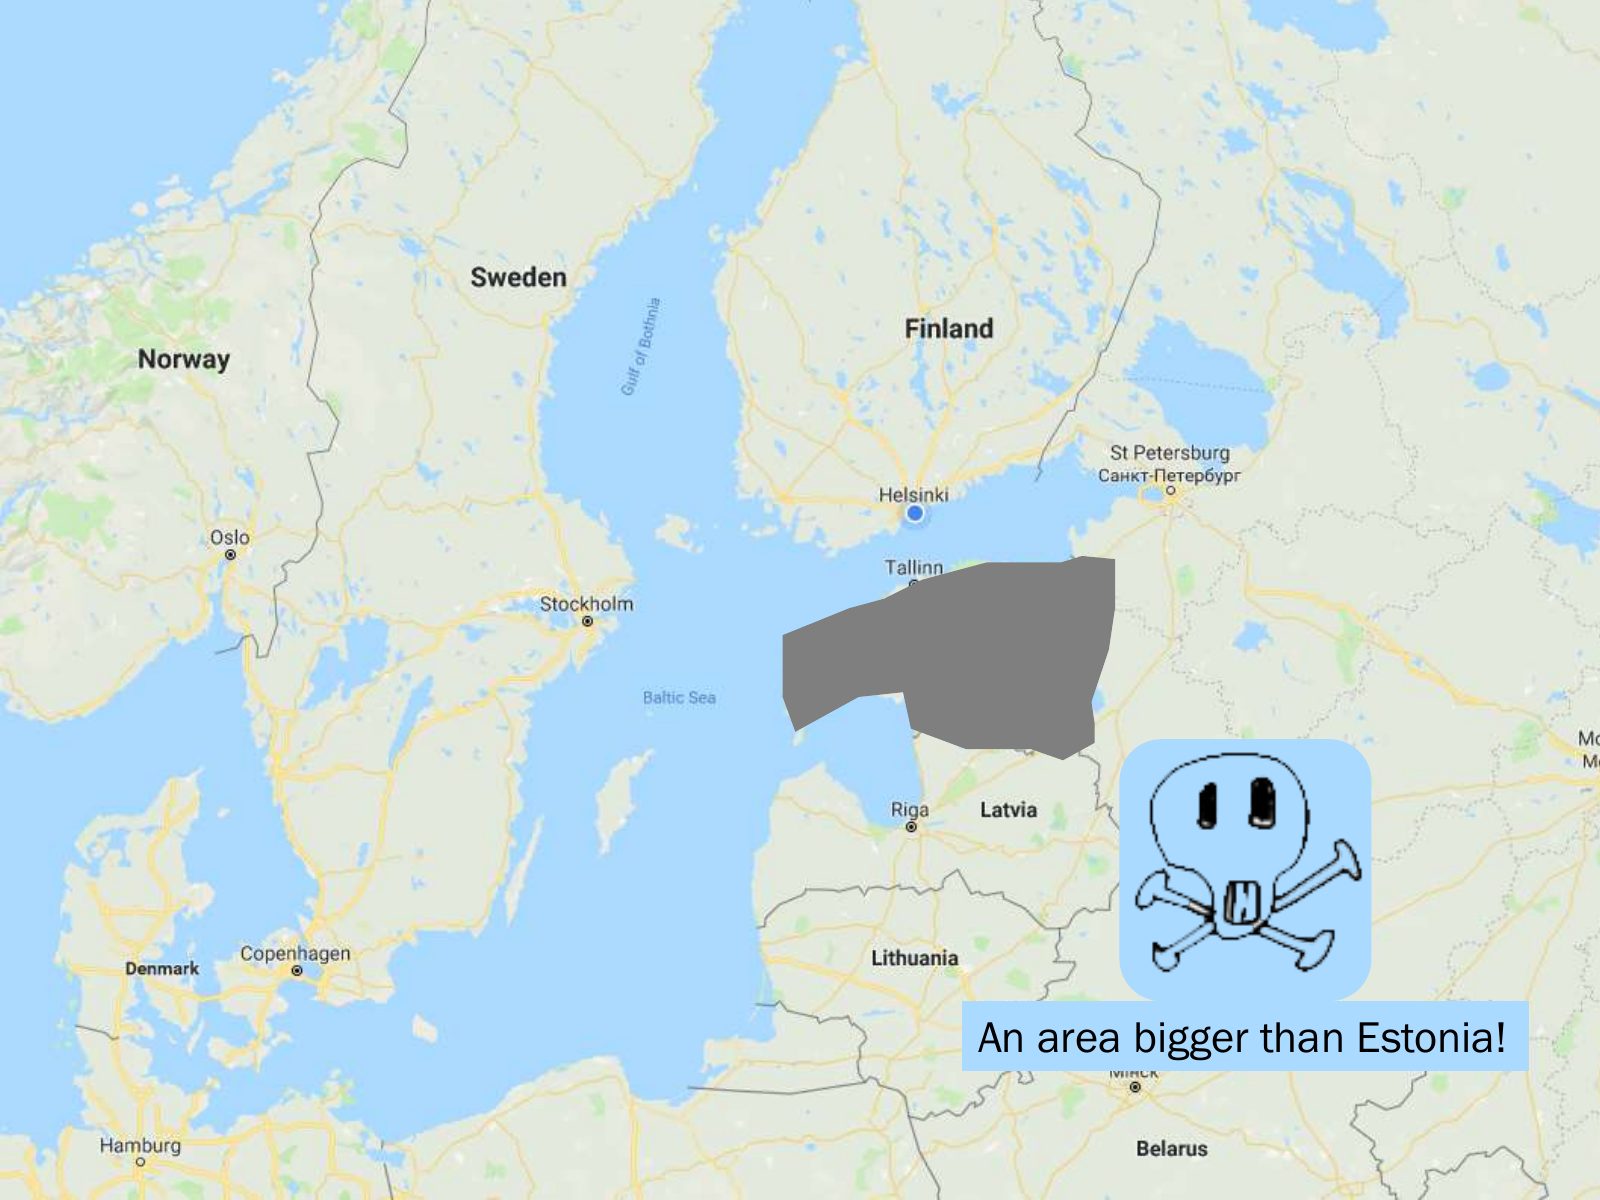
Slide 32 of 75: An area bigger than Estonia!
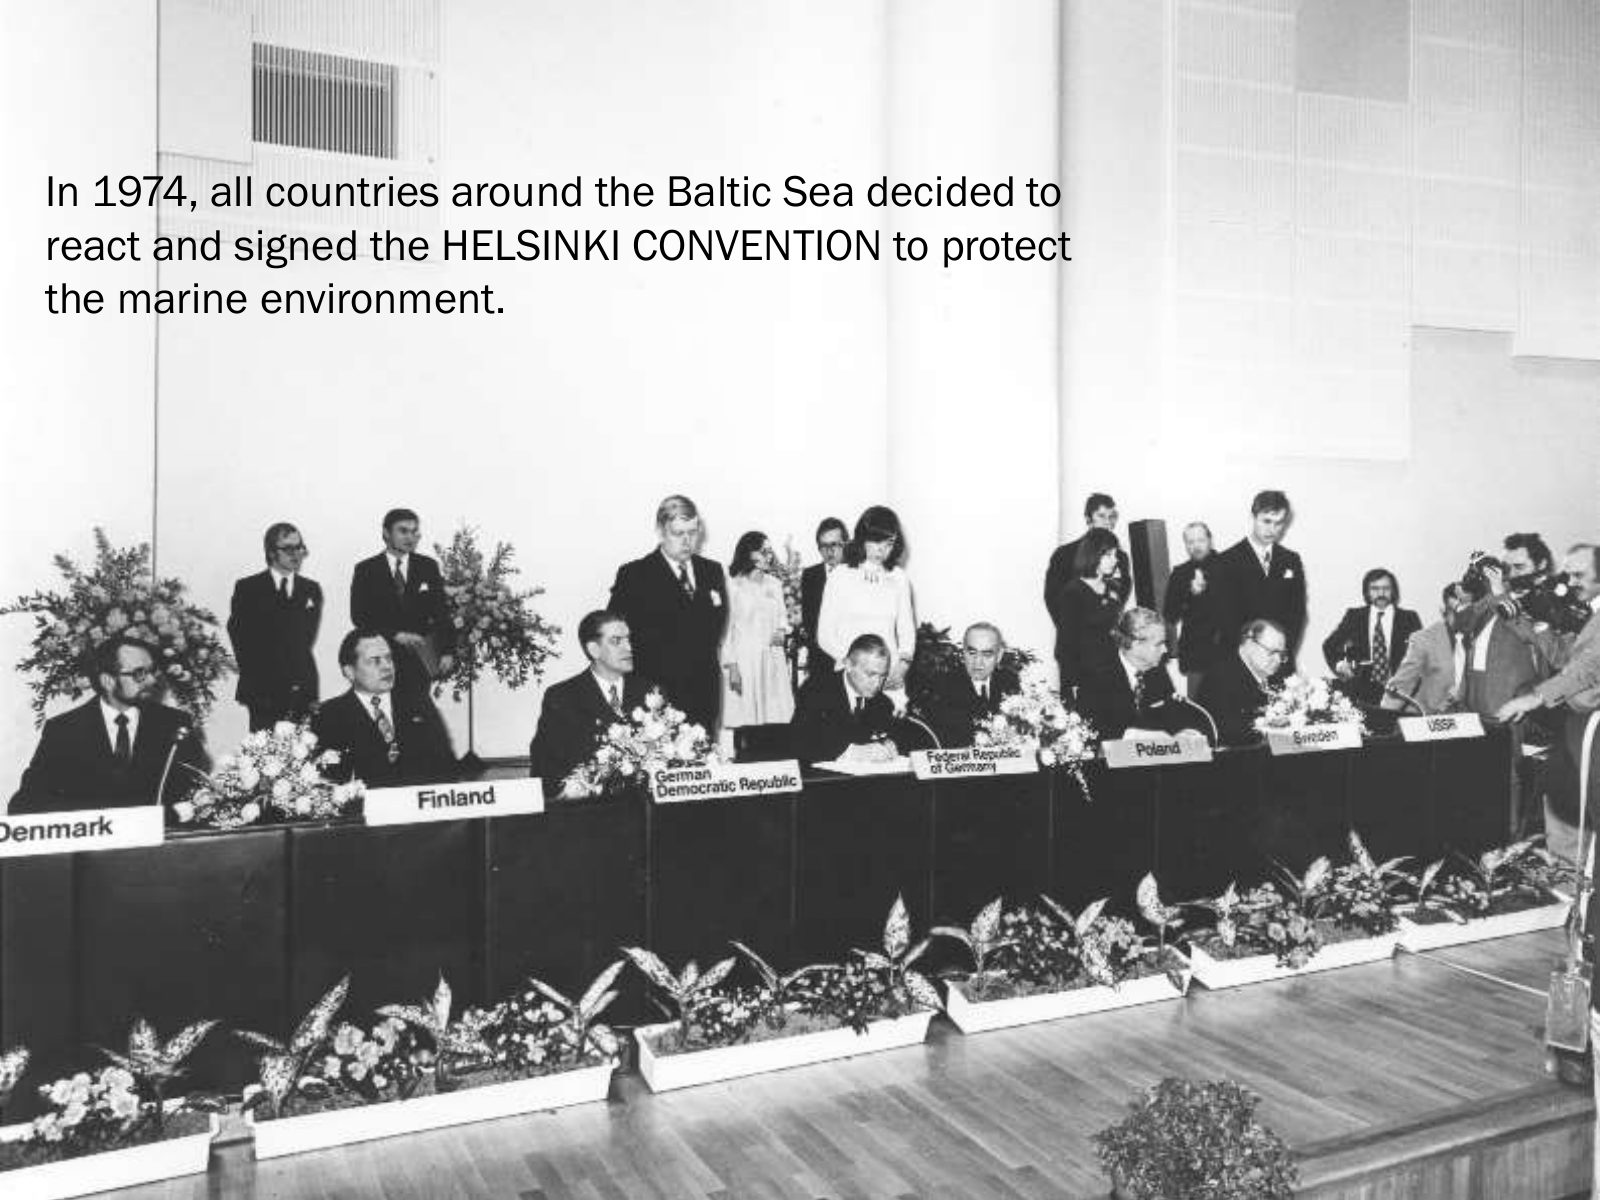
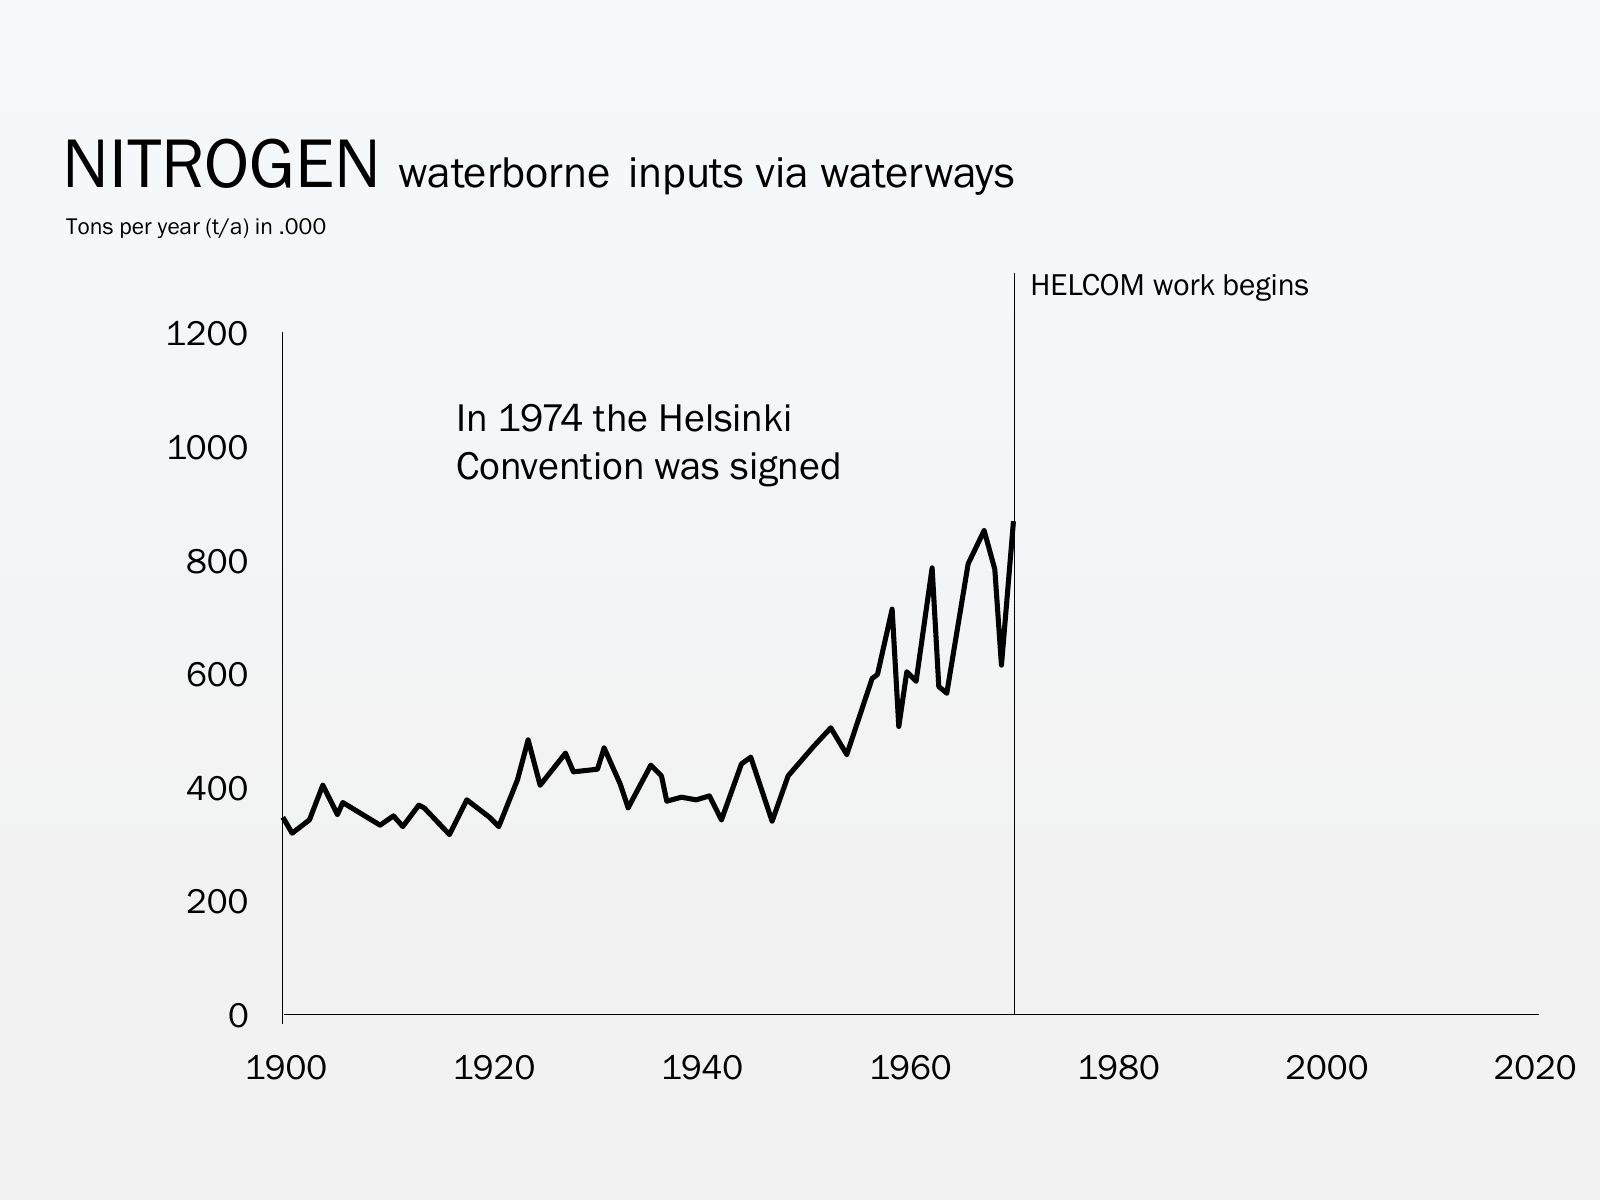
Slide 33 of 75: In 1974, all countries around the Baltic Sea decided to react and signed the HELSINKI CONVENTION to protect the marine environment.
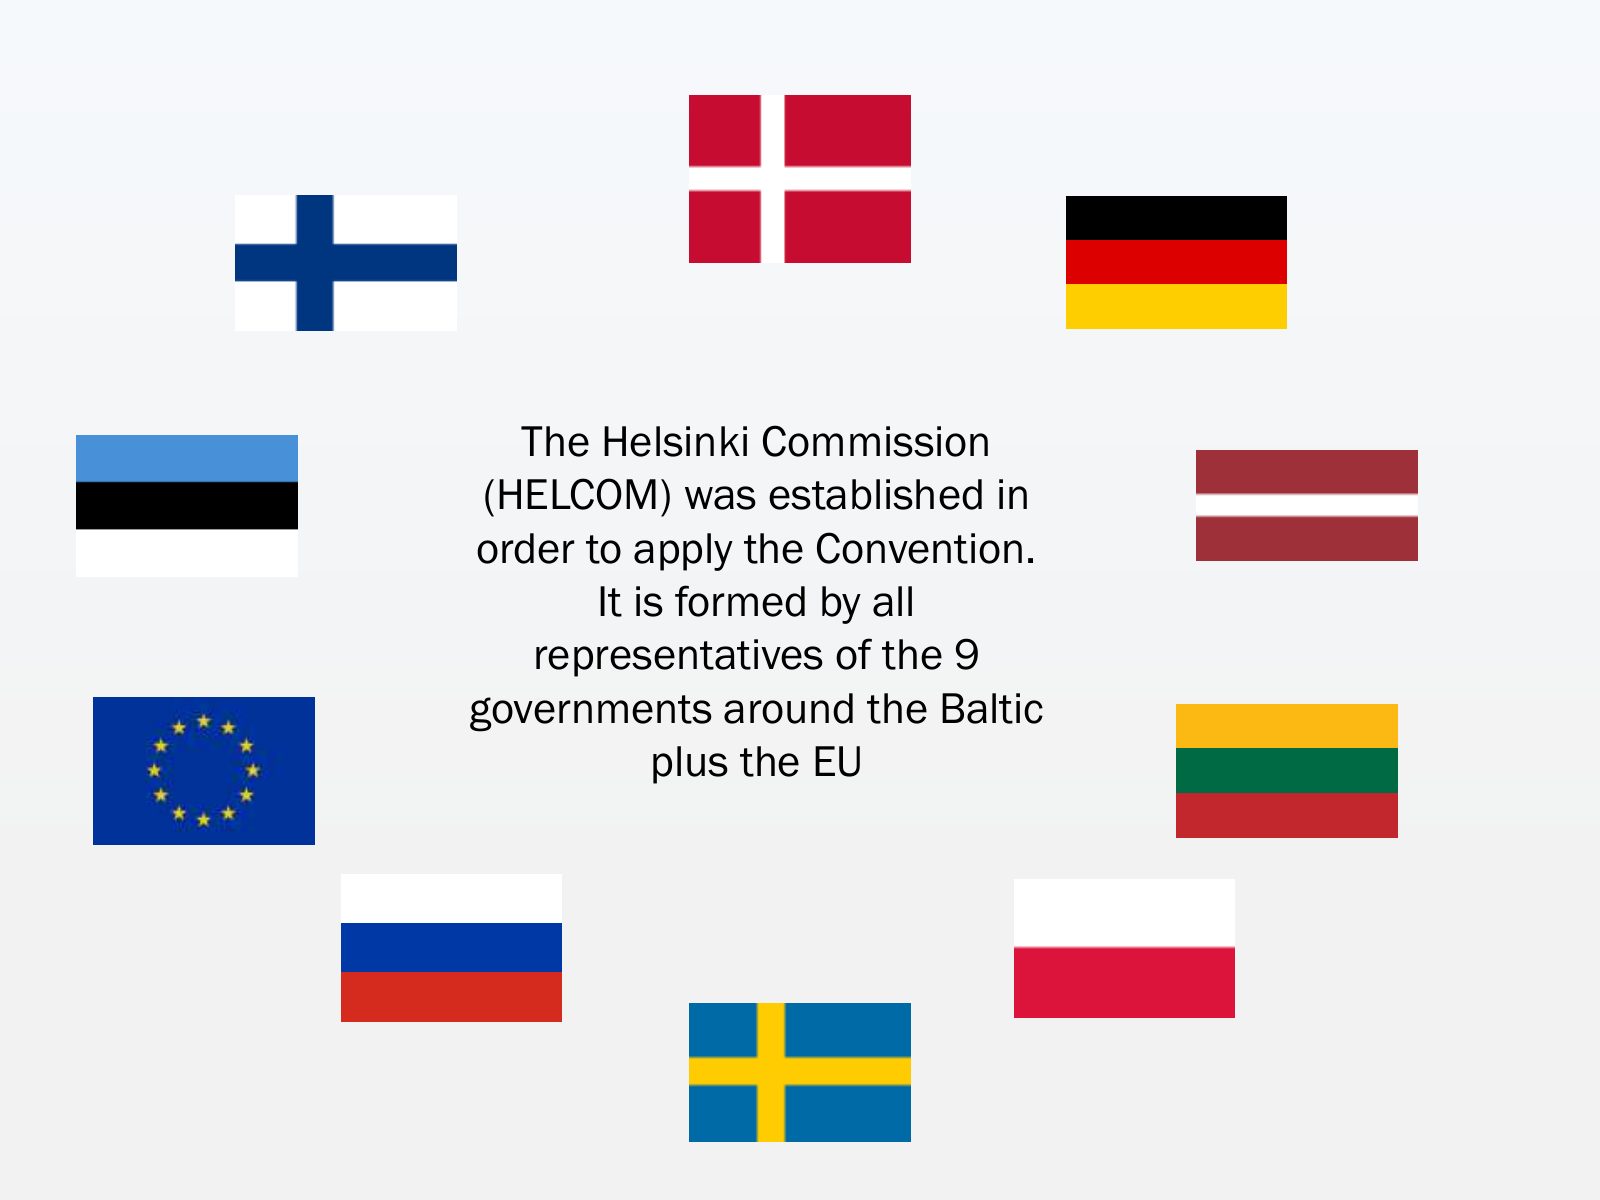
Slide 34 of 75: The Helsinki Commission (HELCOM) was established in order to apply the Convention. It is formed by all representatives of the 9 governments around the Baltic…
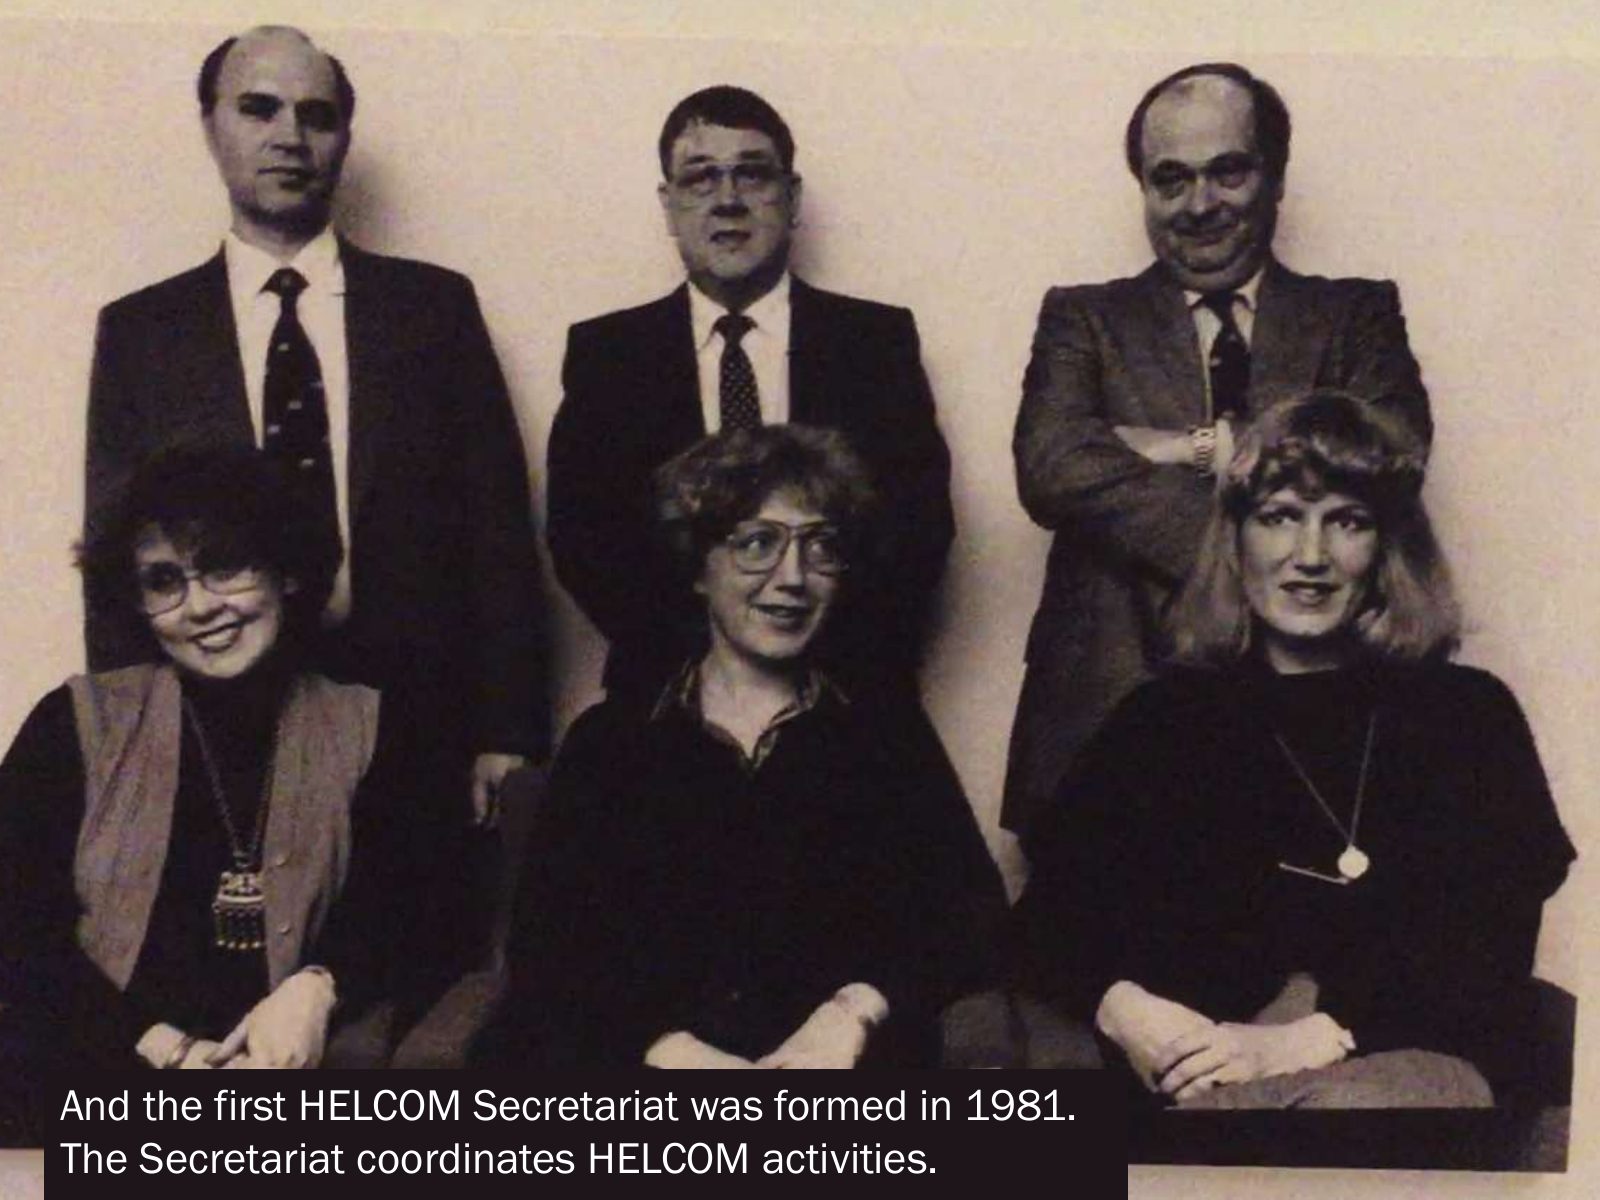
Slide 35 of 75: And the first HELCOM Secretariat was formed in 1981. The Secretariat coordinates HELCOM activities.
Slide 36 of 75: Now you know about HELCOM... Scientists and policy-makers together to save the Baltic Sea
Slide 37 of 75: But this is a workshop about data visualization. The scientific community need to visualize data in a way that policy-makers can understand

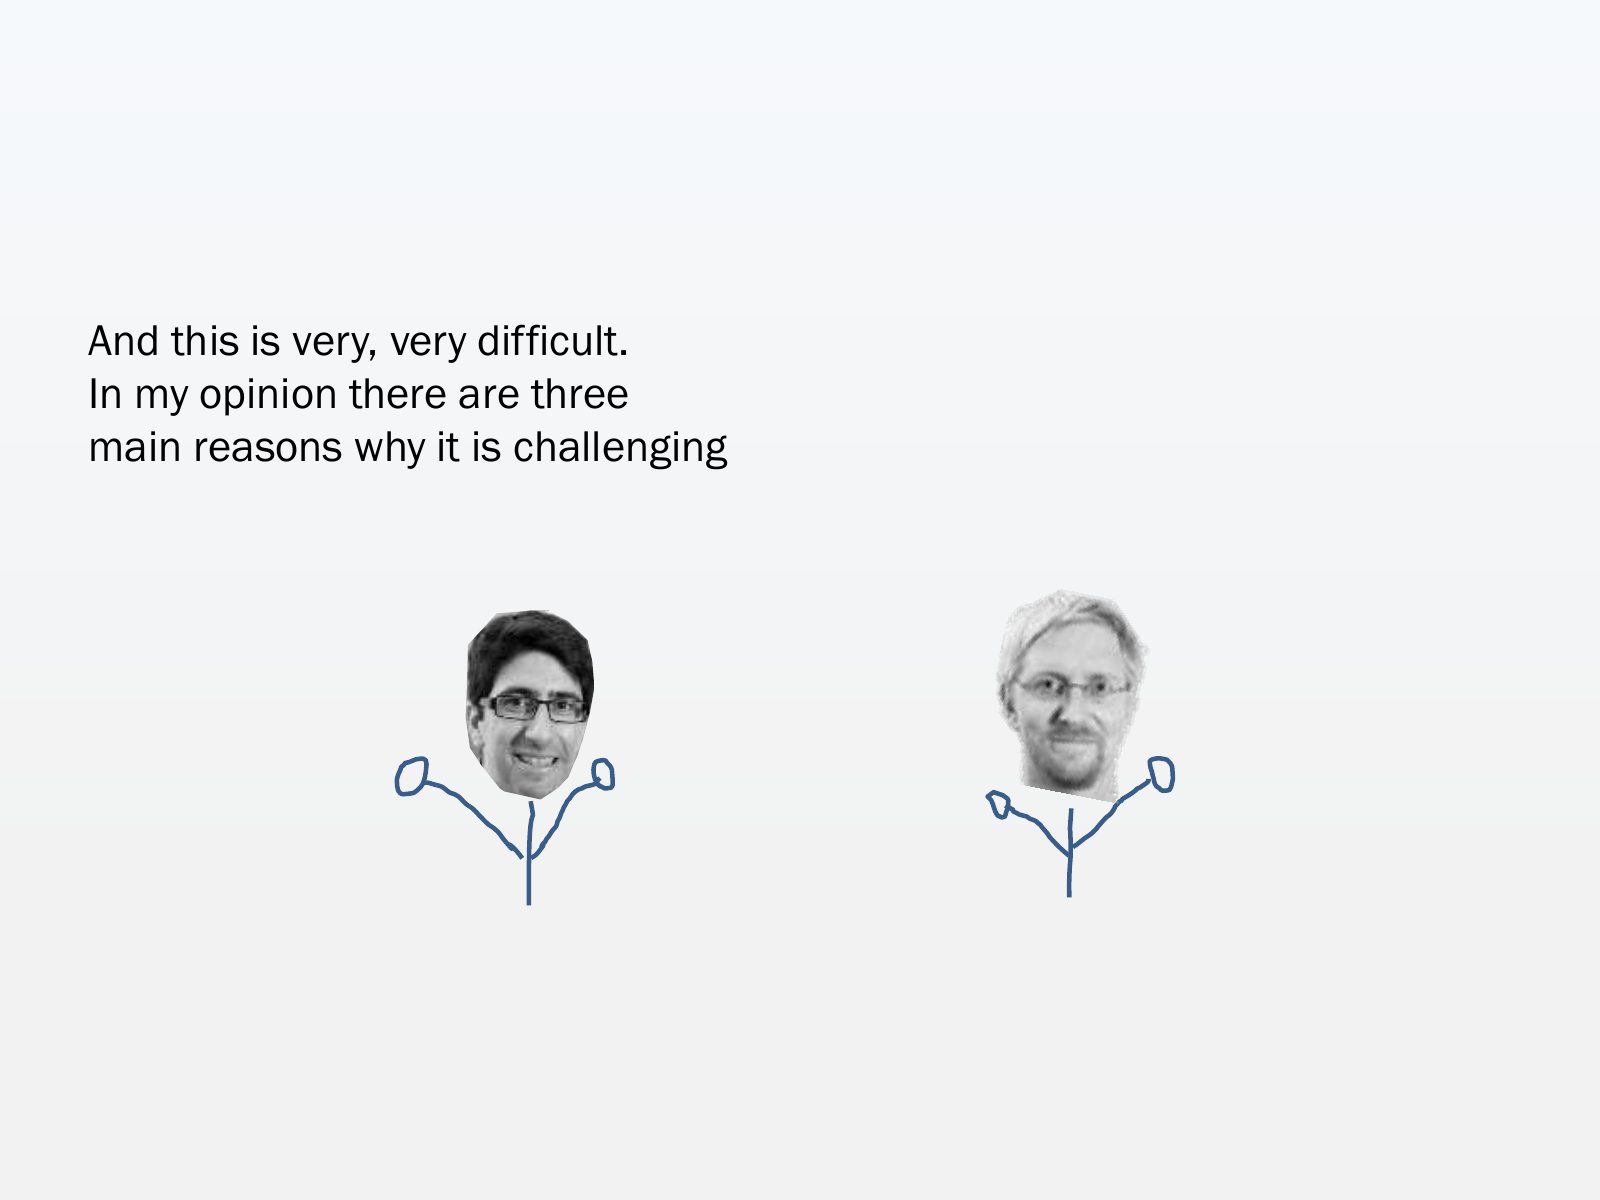
Slide 38 of 75: And this is very, very difficult. In my opinion there are three main reasons why it is challenging
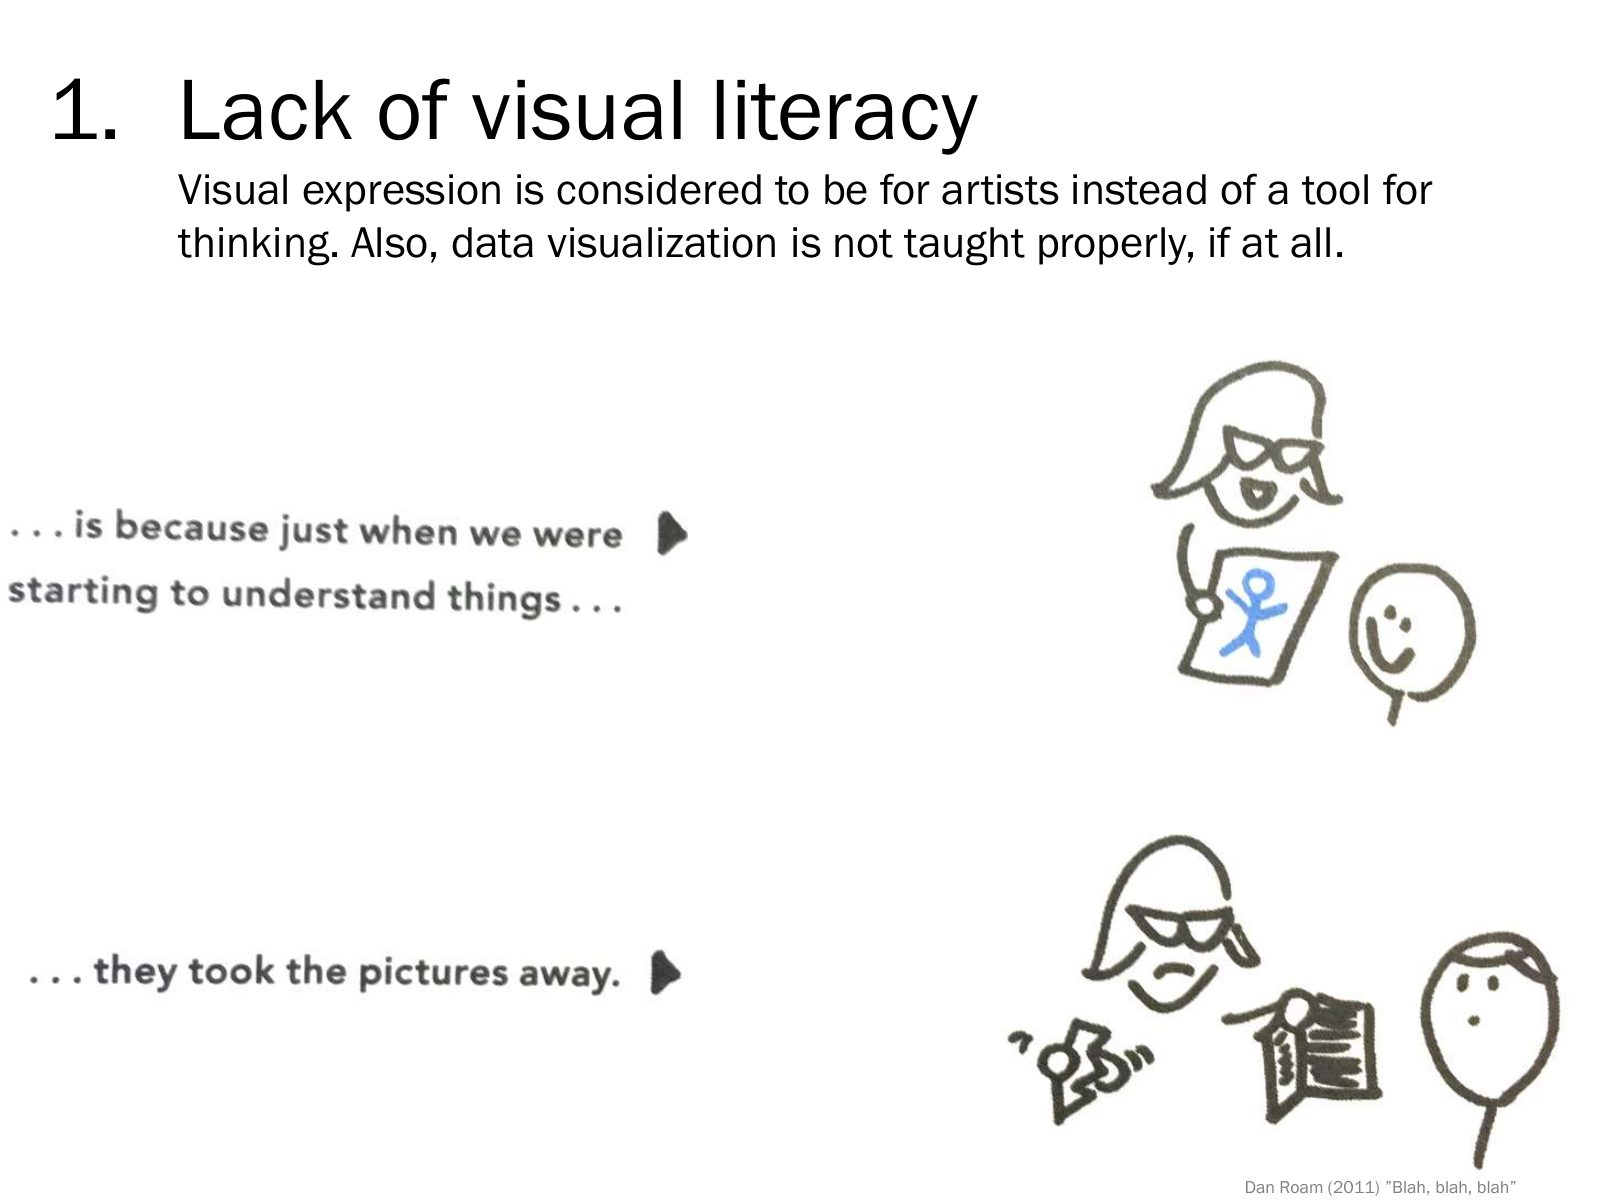
Slide 39 of 75: 1. Lack of visual literacy Visual expression is considered to be for artists instead of a tool for thinking. Also, data visualization is not taught properly,…
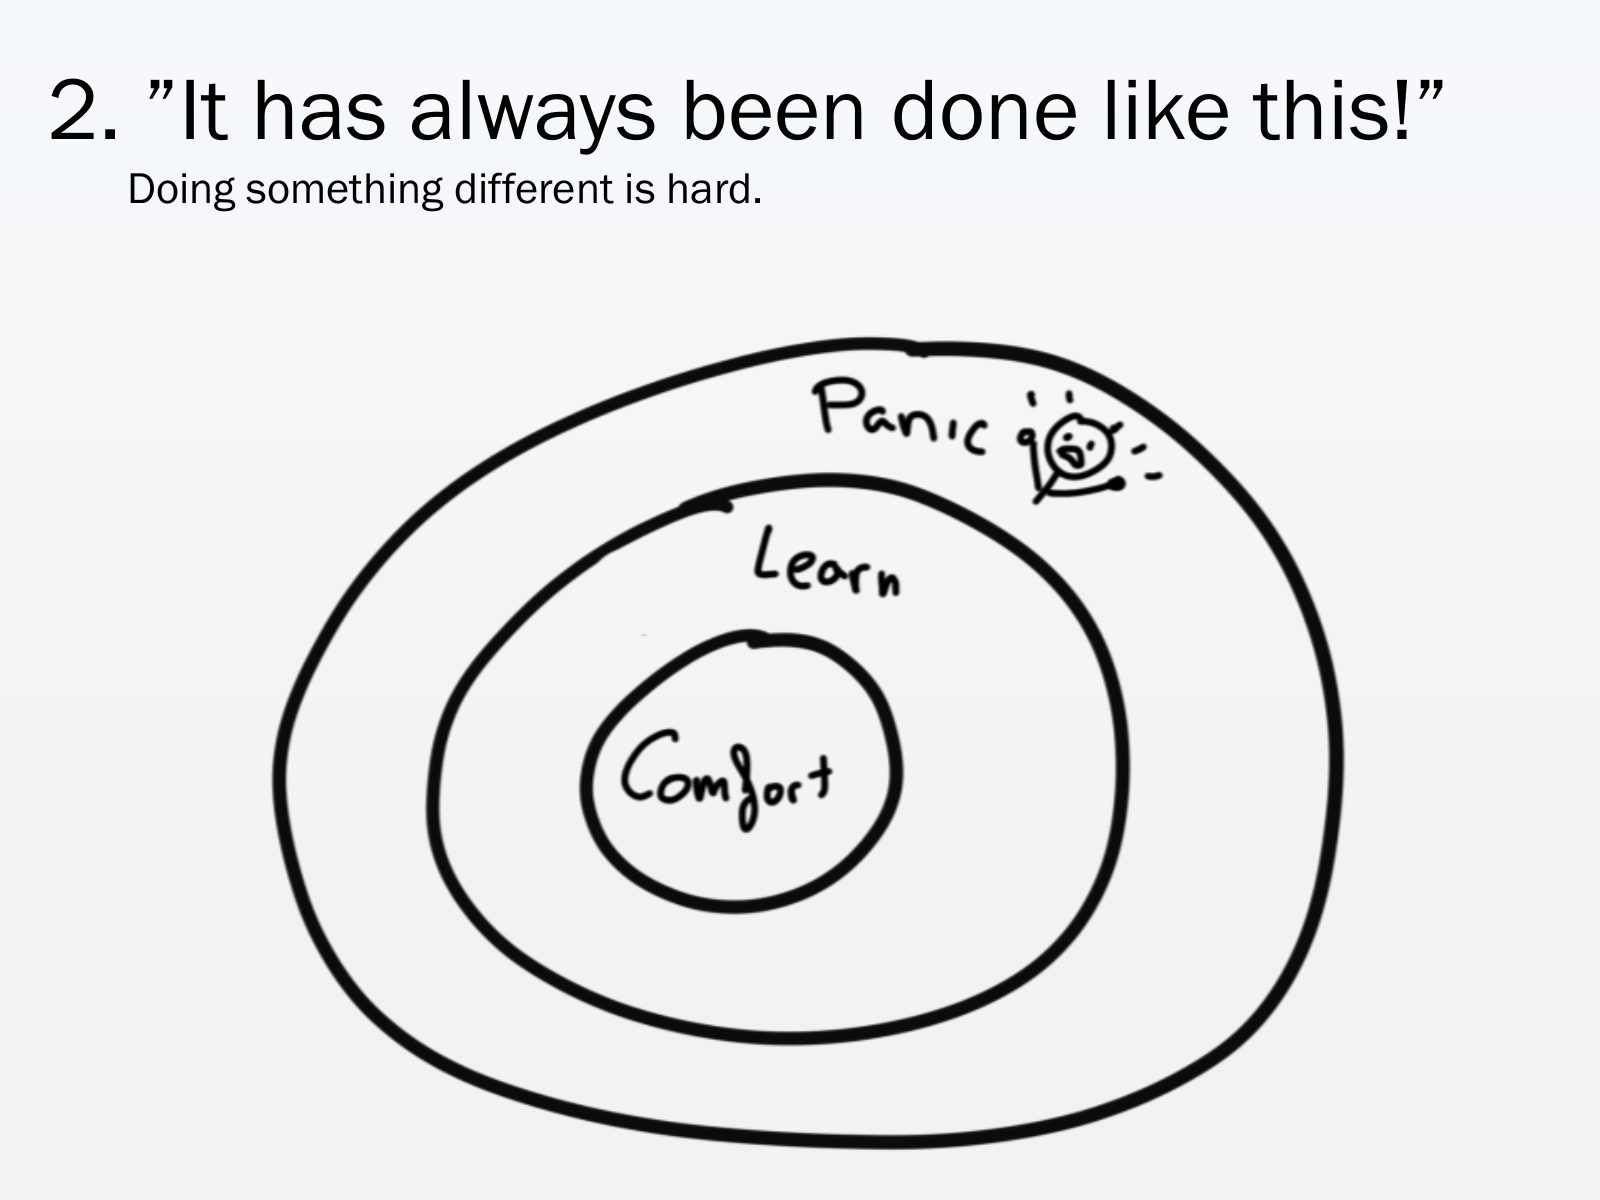
Slide 40 of 75: 2. ”It has always been done like this!” Doing something different is hard.
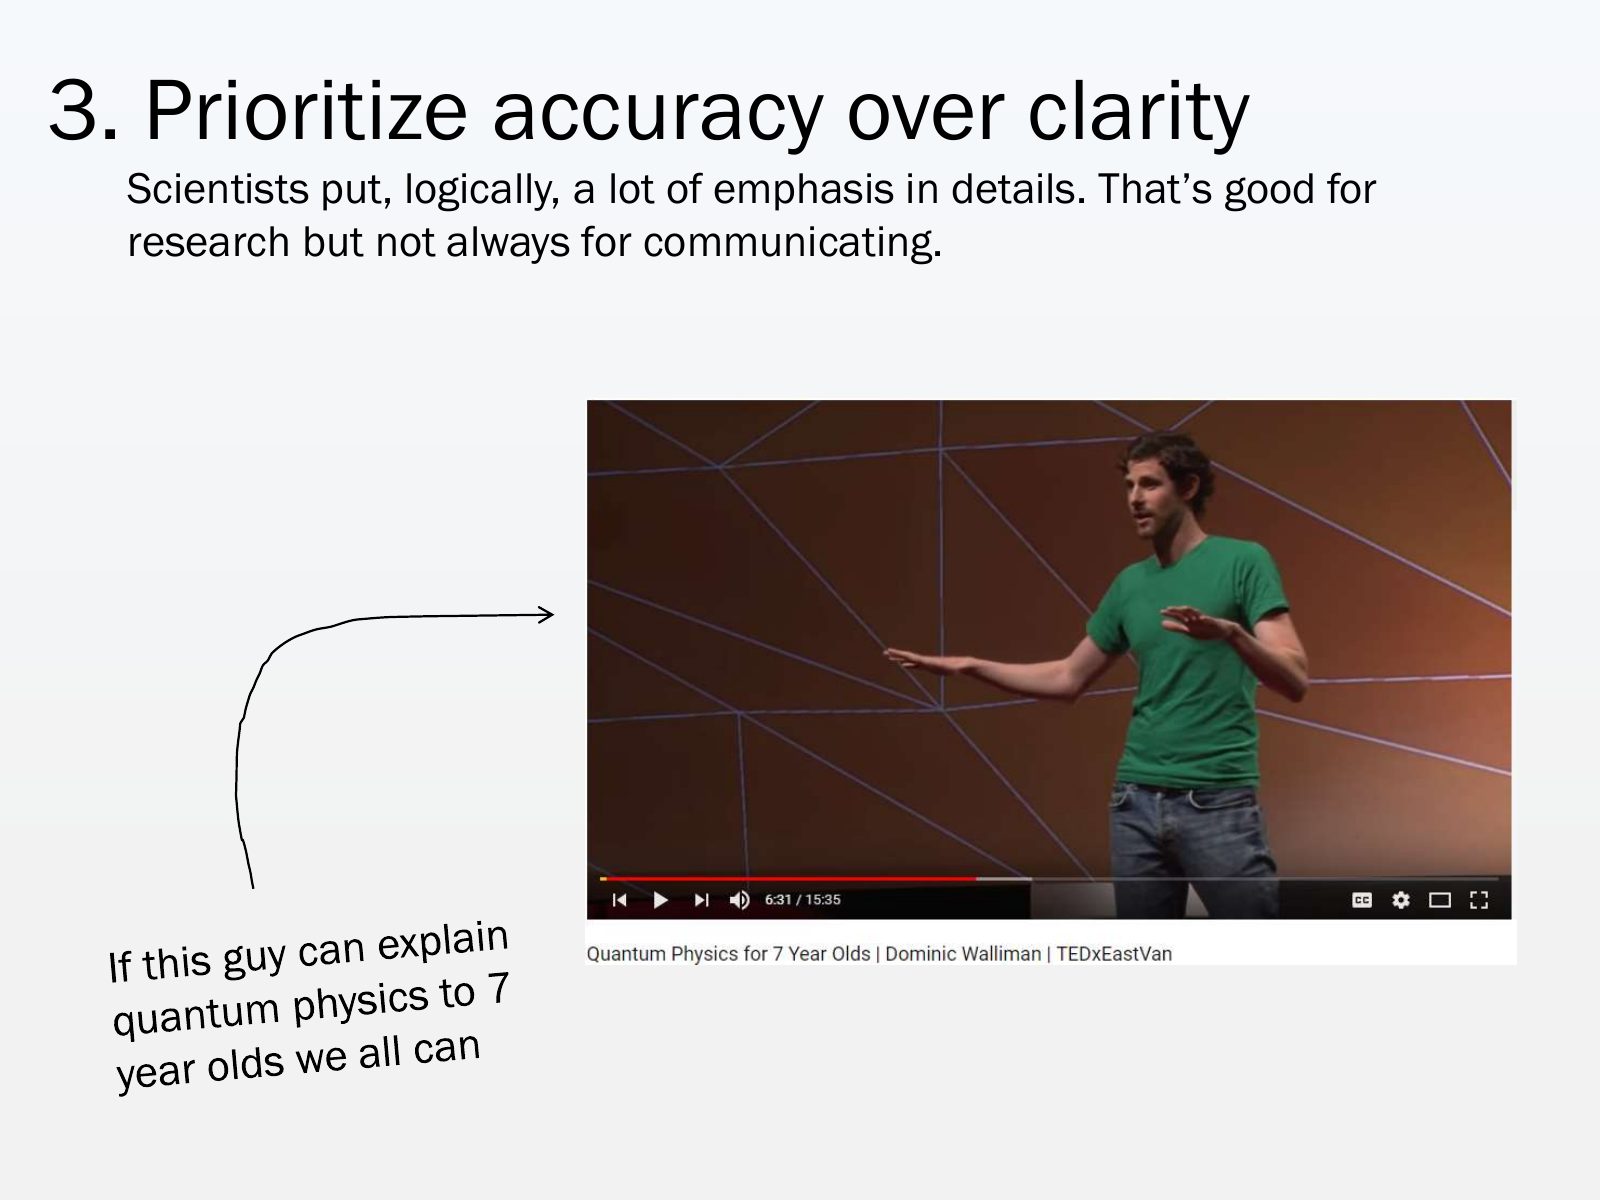
Slide 41 of 75: 3. Prioritize accuracy over clarity Scientists put, logically, a lot of emphasis in details. That’s good for research but not always for communicating.
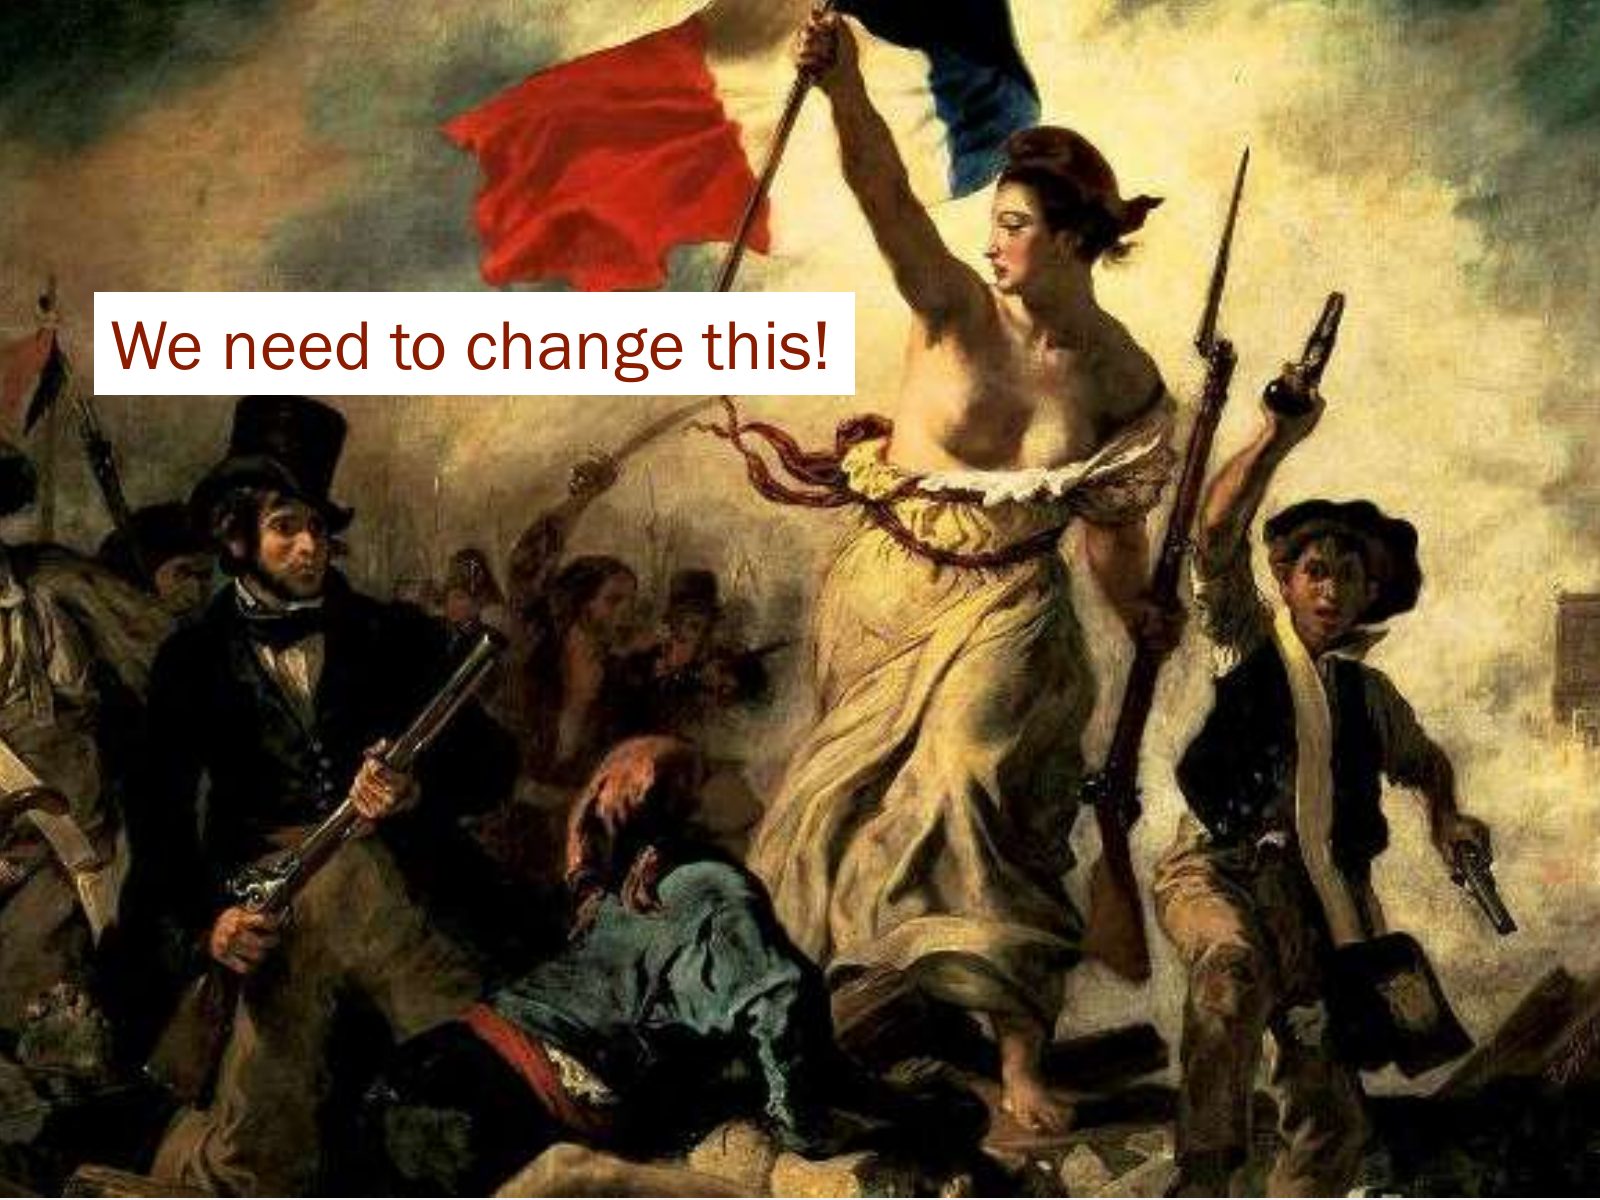
Slide 42 of 75: We need to change this!
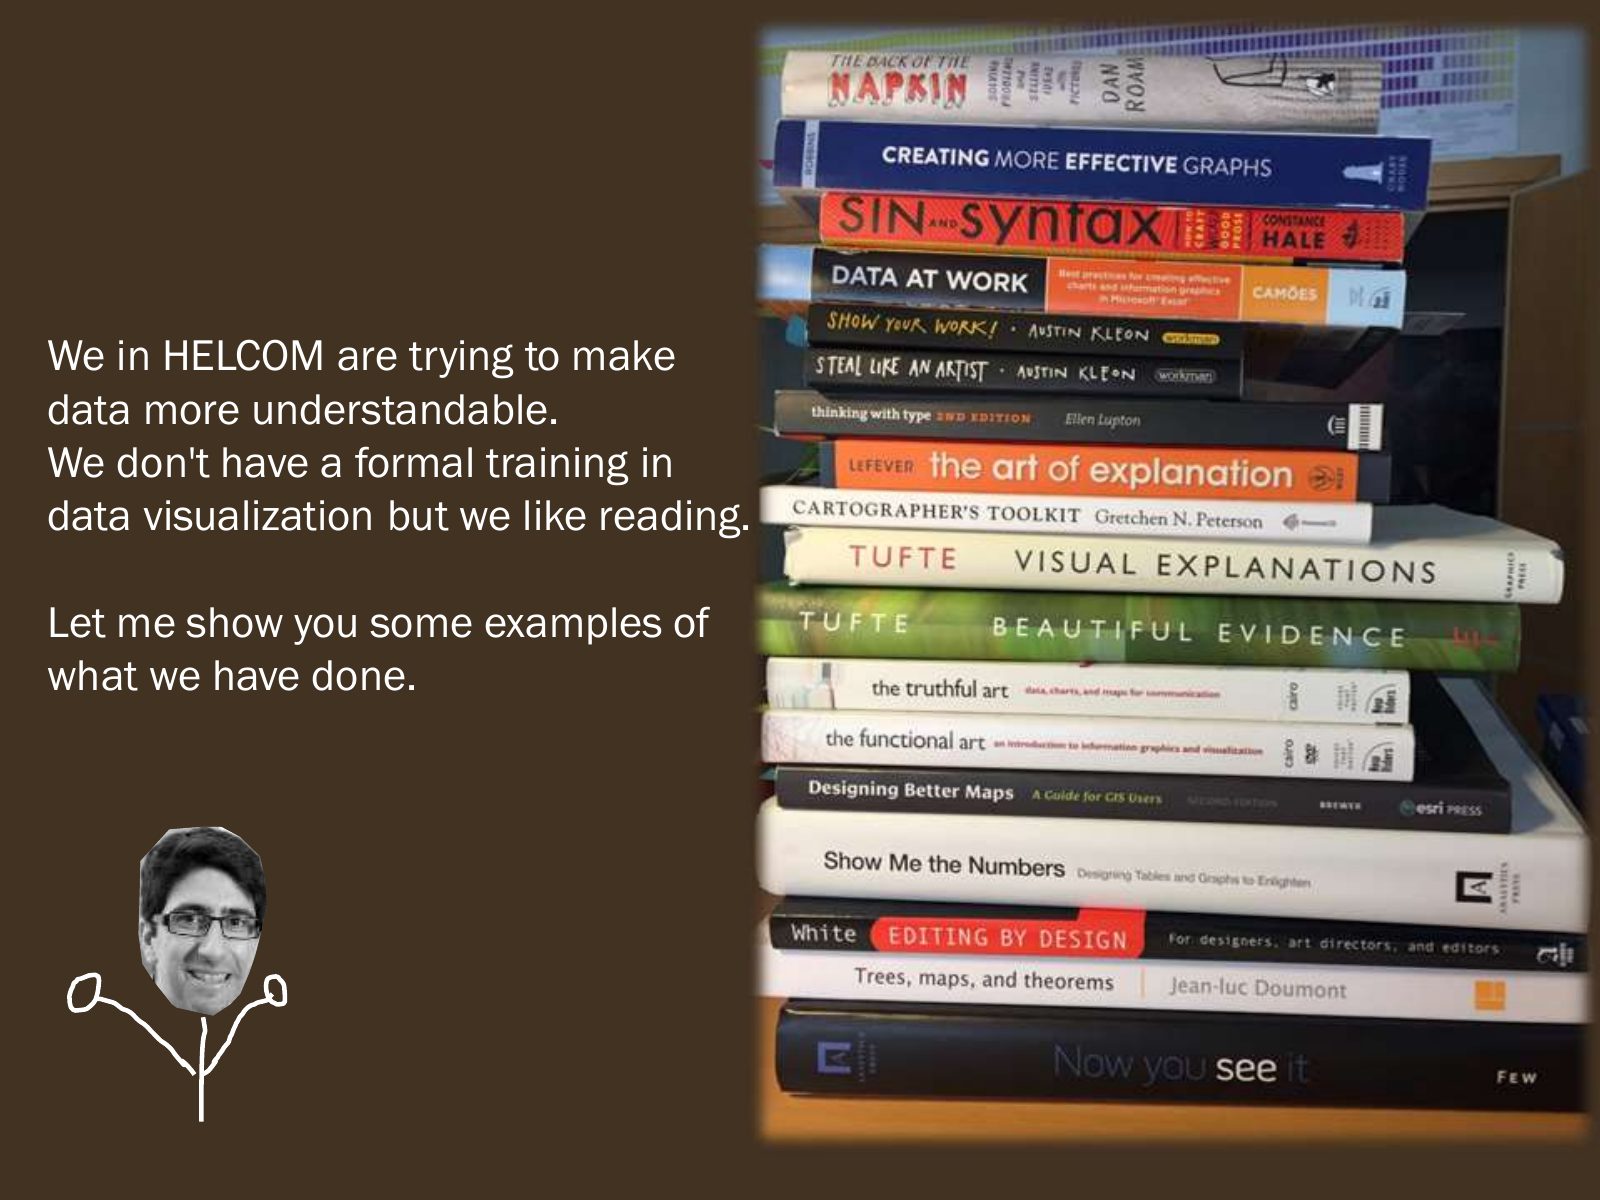
Slide 43 of 75: We in HELCOM are trying to make data more understandable. We don't have a formal training in data visualization but we like reading. Let me show you some exa…
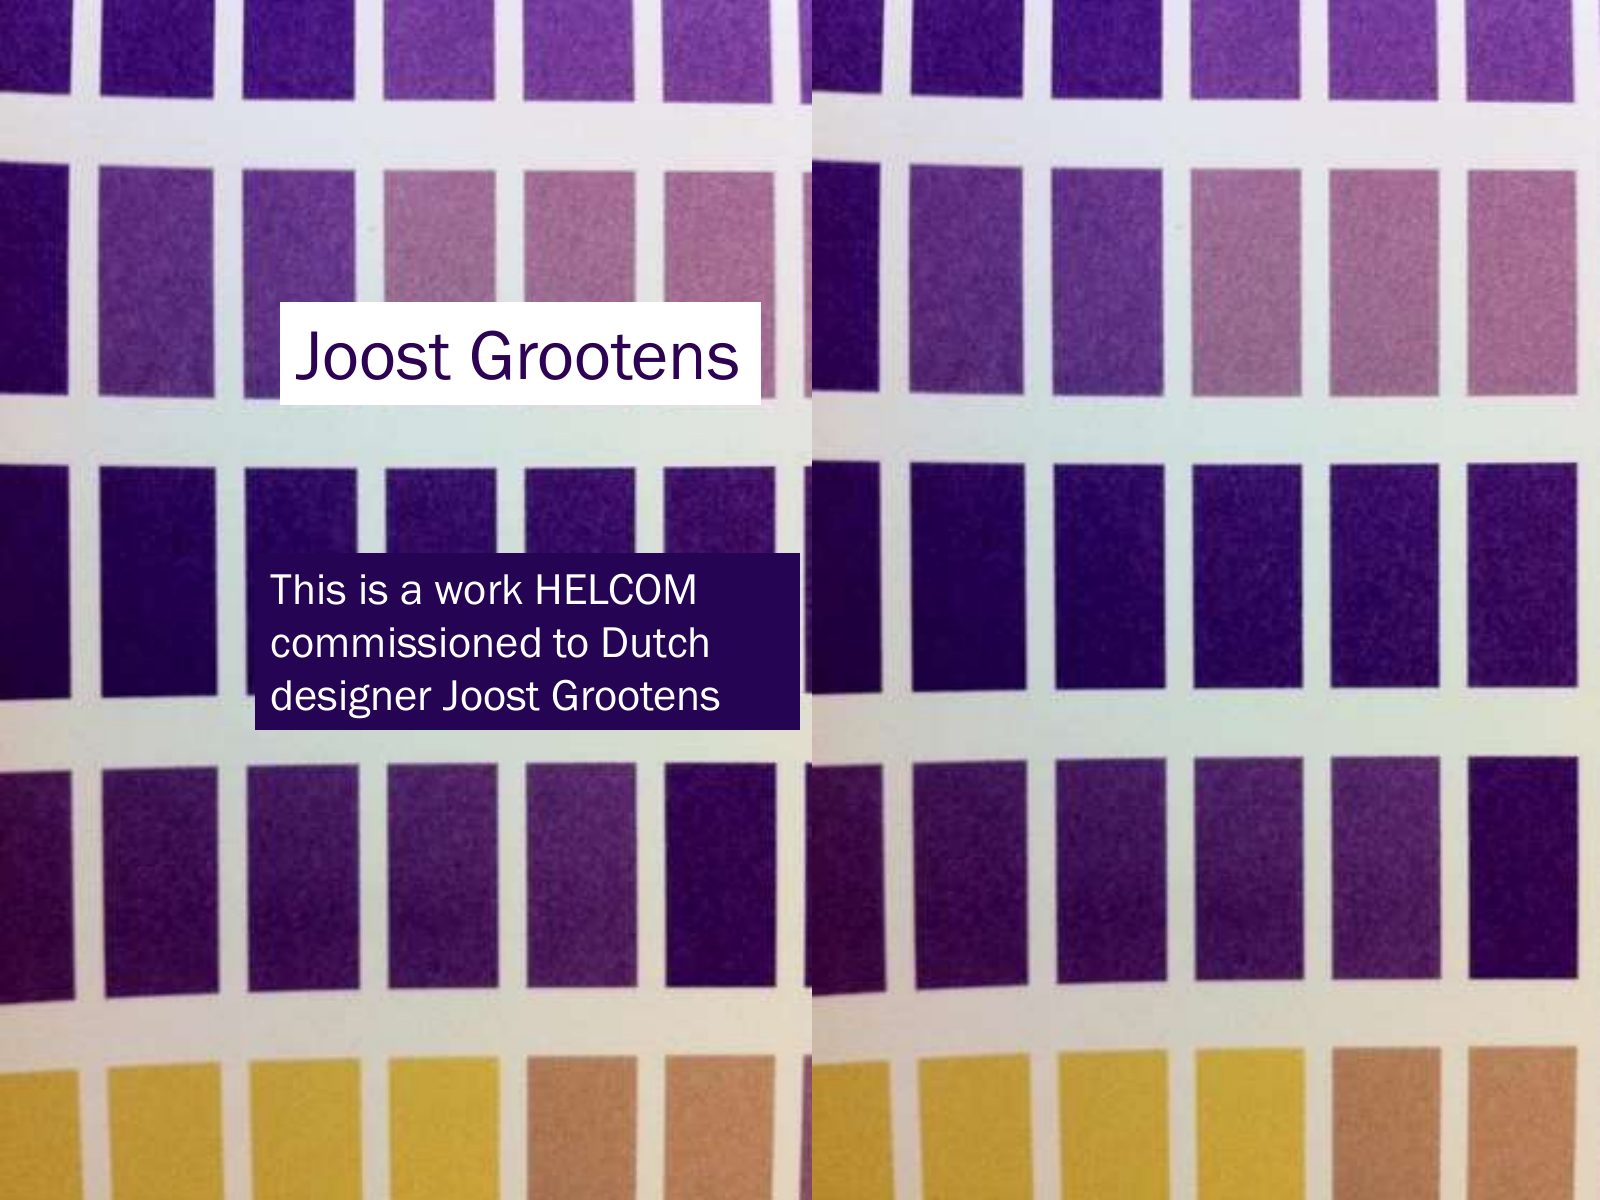
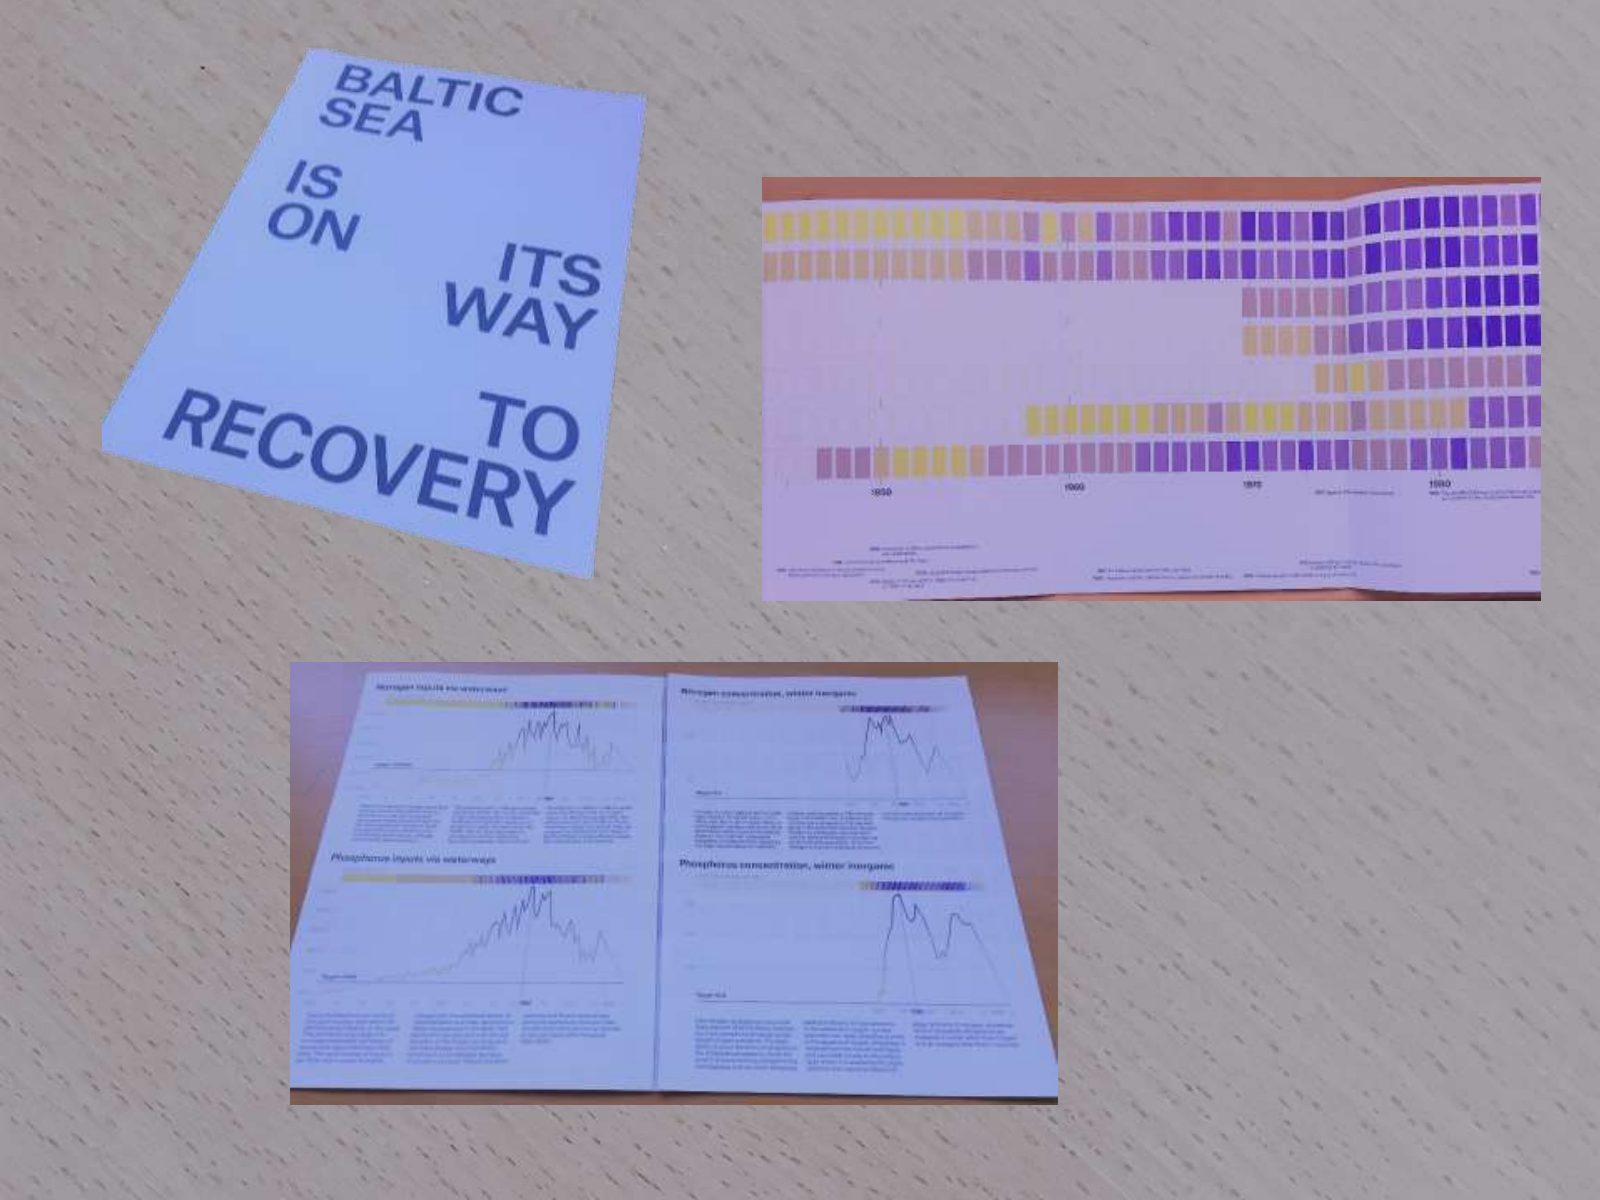
Slide 44 of 75: Joost Grootens This is a work HELCOM commissioned to Dutch designer Joost Grootens
Slide 45 of 75: picture slide without text
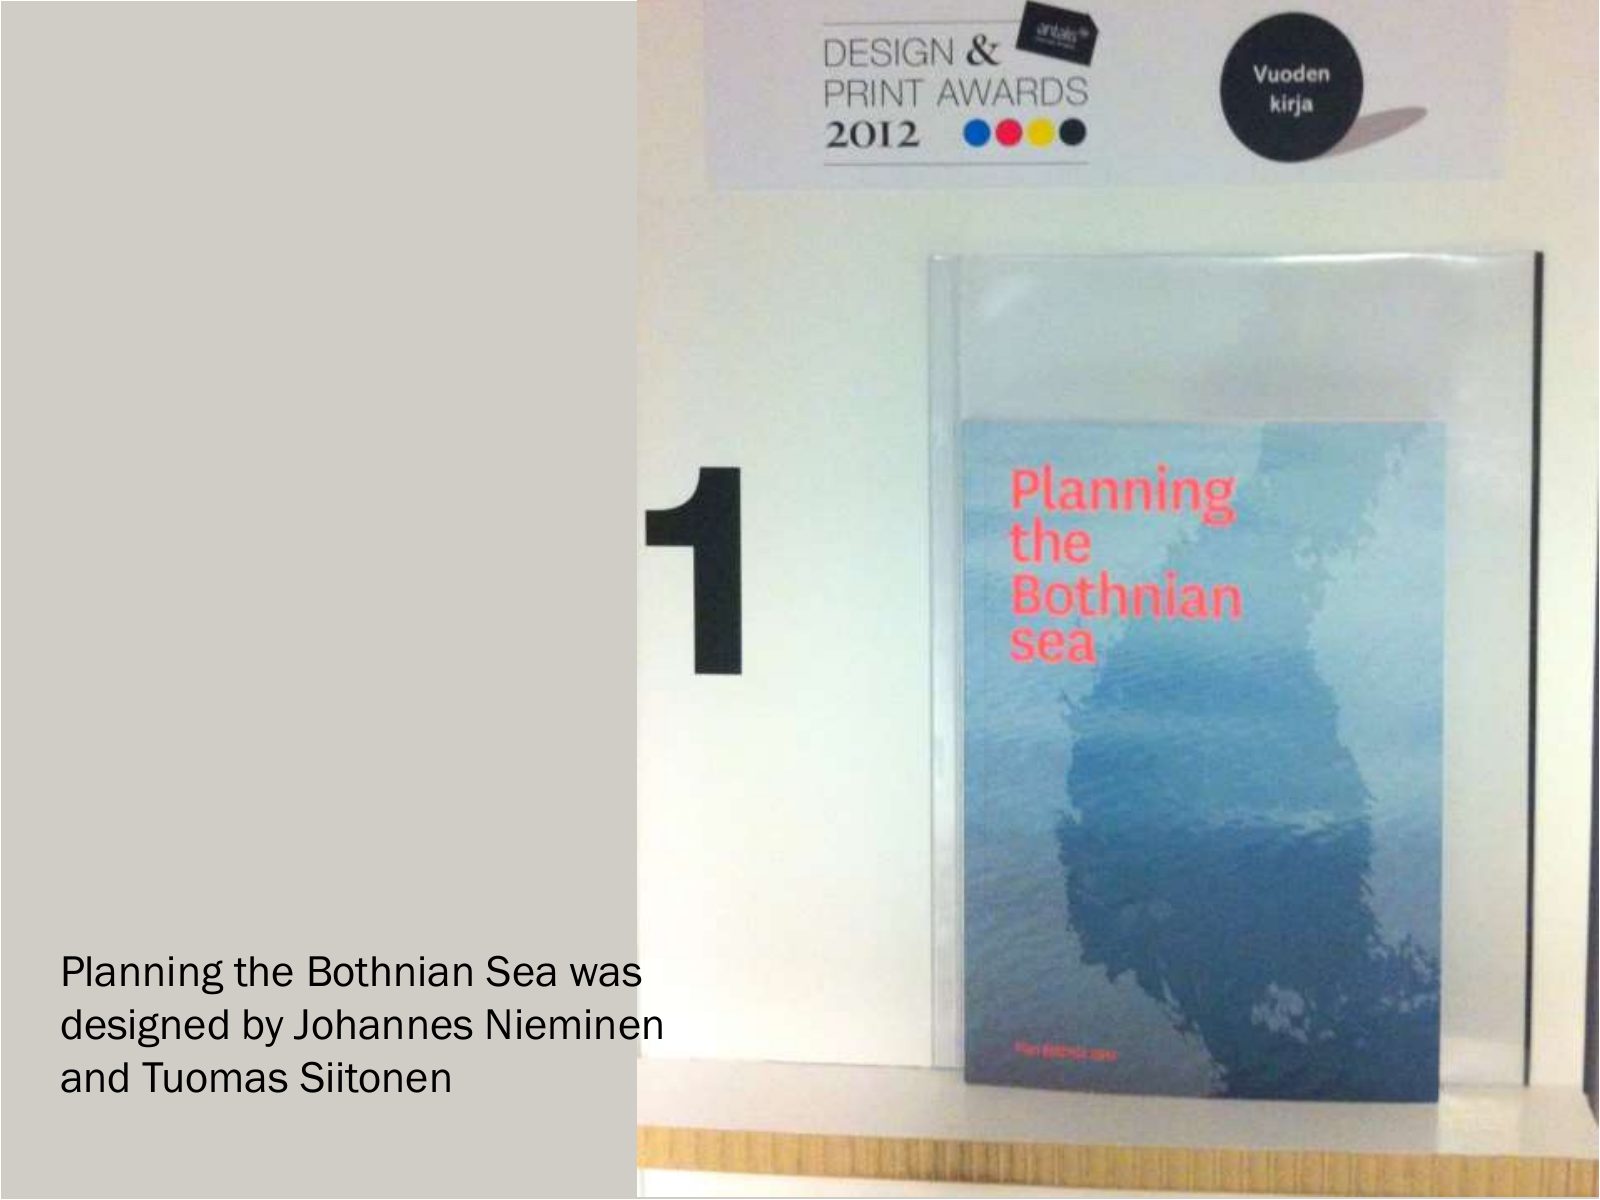
Slide 46 of 75: Planning the Bothnian Sea was designed by Johannes Nieminen and Tuomas Siitonen
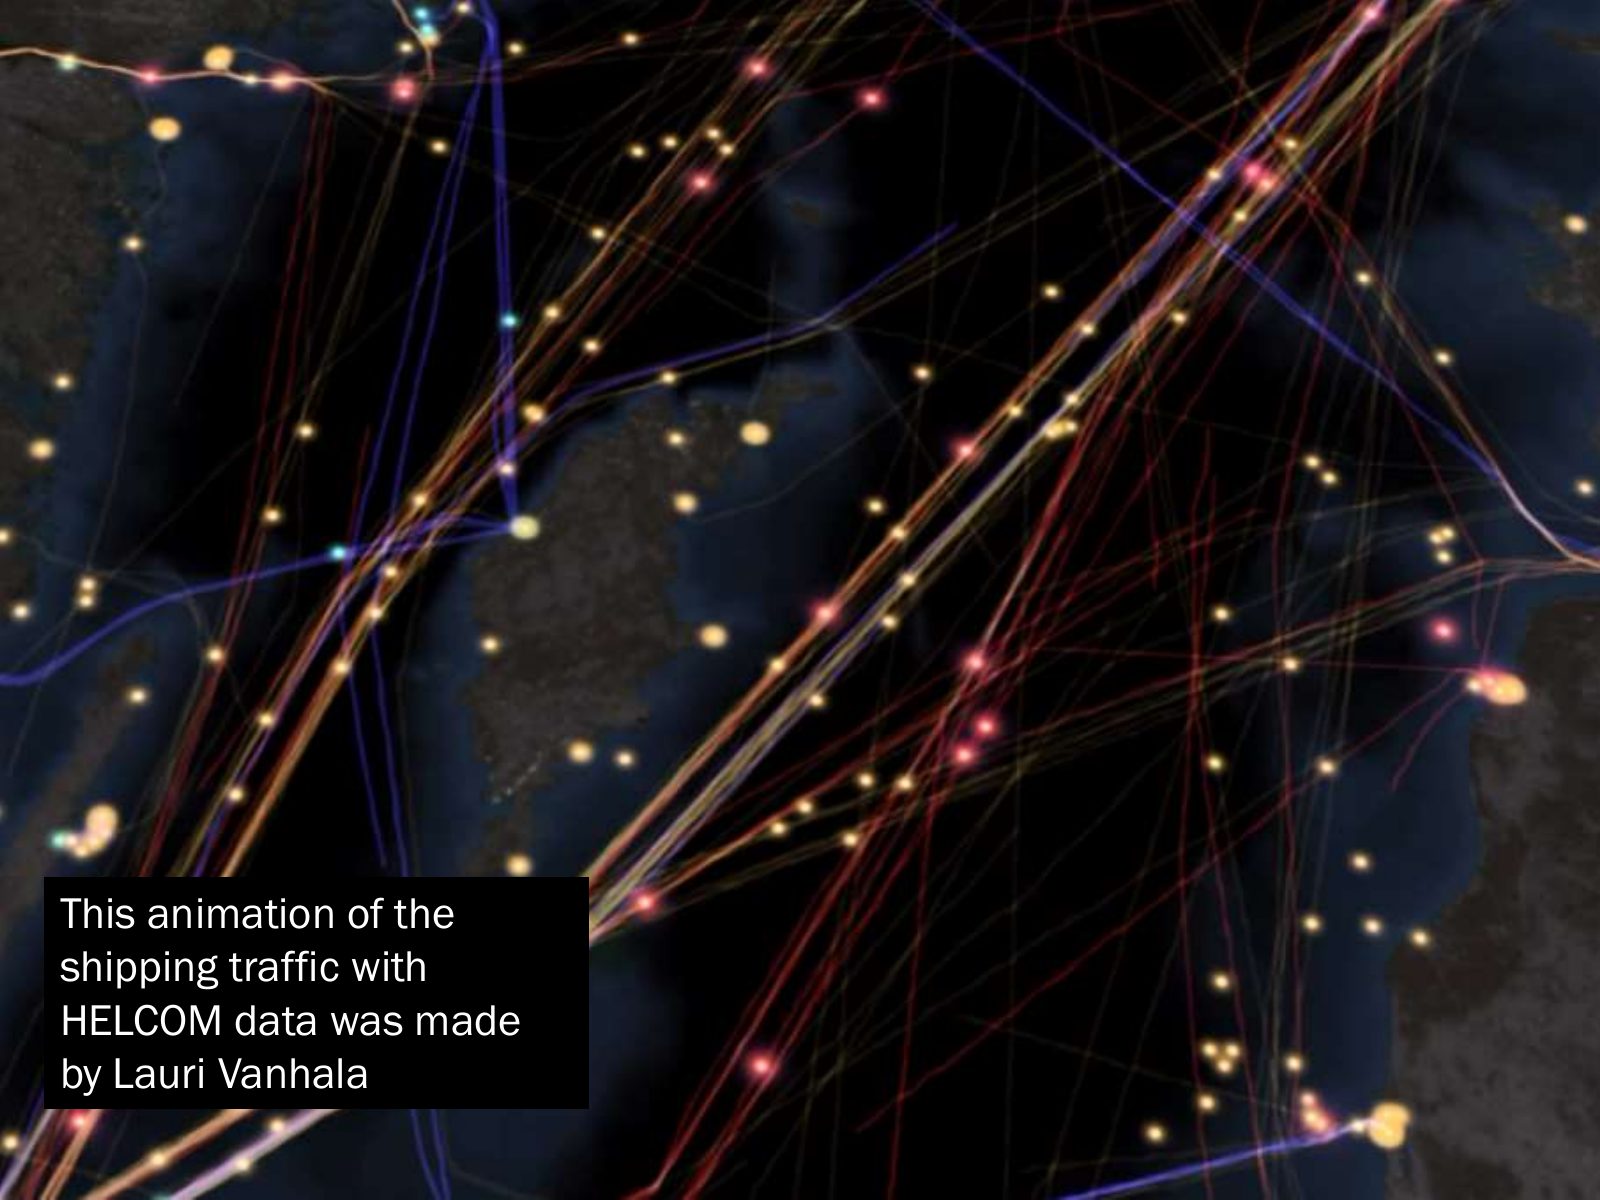
Slide 47 of 75: This animation of the shipping traffic with HELCOM data was made by Lauri Vanhala
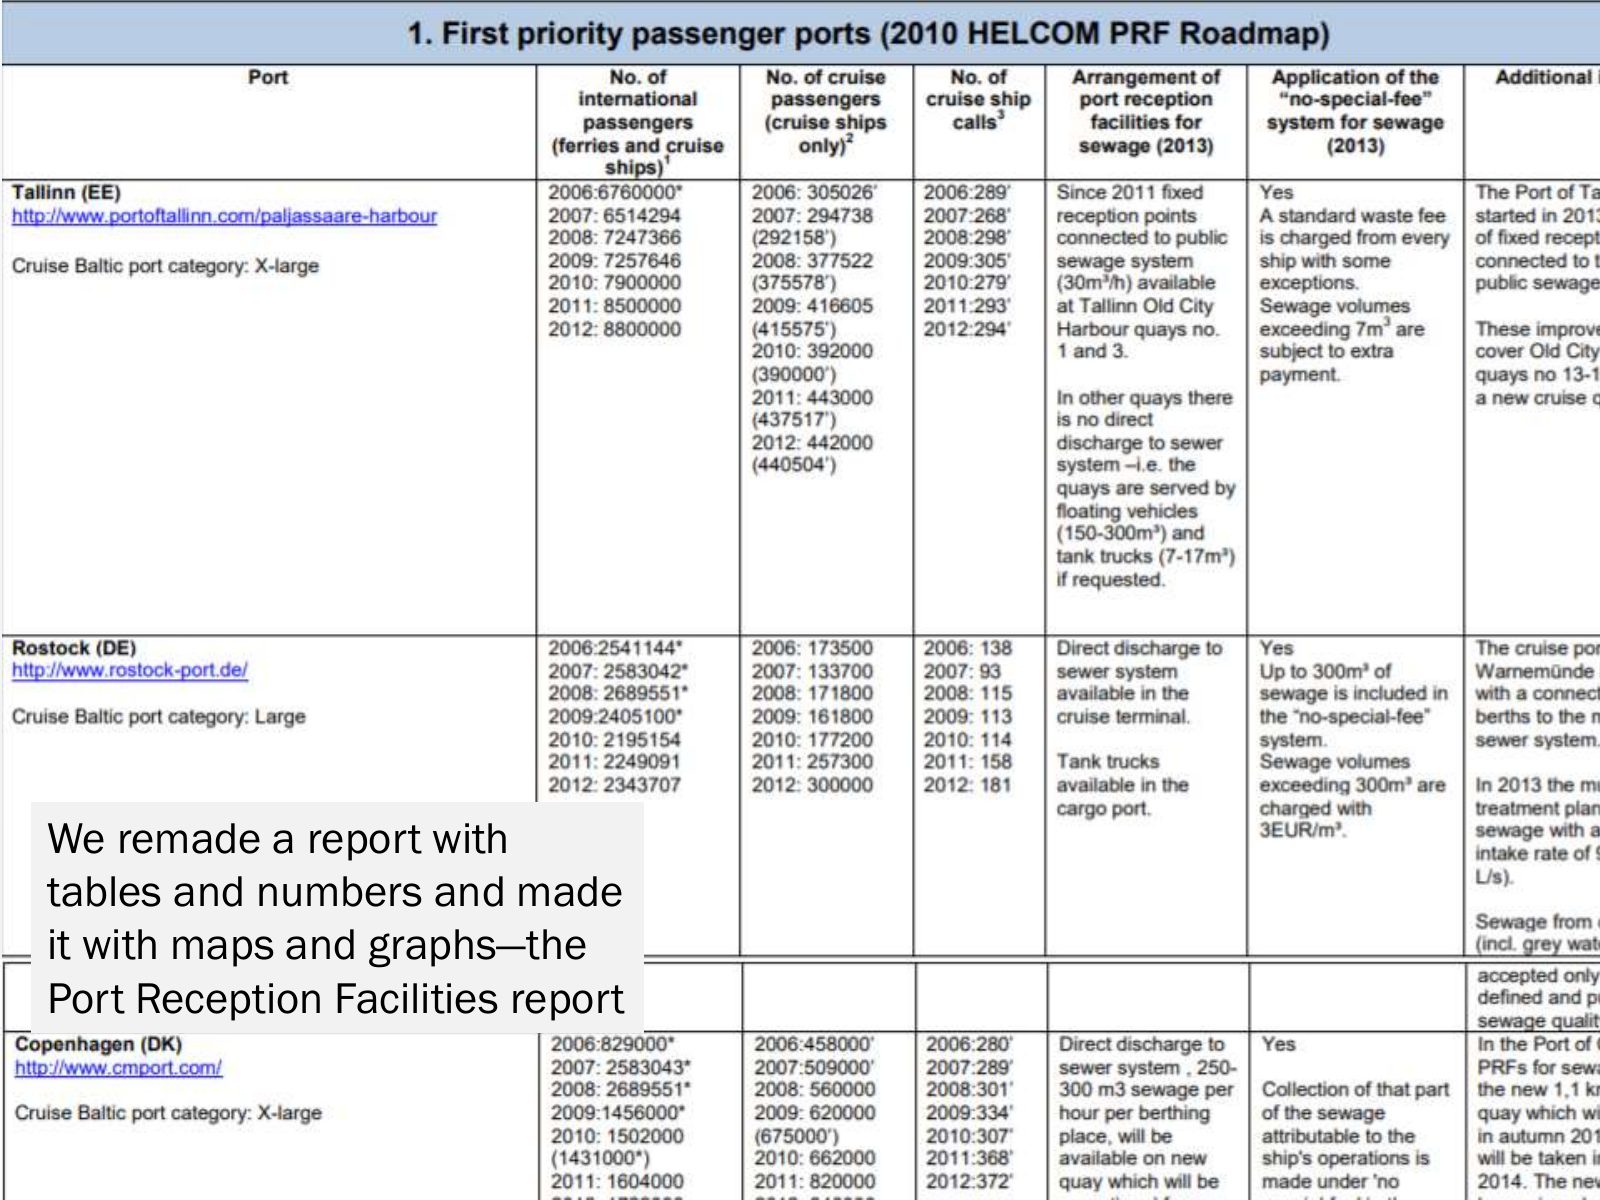
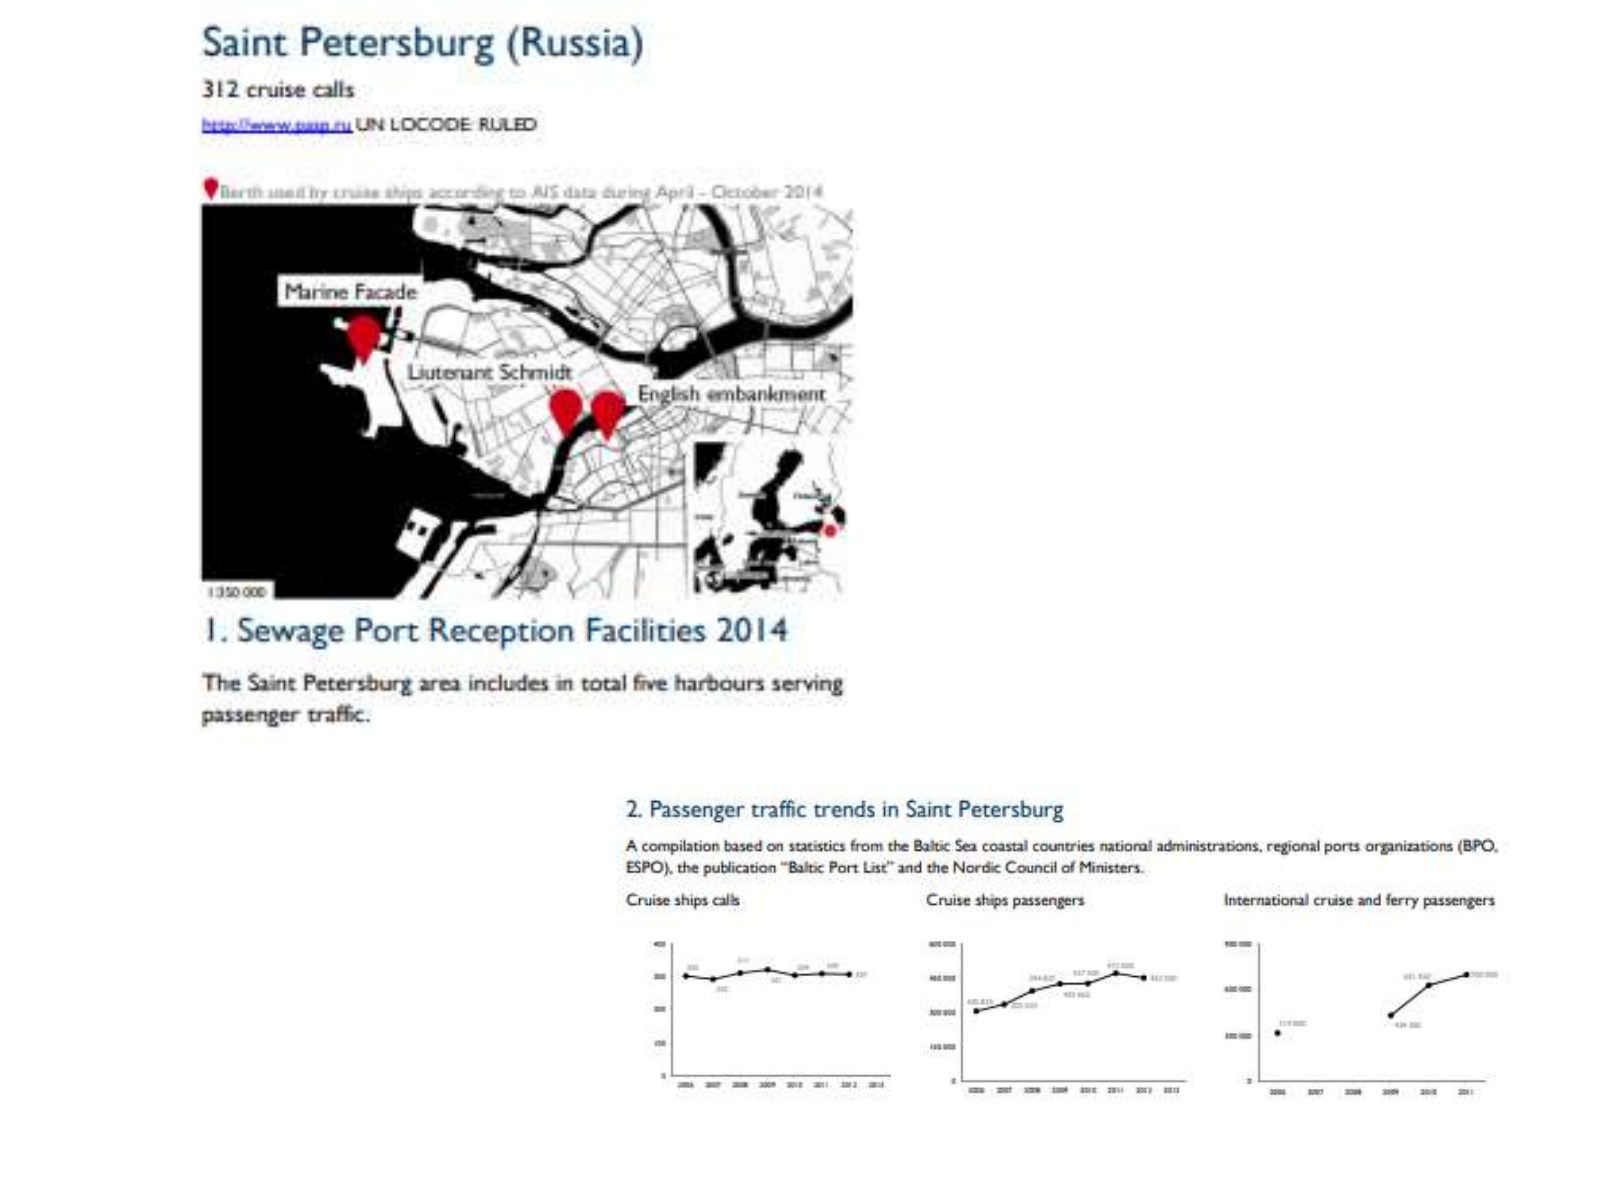
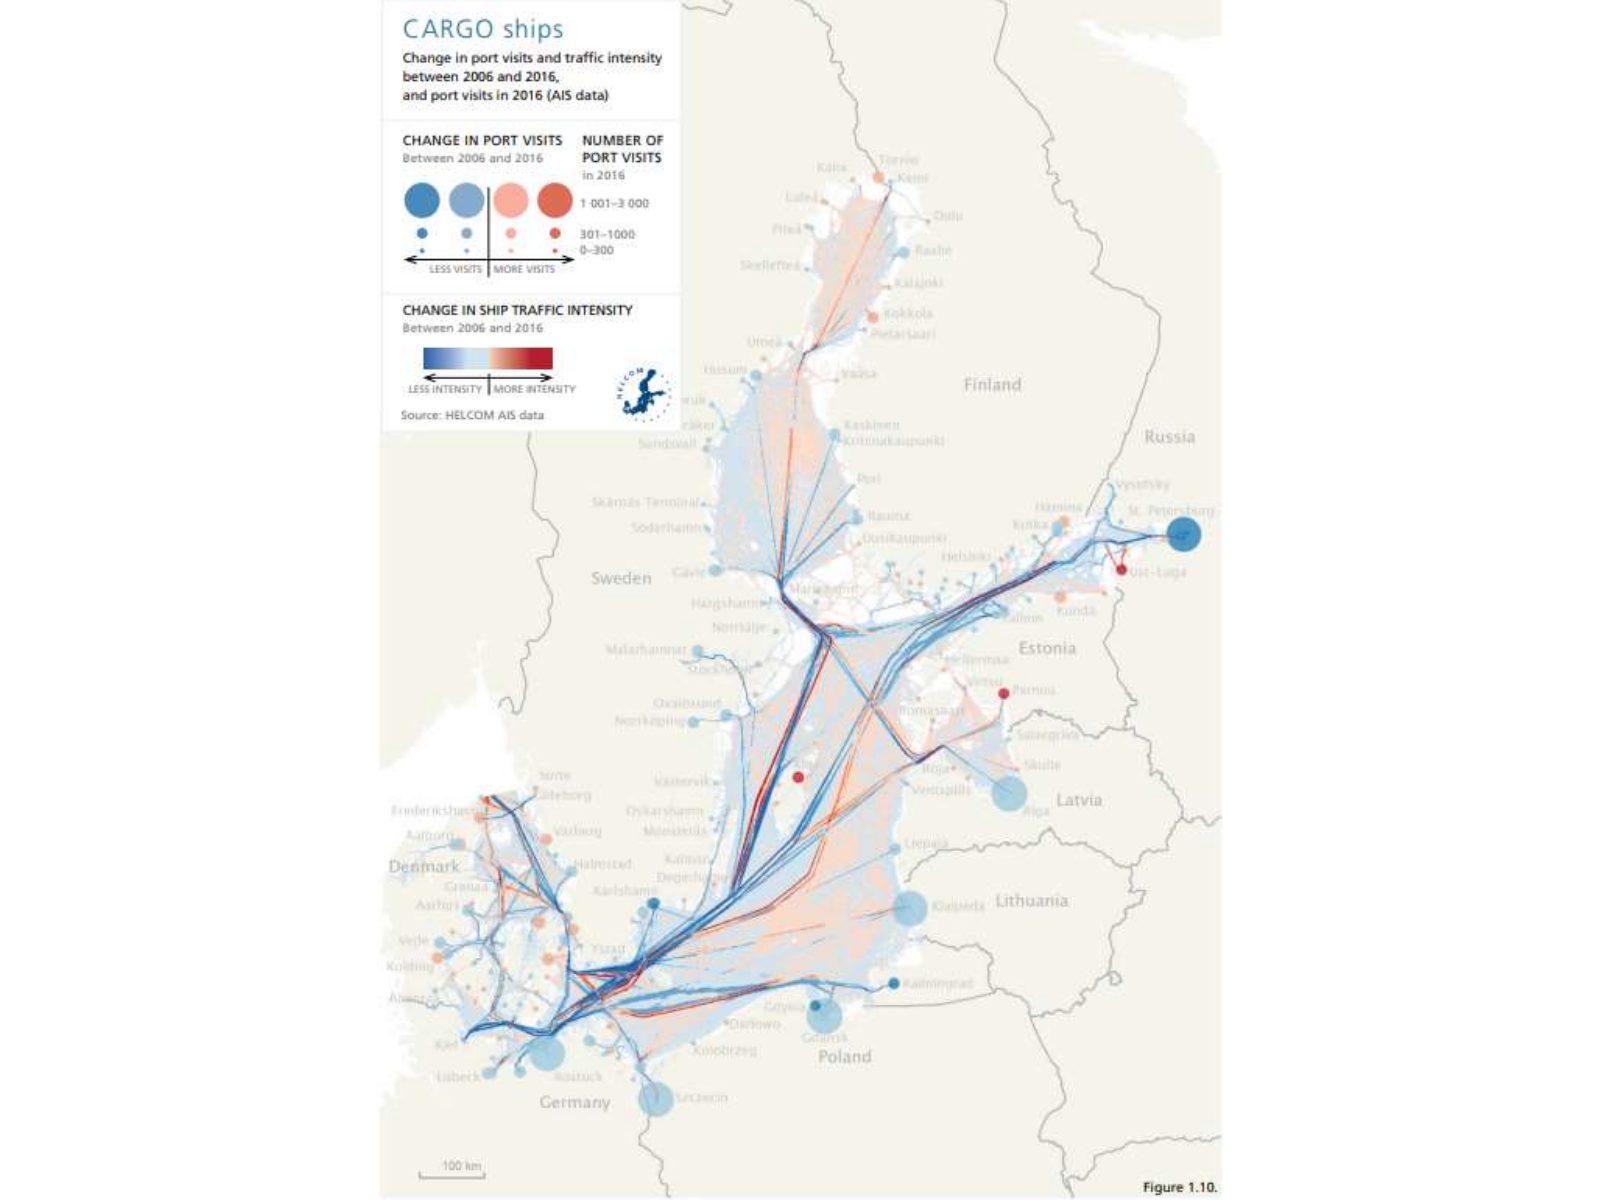
Slide 48 of 75: We remade a report with tables and numbers and made it with maps and graphs—the Port Reception Facilities report
Slide 49 of 75: picture slide without text
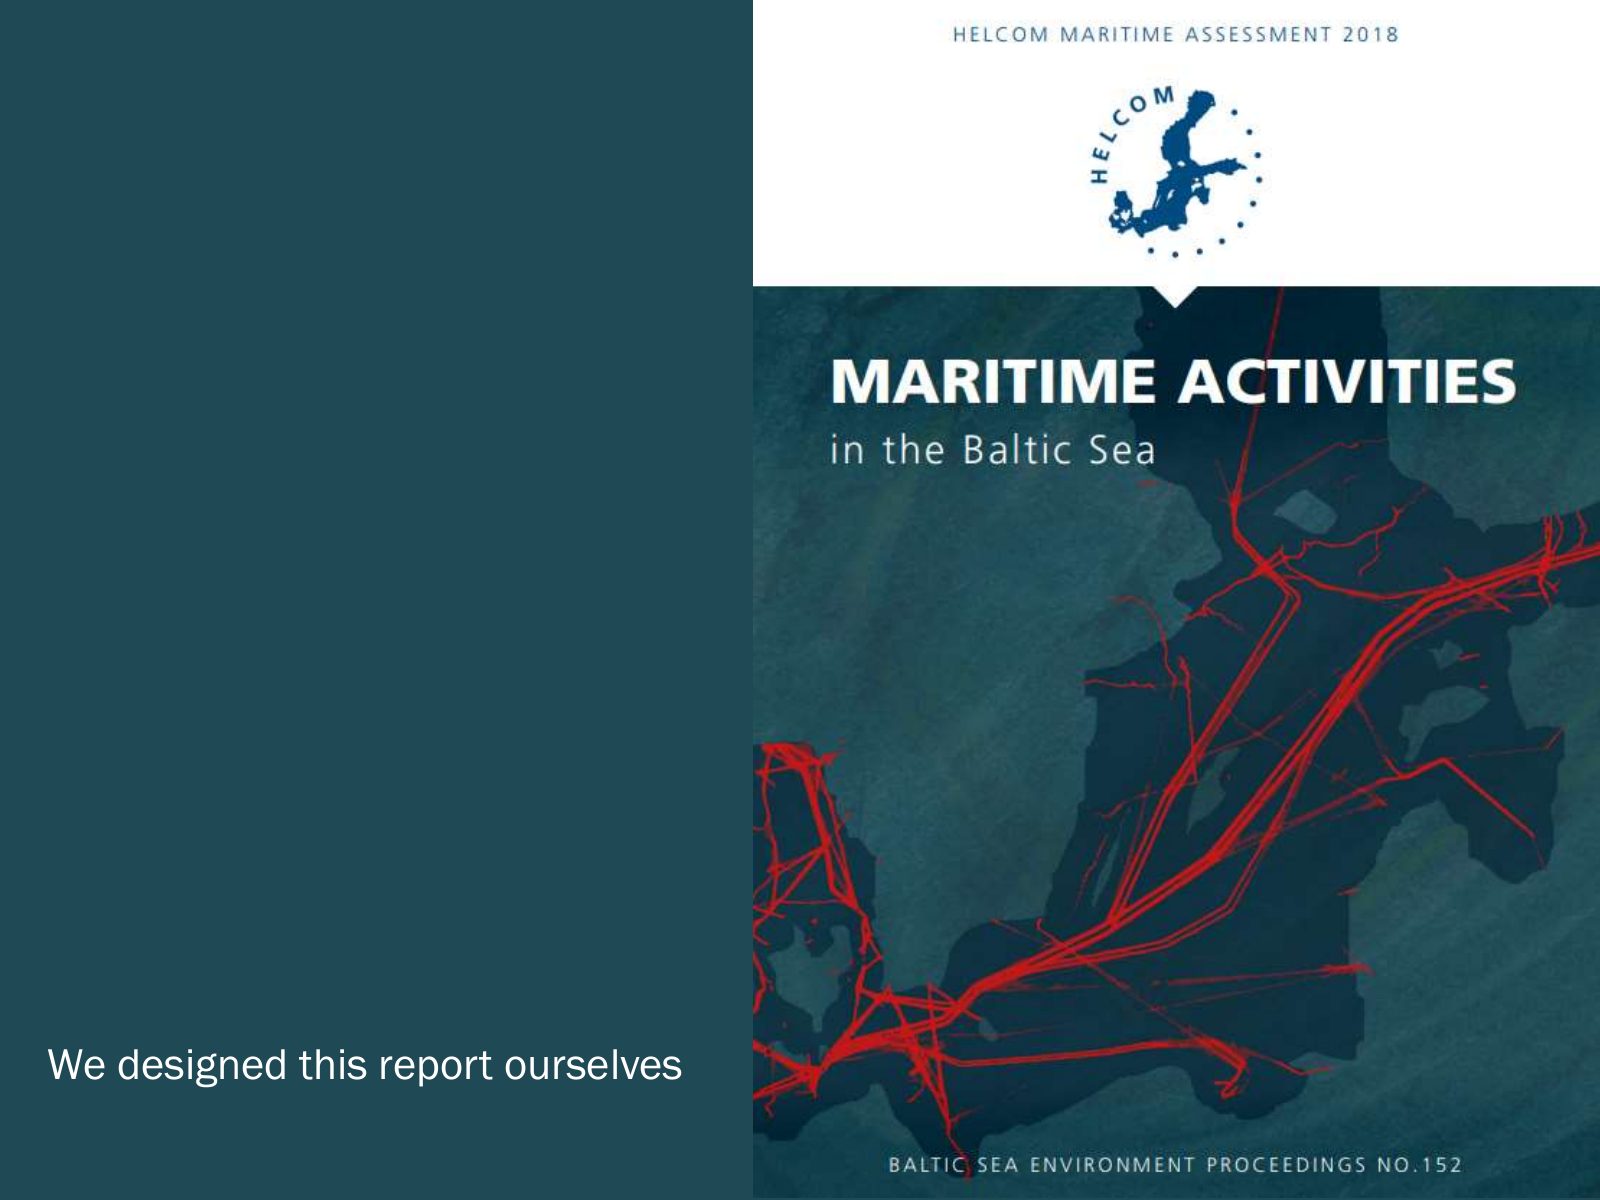
Slide 50 of 75: We designed this report ourselves
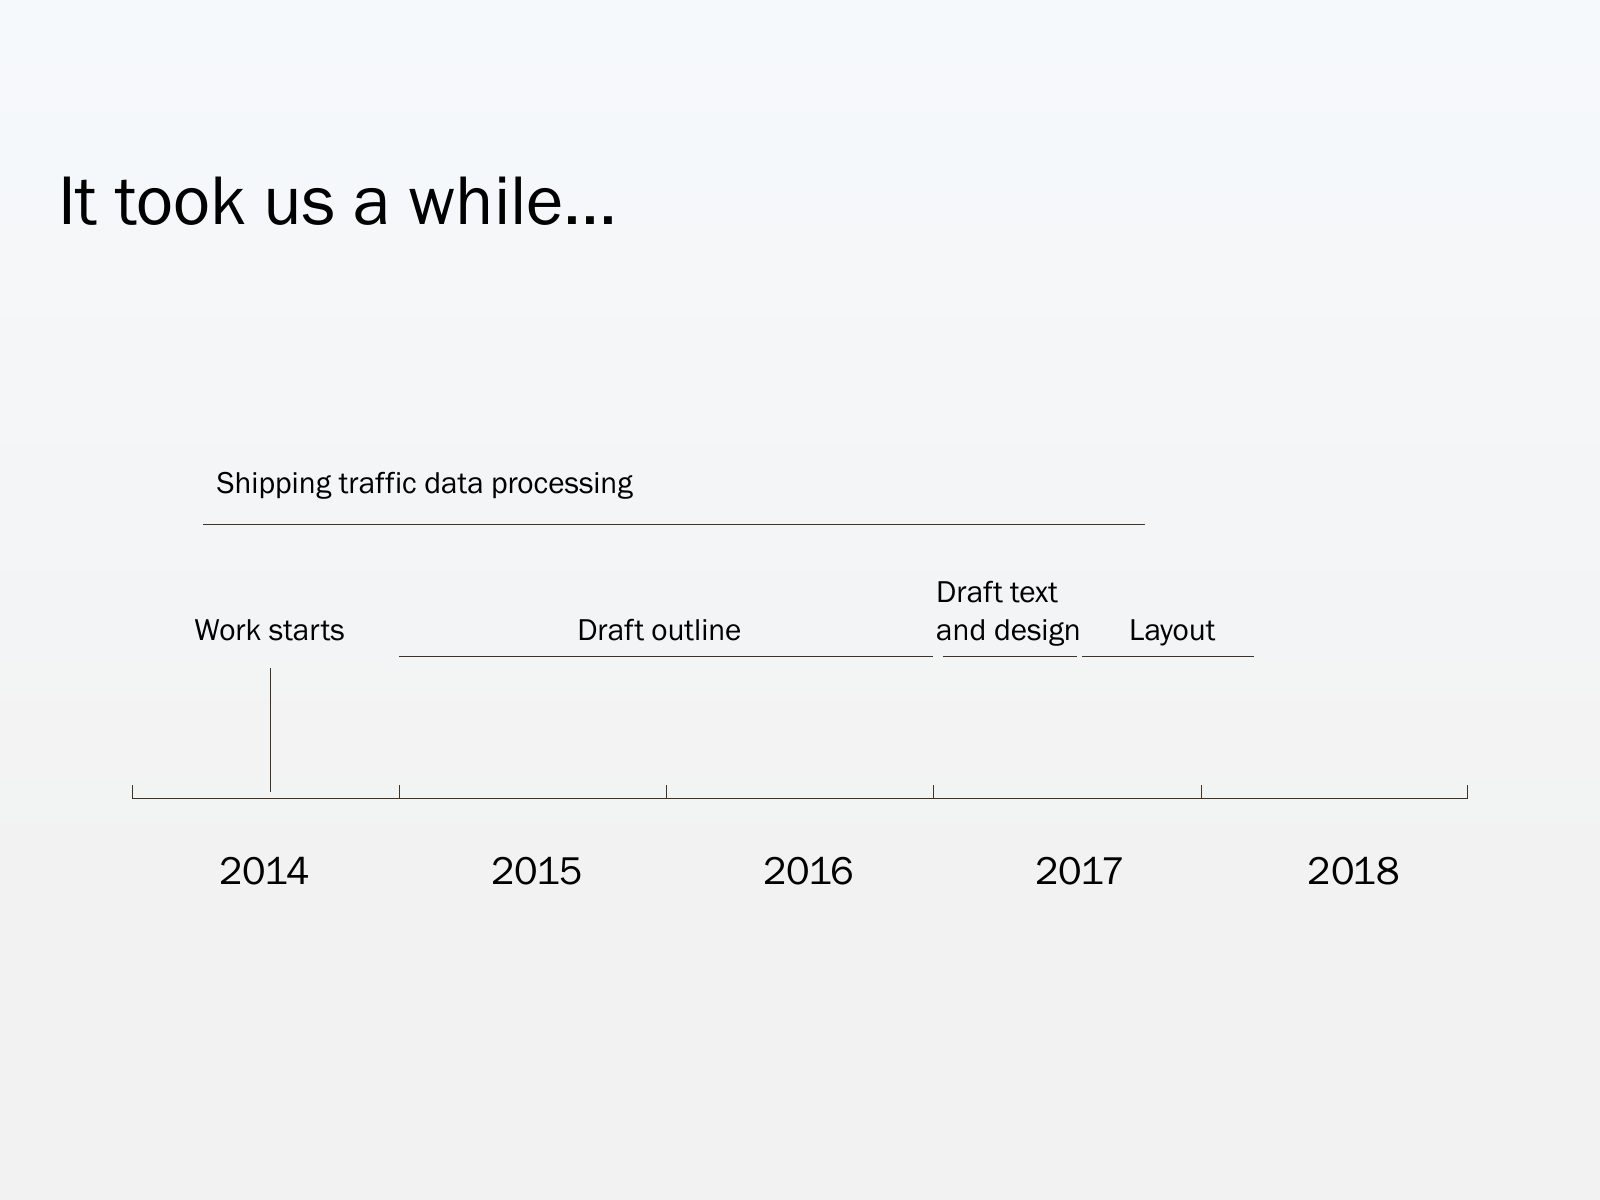
Slide 51 of 75: It took us a while... Shipping traffic data processing Draft text Work starts Draft outline and design Layout 2014 2015 2016 2017 2018
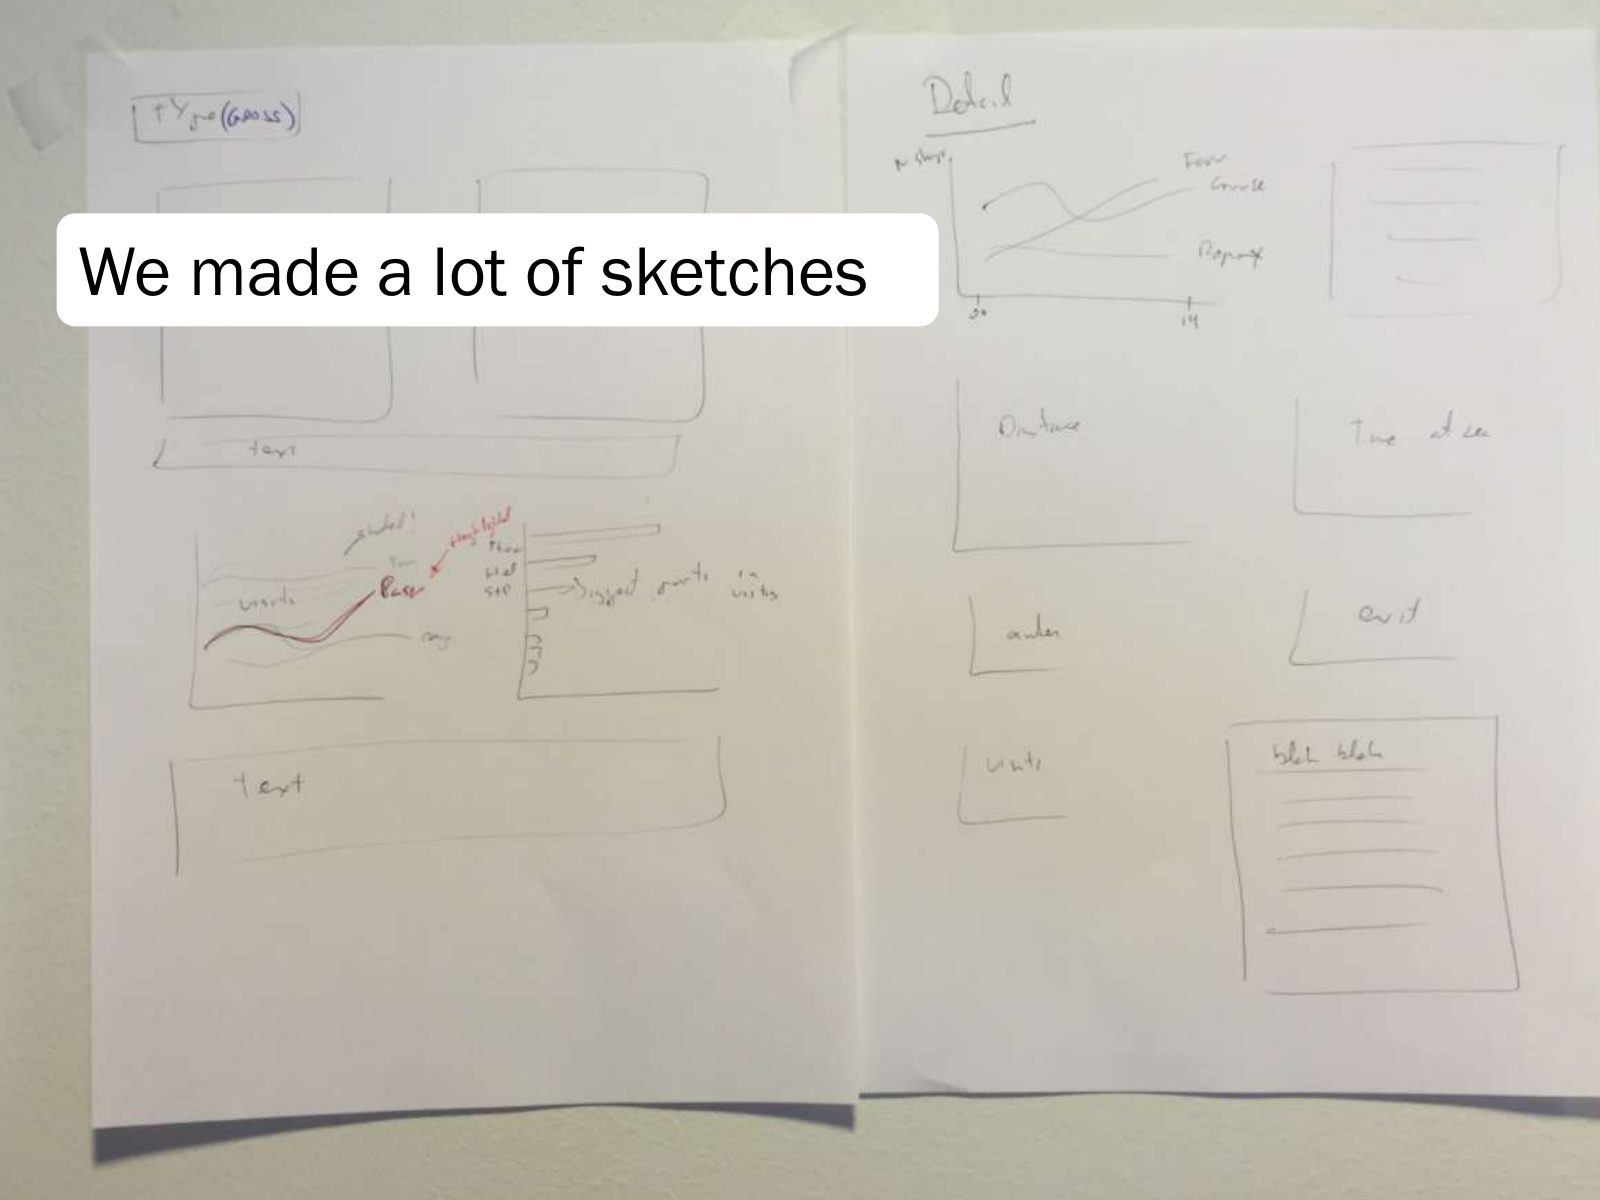
Slide 52 of 75: We made a lot of sketches
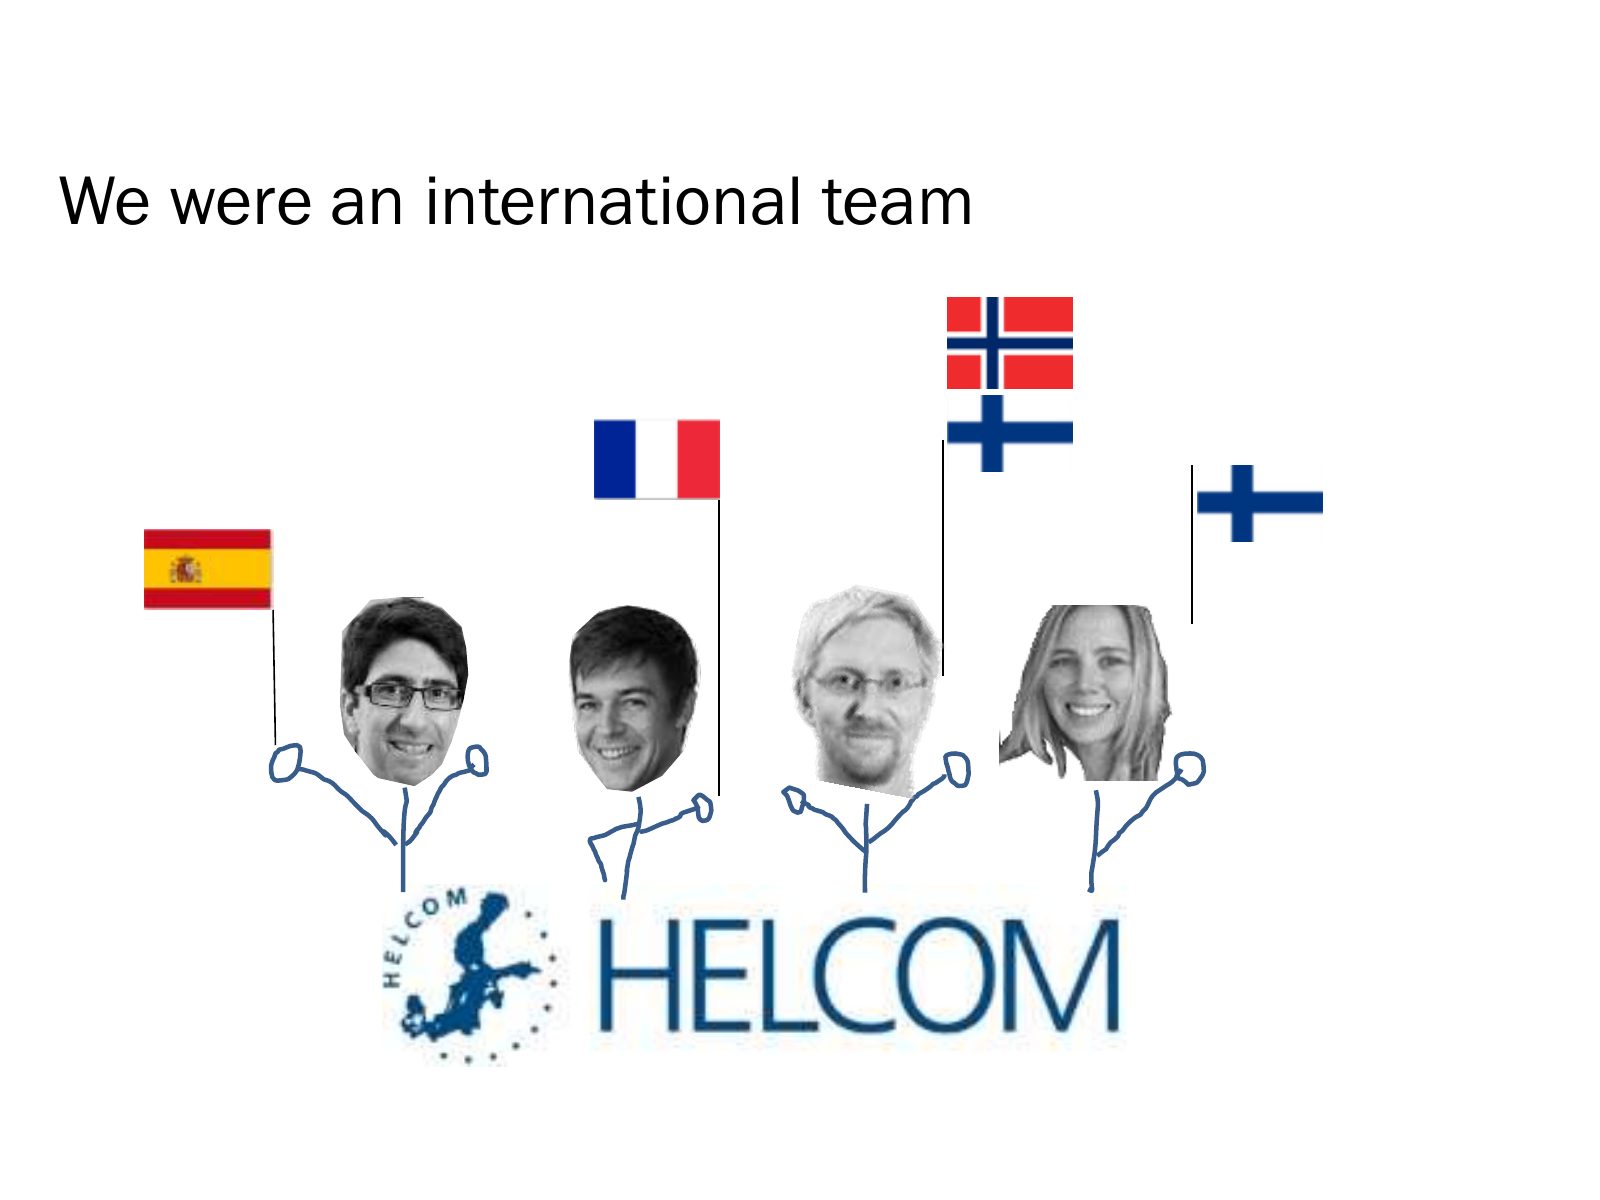
Slide 53 of 75: We were an international team
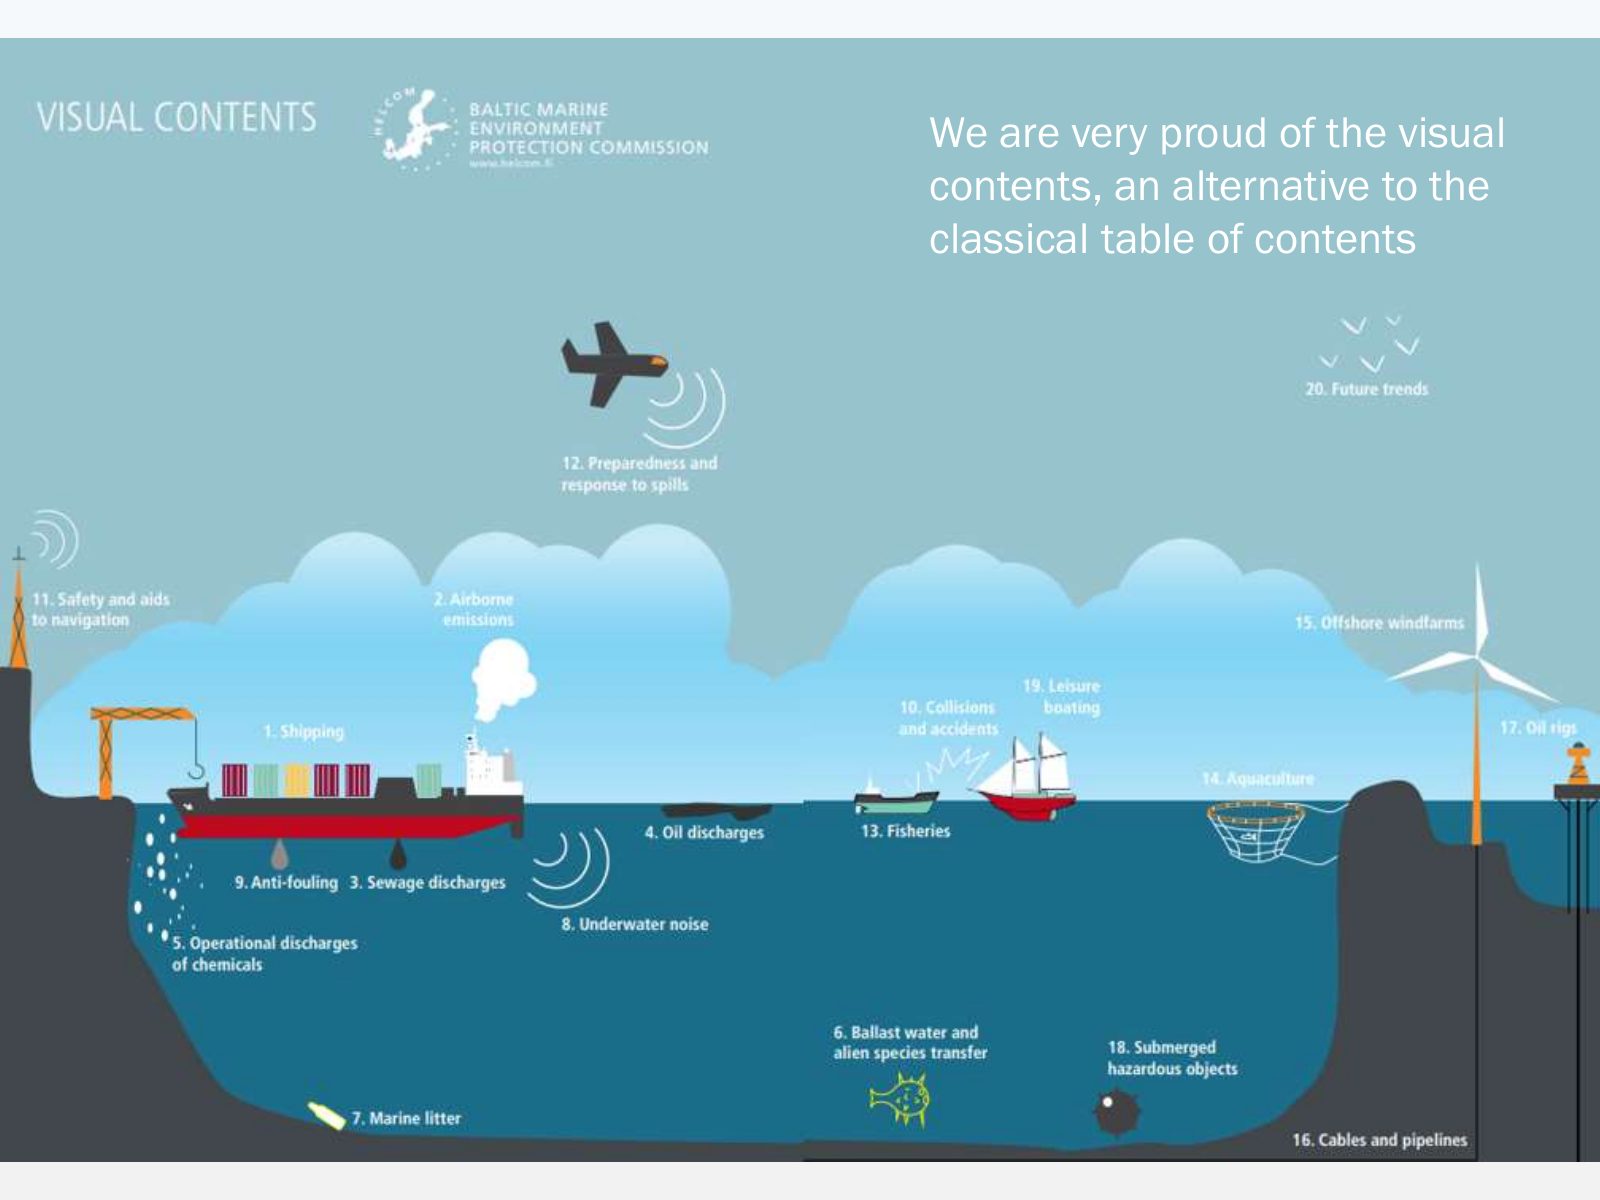
Slide 54 of 75: We are very proud of the visual contents, an alternative to the classical table of contents
Slide 55 of 75: picture slide without text
Slide 56 of 75: picture slide without text
Slide 57 of 75: picture slide without text
Slide 58 of 75: picture slide without text
Slide 59 of 75: picture slide without text
Slide 60 of 75: That’s all folks! To sum up, we think it’s worthy taking the effort to visualize data properly.
Slide 61 of 75: But it’s challenging! It requires some skills but, above all, will and motivation.
Slide 62 of 75: Before we finish let’s have a look a those graphs you saw earlier about the status of the Baltic Sea.
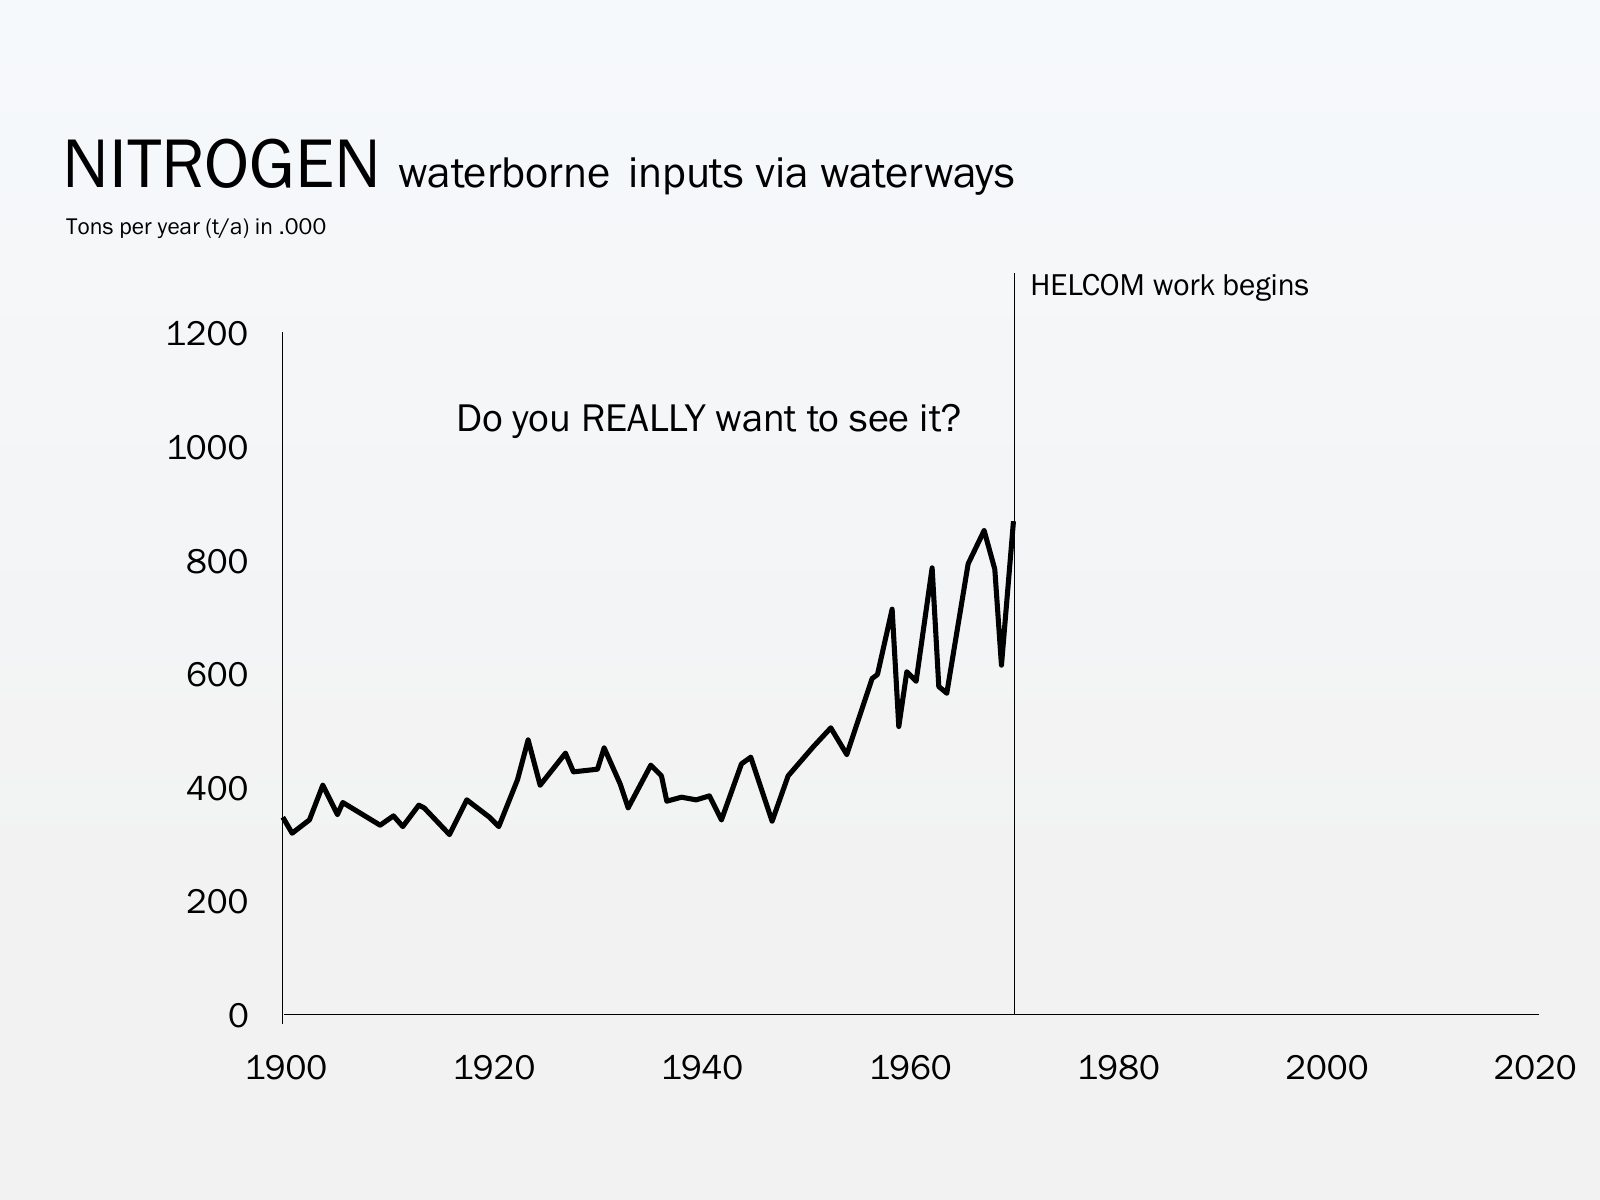
Slide 63 of 75: NITROGEN waterborne inputs via waterways Tons per year (t/a) in .000 1200 We saw that the loads of 1000 nitrogen into the sea were increasing dramatically fr…
Slide 64 of 75: NITROGEN waterborne inputs via waterways Tons per year (t/a) in .000 HELCOM work begins 1200 In 1974 the Helsinki 1000 Convention was signed 800 600 400 200…
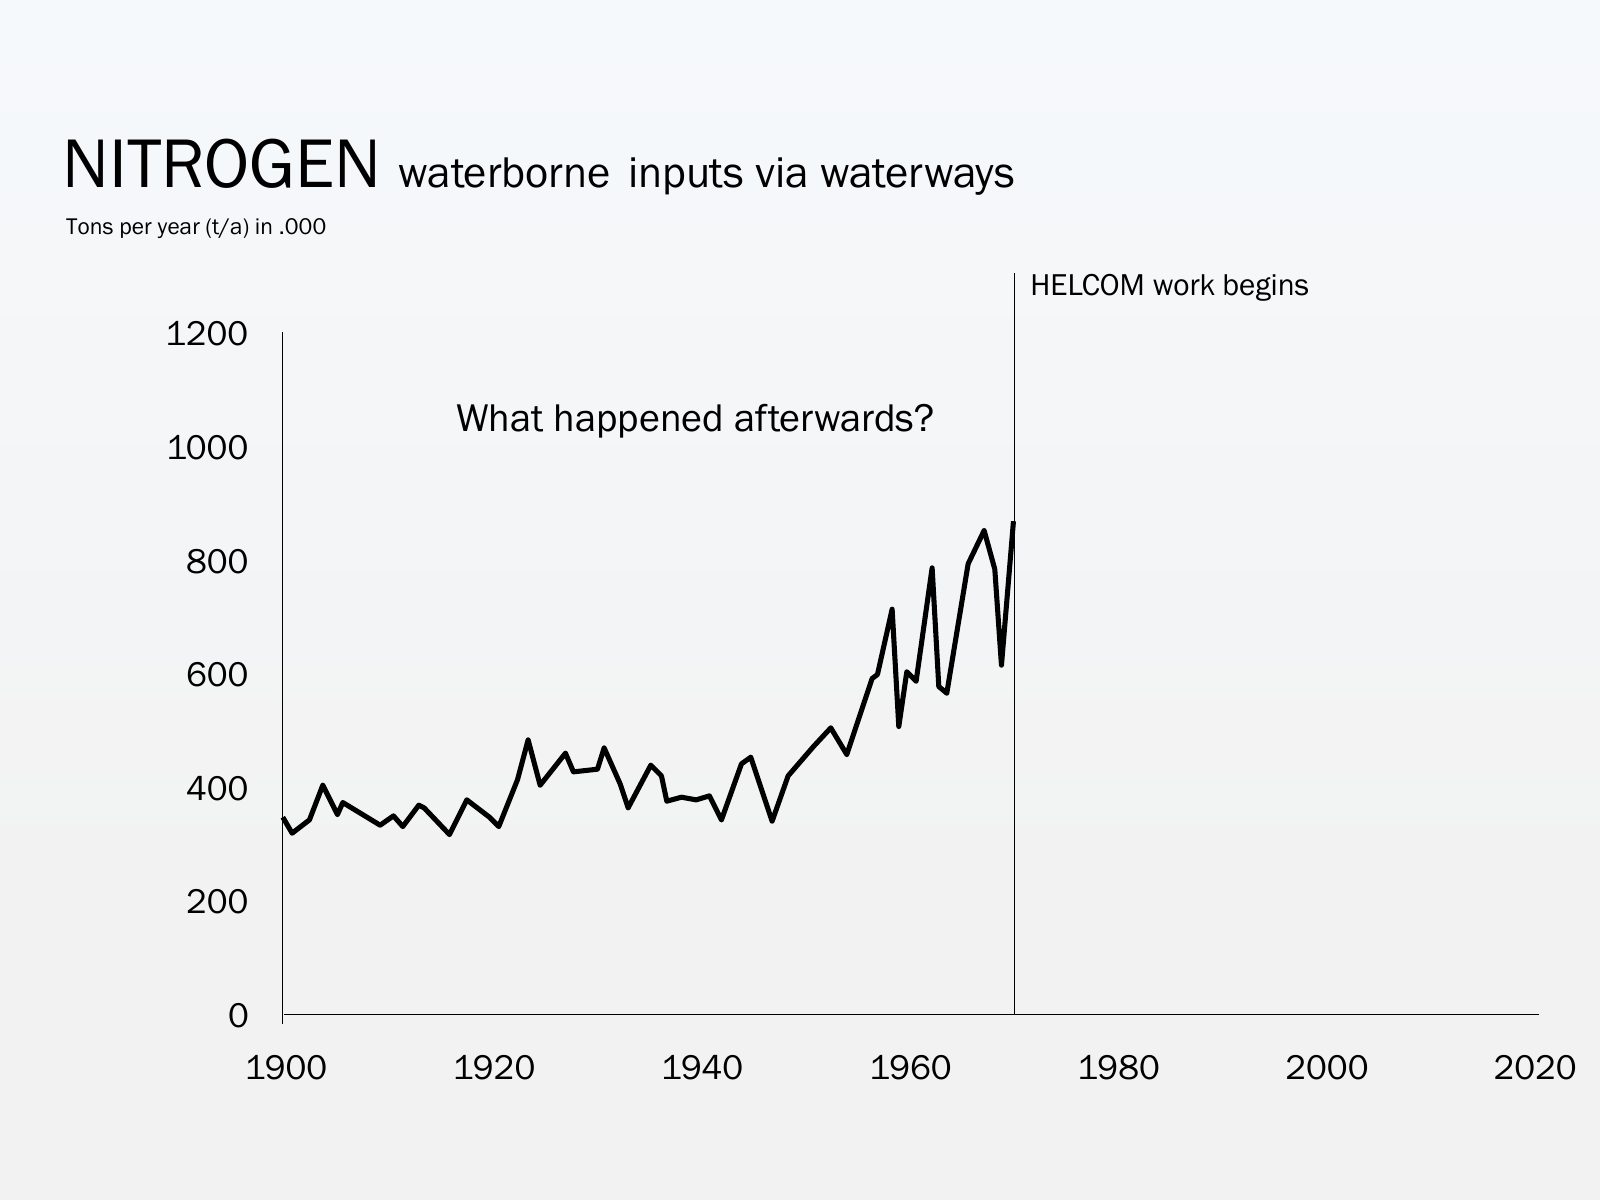
Slide 65 of 75: NITROGEN waterborne inputs via waterways Tons per year (t/a) in .000 HELCOM work begins 1200 What happened afterwards? 1000 800 600 400 200 0 1900 1920 1940…
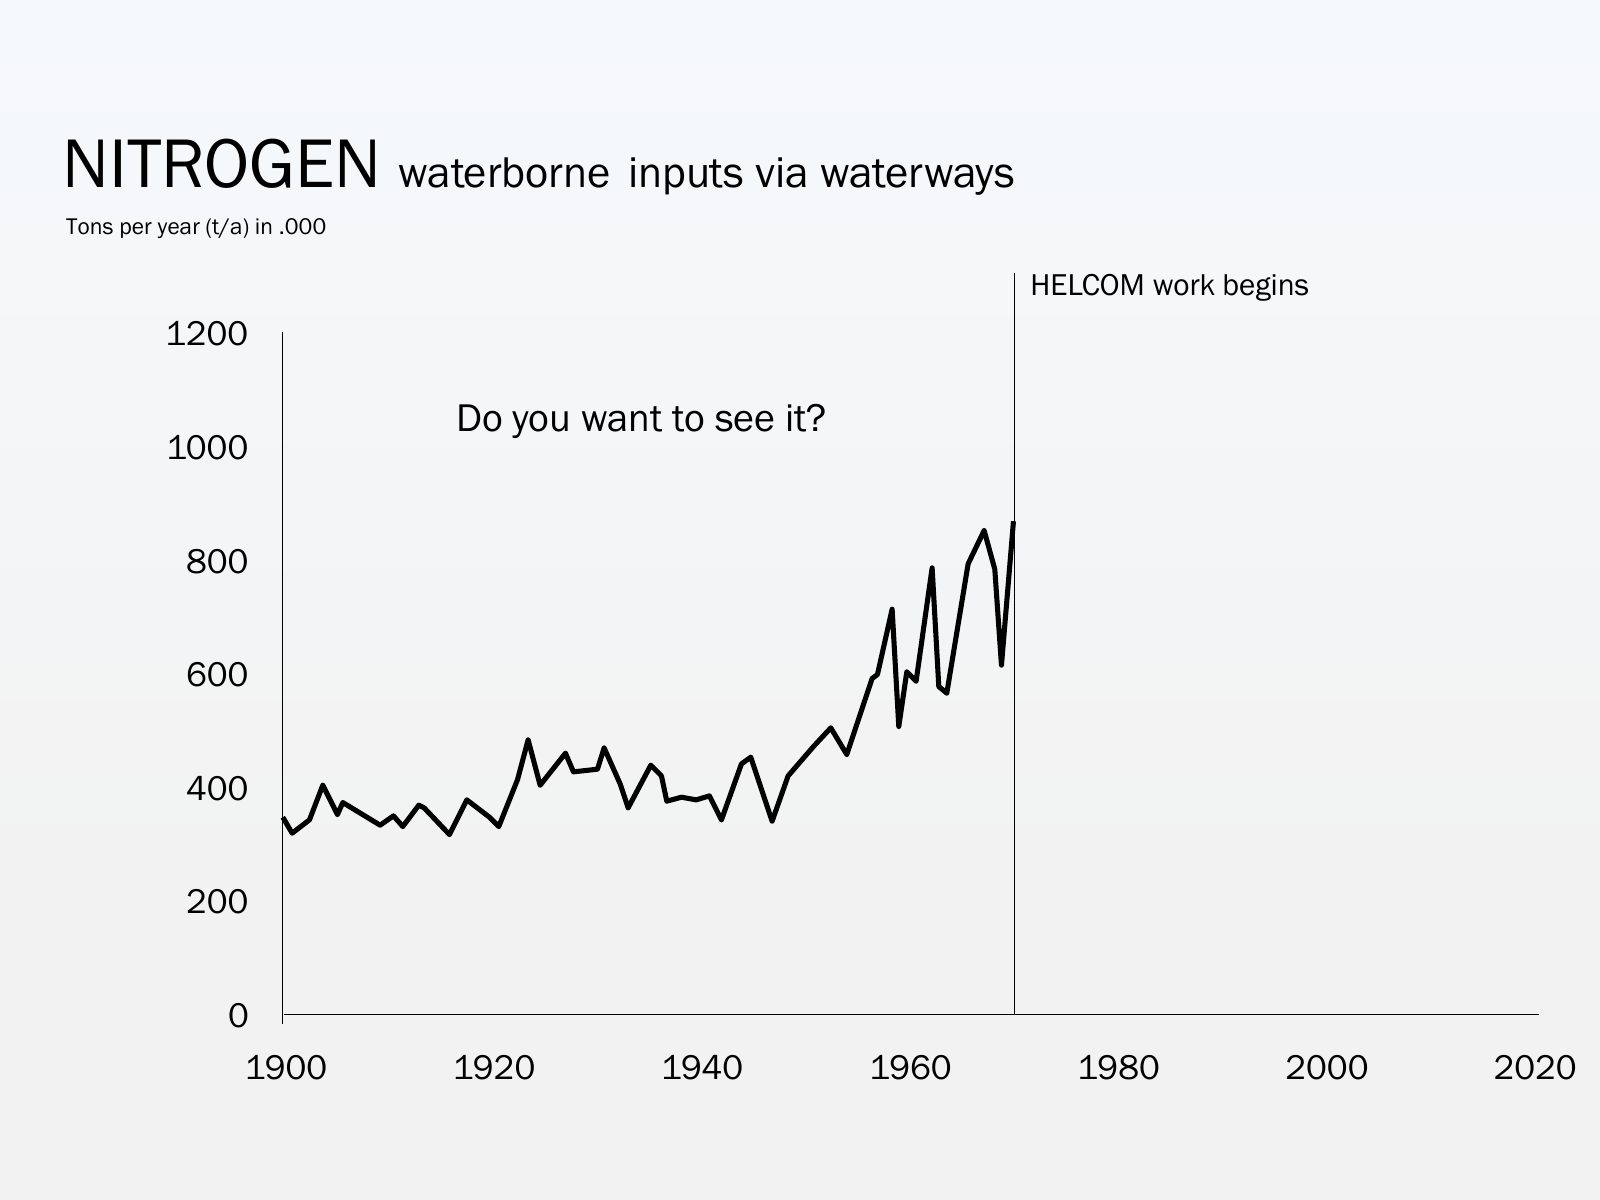
Slide 66 of 75: NITROGEN waterborne inputs via waterways Tons per year (t/a) in .000 HELCOM work begins 1200 Do you want to see it? 1000 800 600 400 200 0 1900 1920 1940 196…
Slide 67 of 75: NITROGEN waterborne inputs via waterways Tons per year (t/a) in .000 HELCOM work begins 1200 Do you REALLY want to see it? 1000 800 600 400 200 0 1900 1920 1…
Slide 68 of 75: NITROGEN waterborne inputs via waterways Tons per year (t/a) in .000 HELCOM work begins 1200 Yes! After HELCOM started its 1000 activities the nitrogen loads…
Slide 69 of 75: PHOSPHORUS waterborne inputs via waterways Tons per year (t/a) in .000 HELCOM work begins 80 And what happened with the 70 phophorus loads? 60 50 40 30 20 10…
Slide 70 of 75: PHOSPHORUS waterborne inputs via waterways Tons per year (t/a) in .000 HELCOM work begins 80 Remember that excess of both 70 nitrogen and phosphorus contribu…
Slide 71 of 75: PHOSPHORUS waterborne inputs via waterways Tons per year (t/a) in .000 HELCOM work begins 80 Yes! The reduction of 70 phosphorus into the Baltic Sea decrease…
Slide 72 of 75: WATER CLARITY summer Secchi depth In meters HELCOM work begins 11 10 9 8 7 But what happened with the water clarity? 6 1900 1920 1940 1960 1980 2000 2020
Slide 73 of 75: WATER CLARITY summer Secchi depth In meters HELCOM work begins 11 10 9 8 7 If there are less nitrogen and phosphorus, in other words less polution, the water…
Slide 74 of 75: WATER CLARITY summer Secchi depth In meters HELCOM work begins 11 10 9 8 7 WRONG! Nitrogen, phosphorus and other contaminants are decreasing but this reducti…
Slide 75 of 75: picture slide without text
1 / 75
Swipe, use the arrows or the keyboard arrow keys. Download the slides (PDF, 2.1 MB)

← All stories